
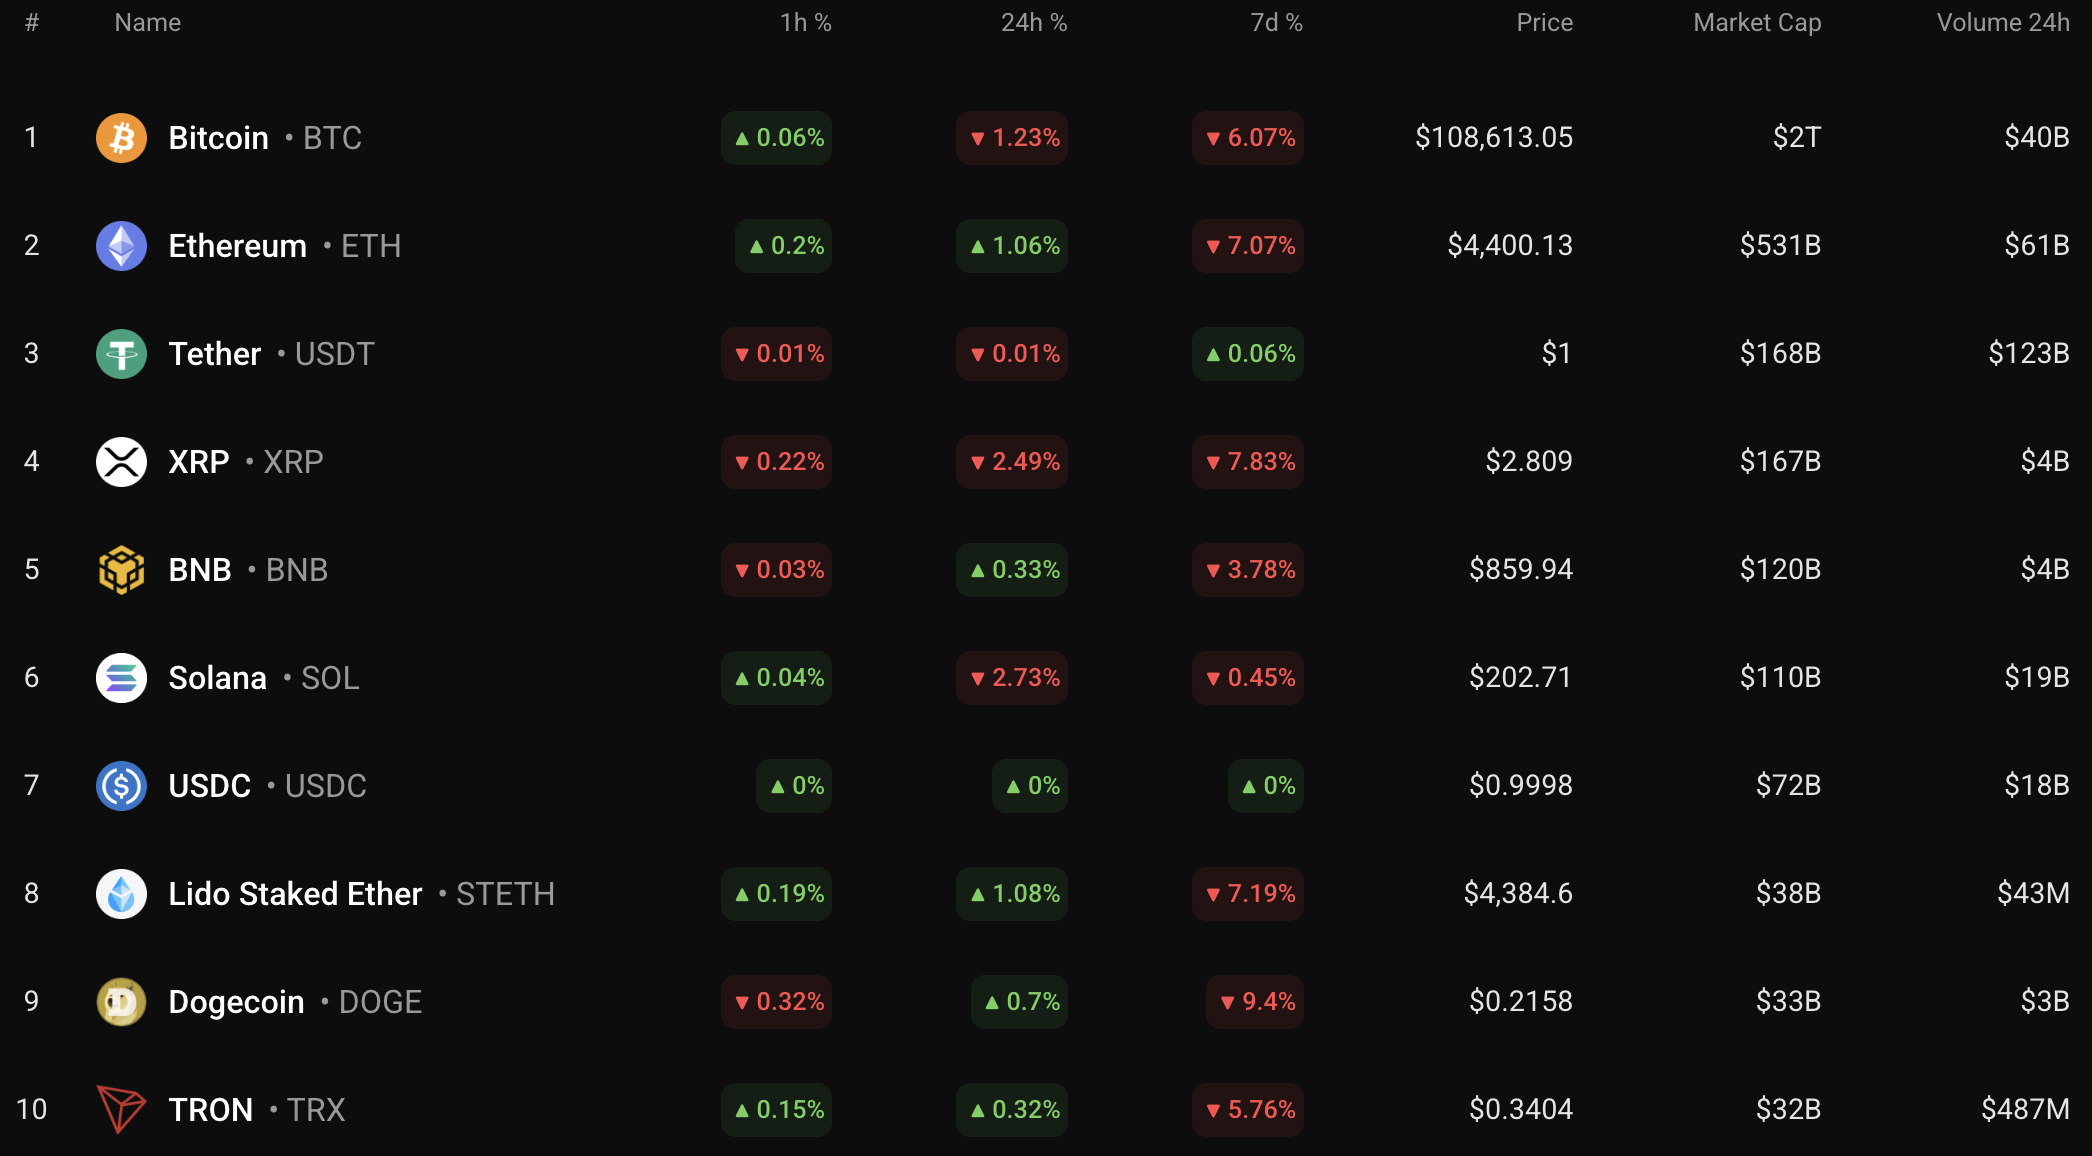
The rates of some coins are rising today while others are in the red zone, according to CoinStats.
BTC/USD
The price of Bitcoin (BTC) has declined by 1.23% over the last day.
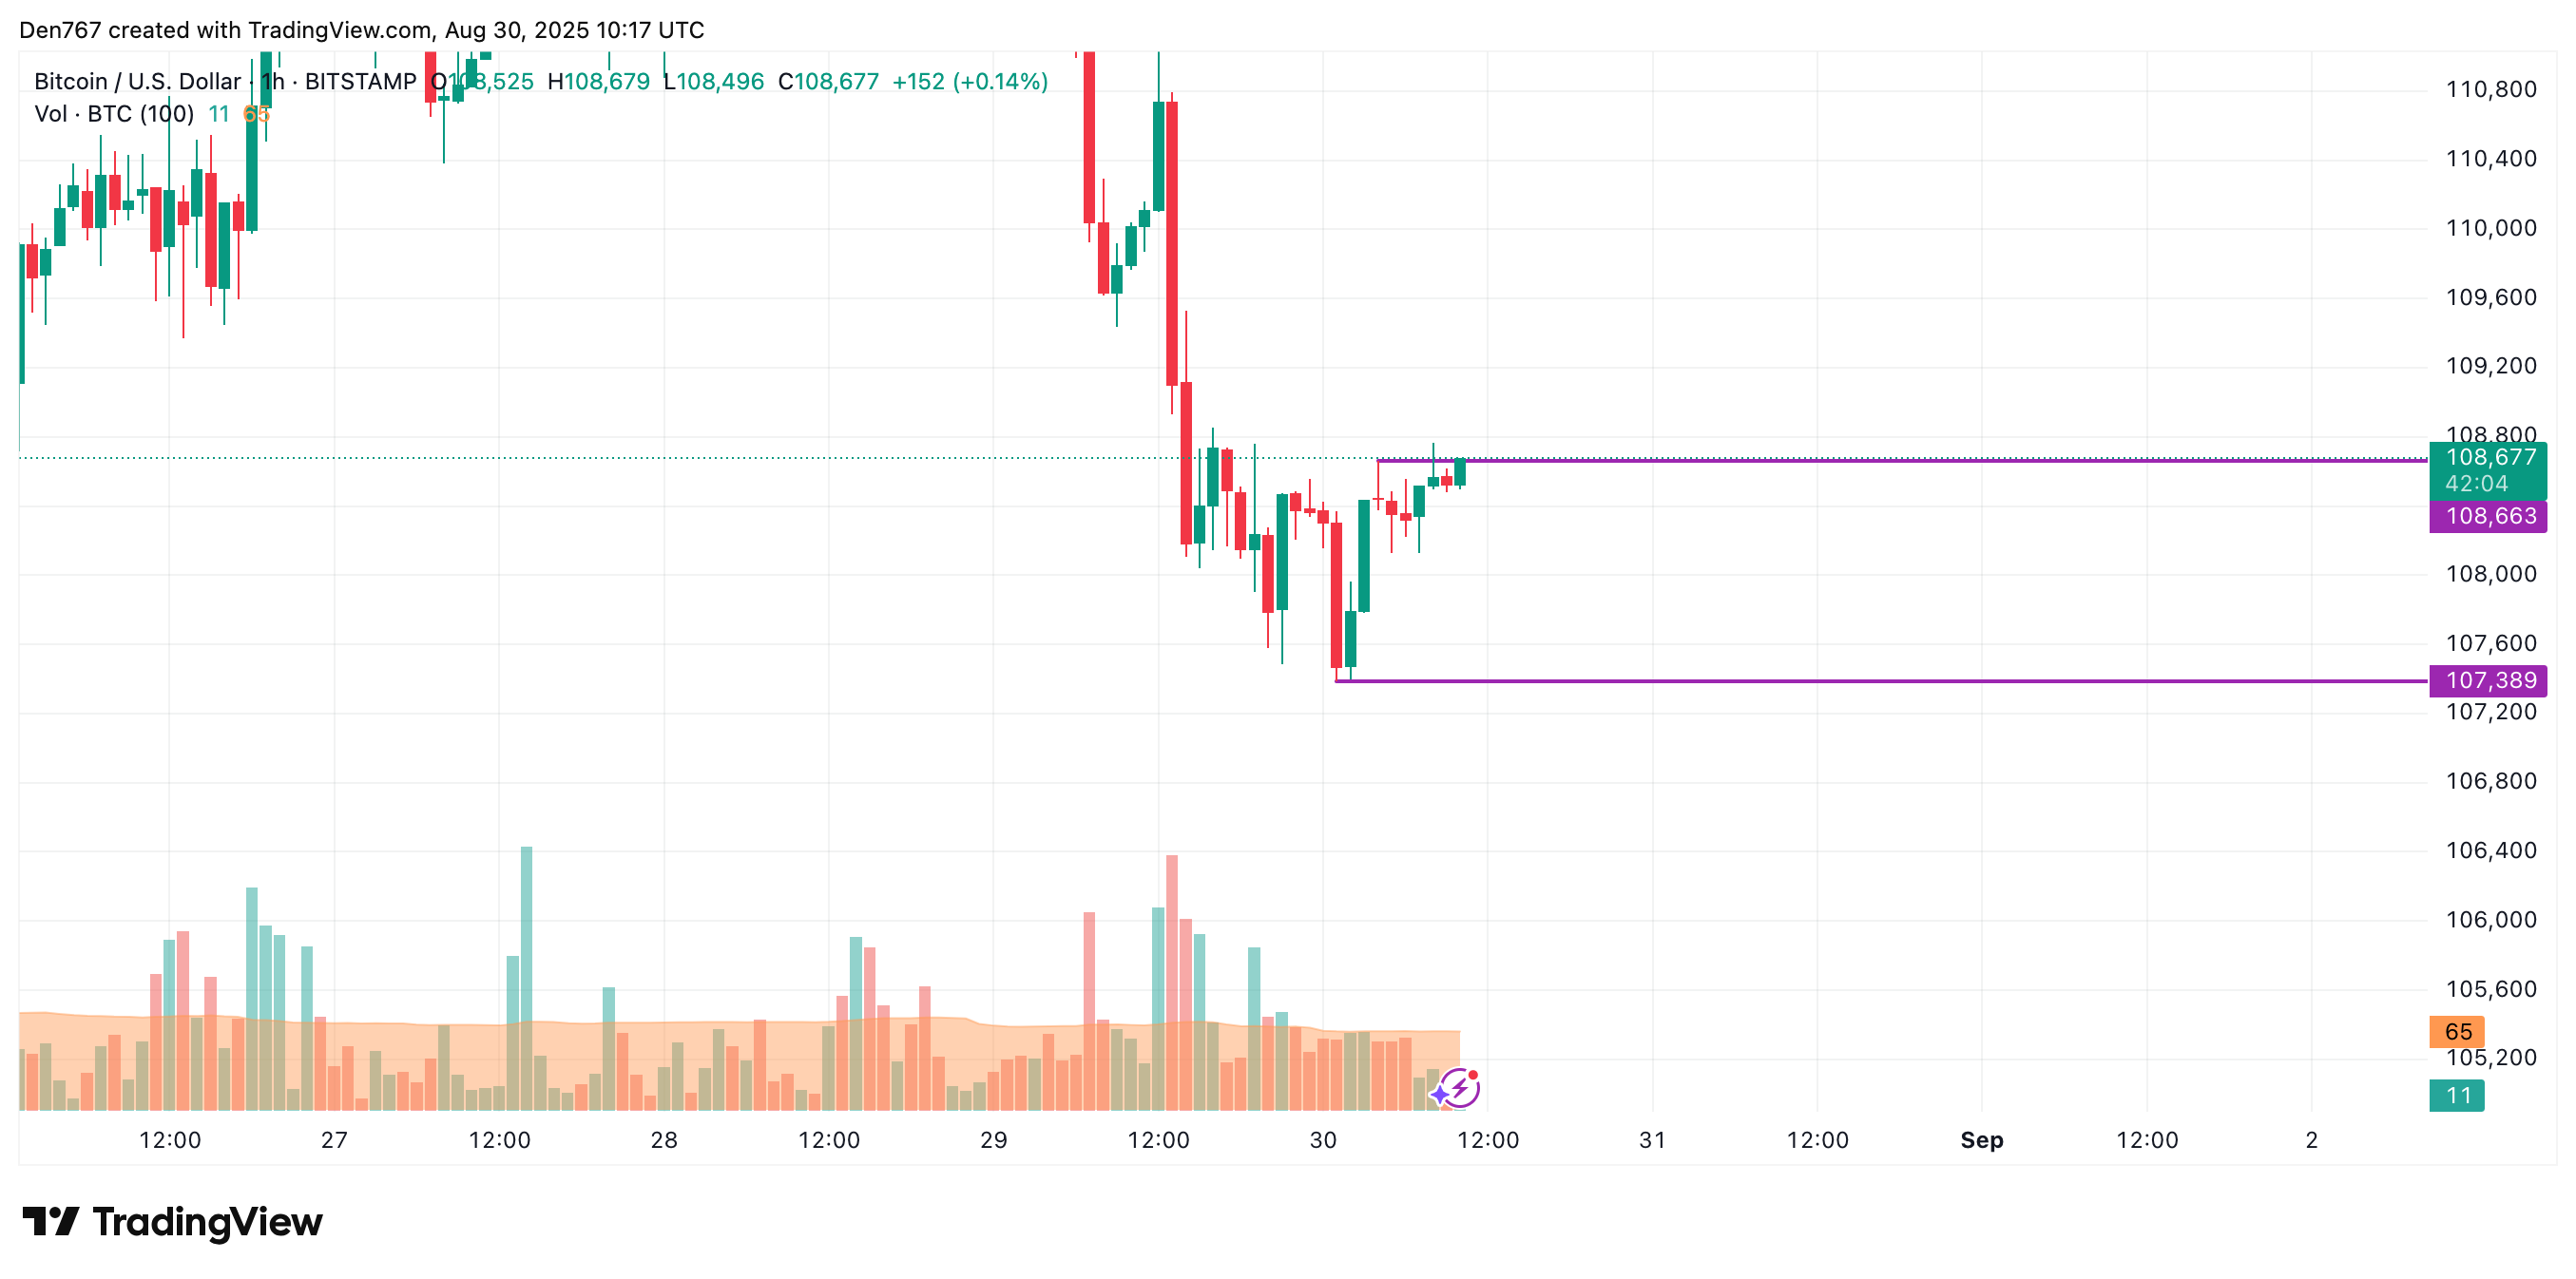
On the hourly chart, the rate of BTC is about to break the local resistance of $108,663. If that happens and the daily bar closes above that mark, the upward move is likely to continue to the $110,000 zone.
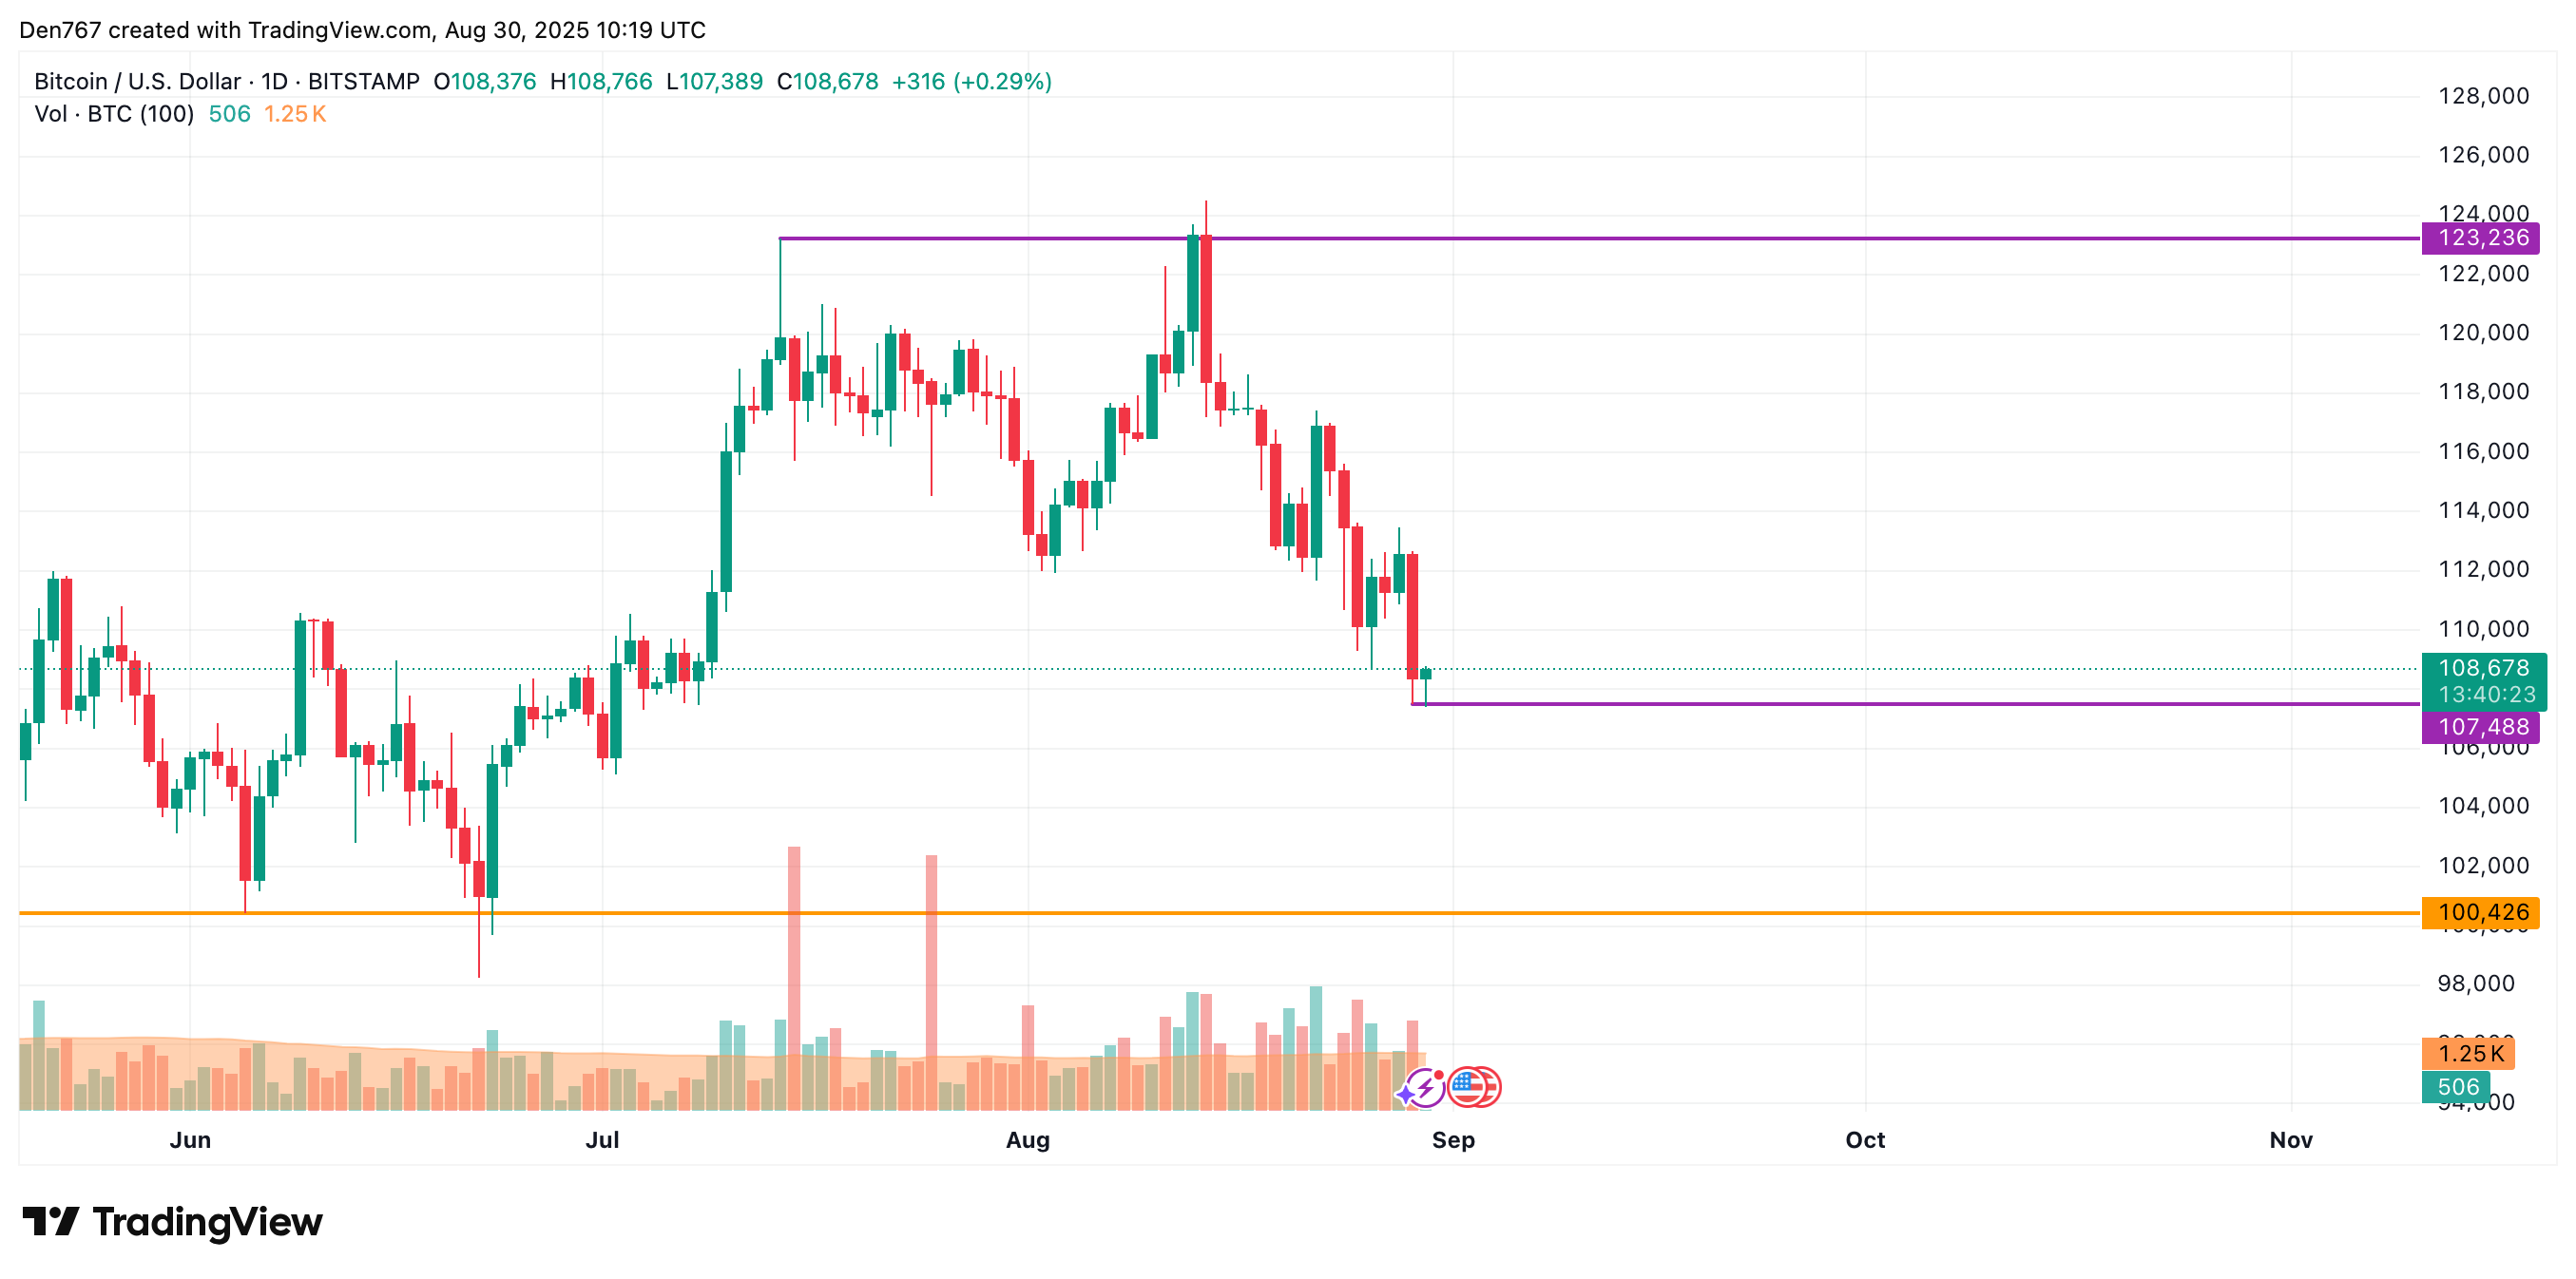
On the daily time frame, the price of the main crypto has made a false breakout of yesterday’s bar low. Even if today’s candle closes far from that mark, buyers might need more time to accumulate energy for a further move.
In this case, sideways trading in the range of $108,000-$111,000 is the more likely scenario.
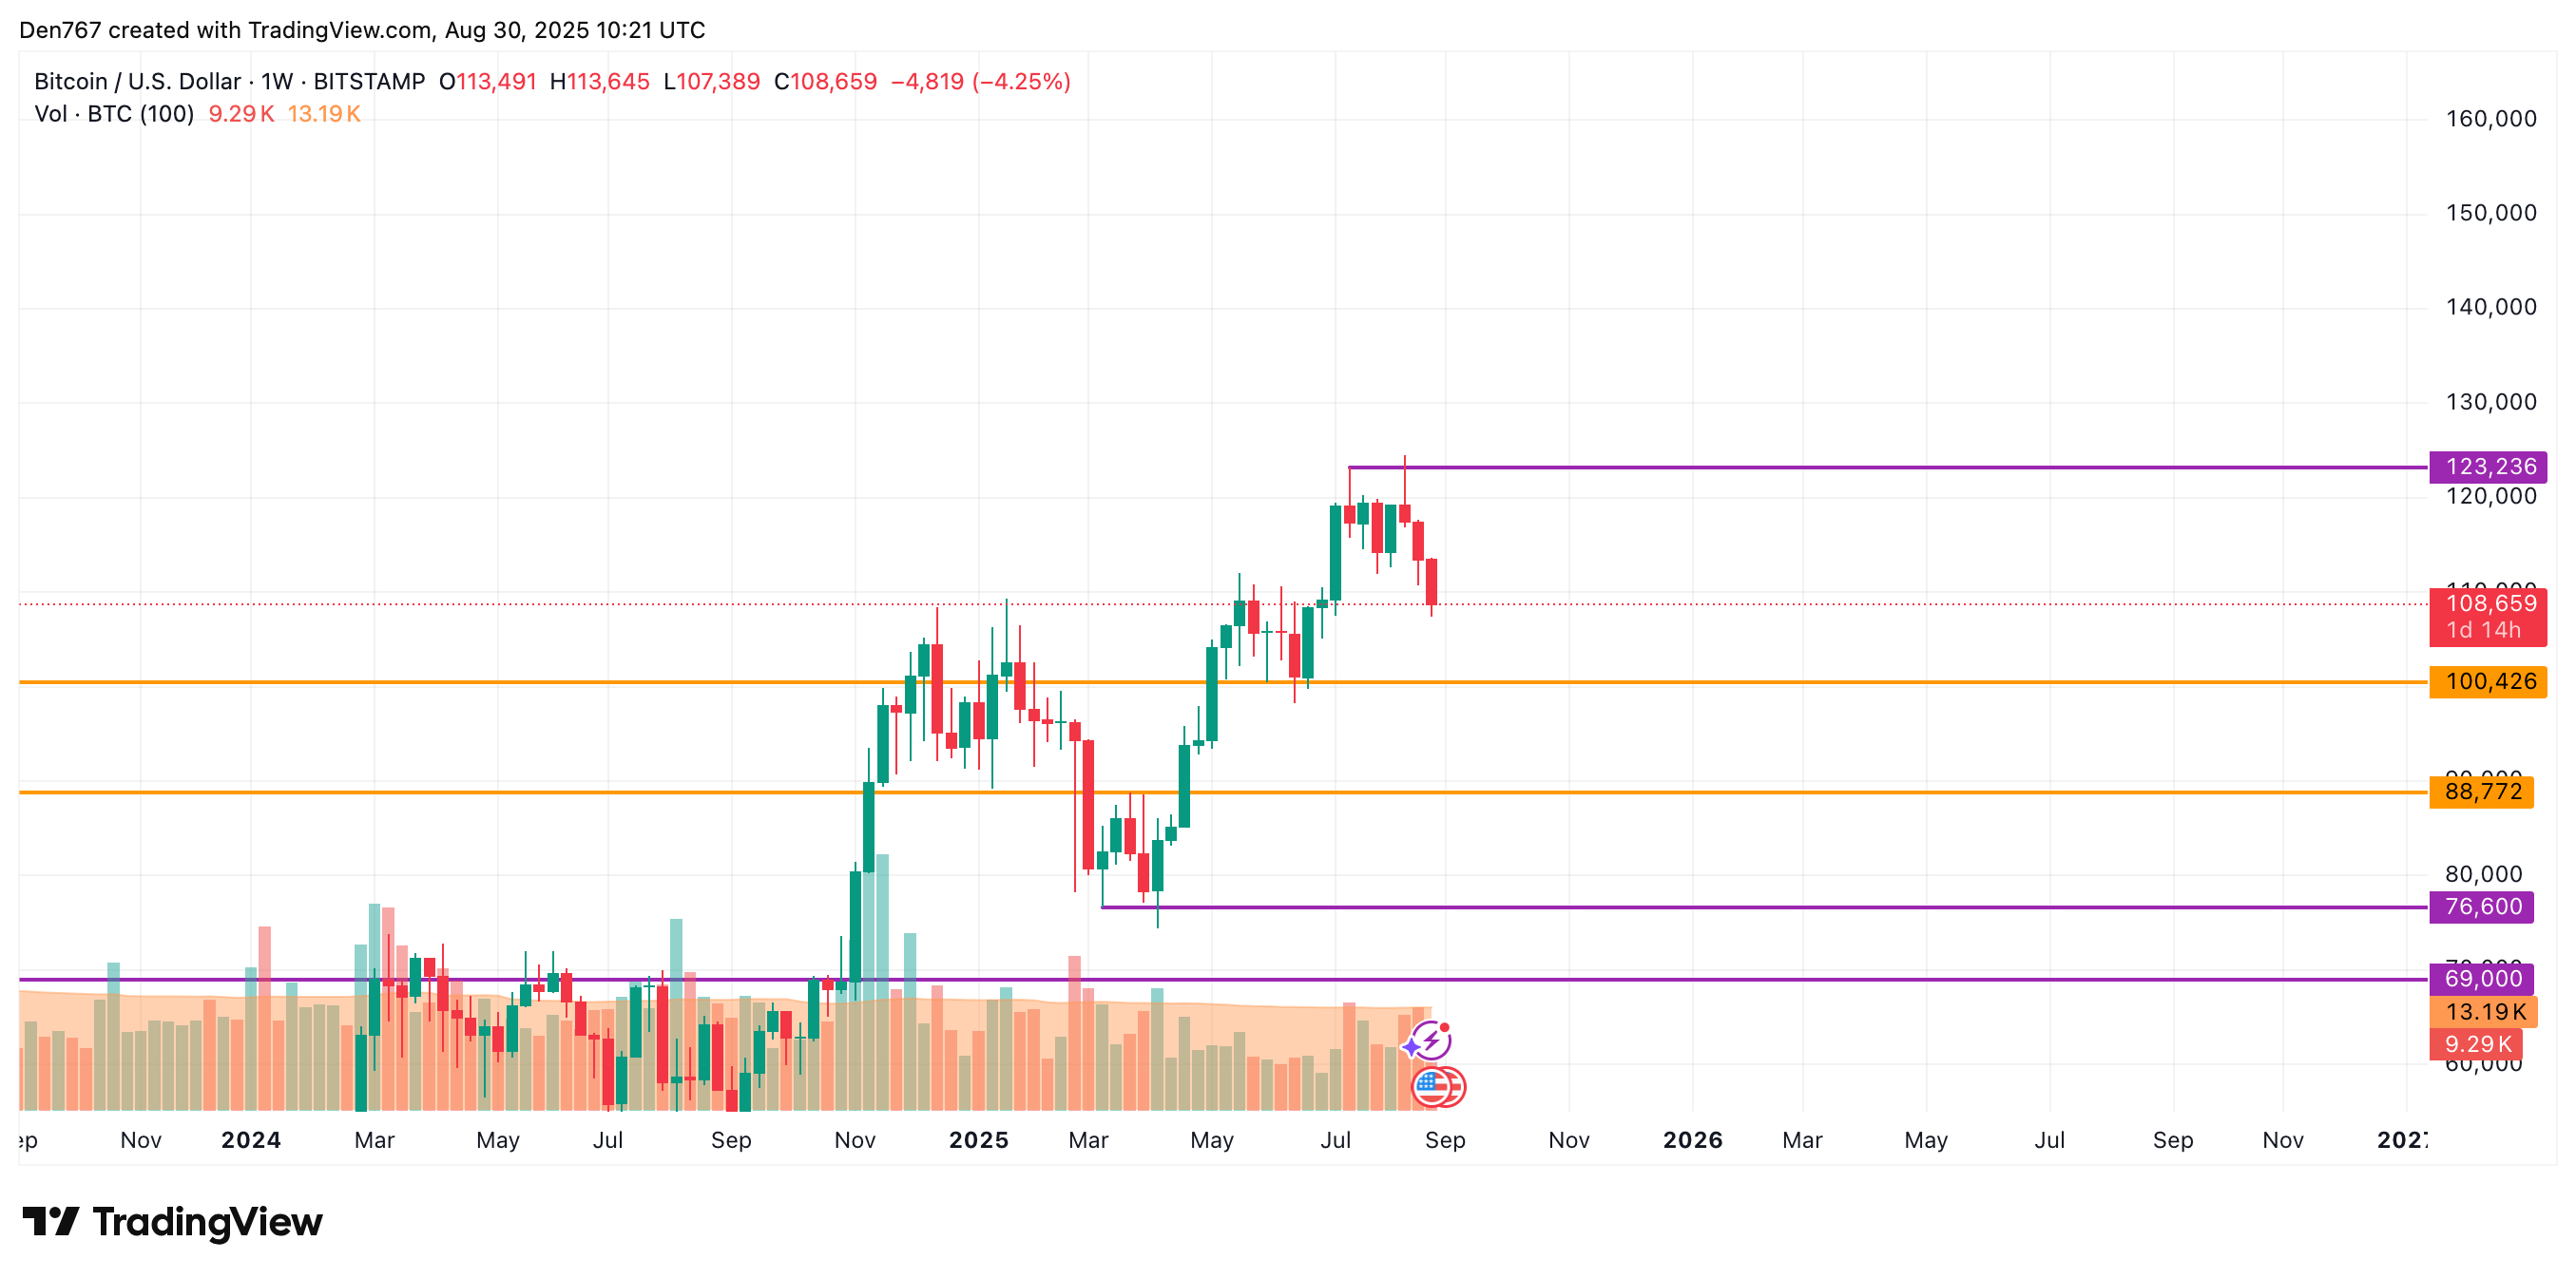
From the midterm point of view, the rate of BTC is falling after the previous bullish bar closure. As there are no reversal signals yet, traders may see a test of the support level soon.
Bitcoin is trading at $108,659 at press time.