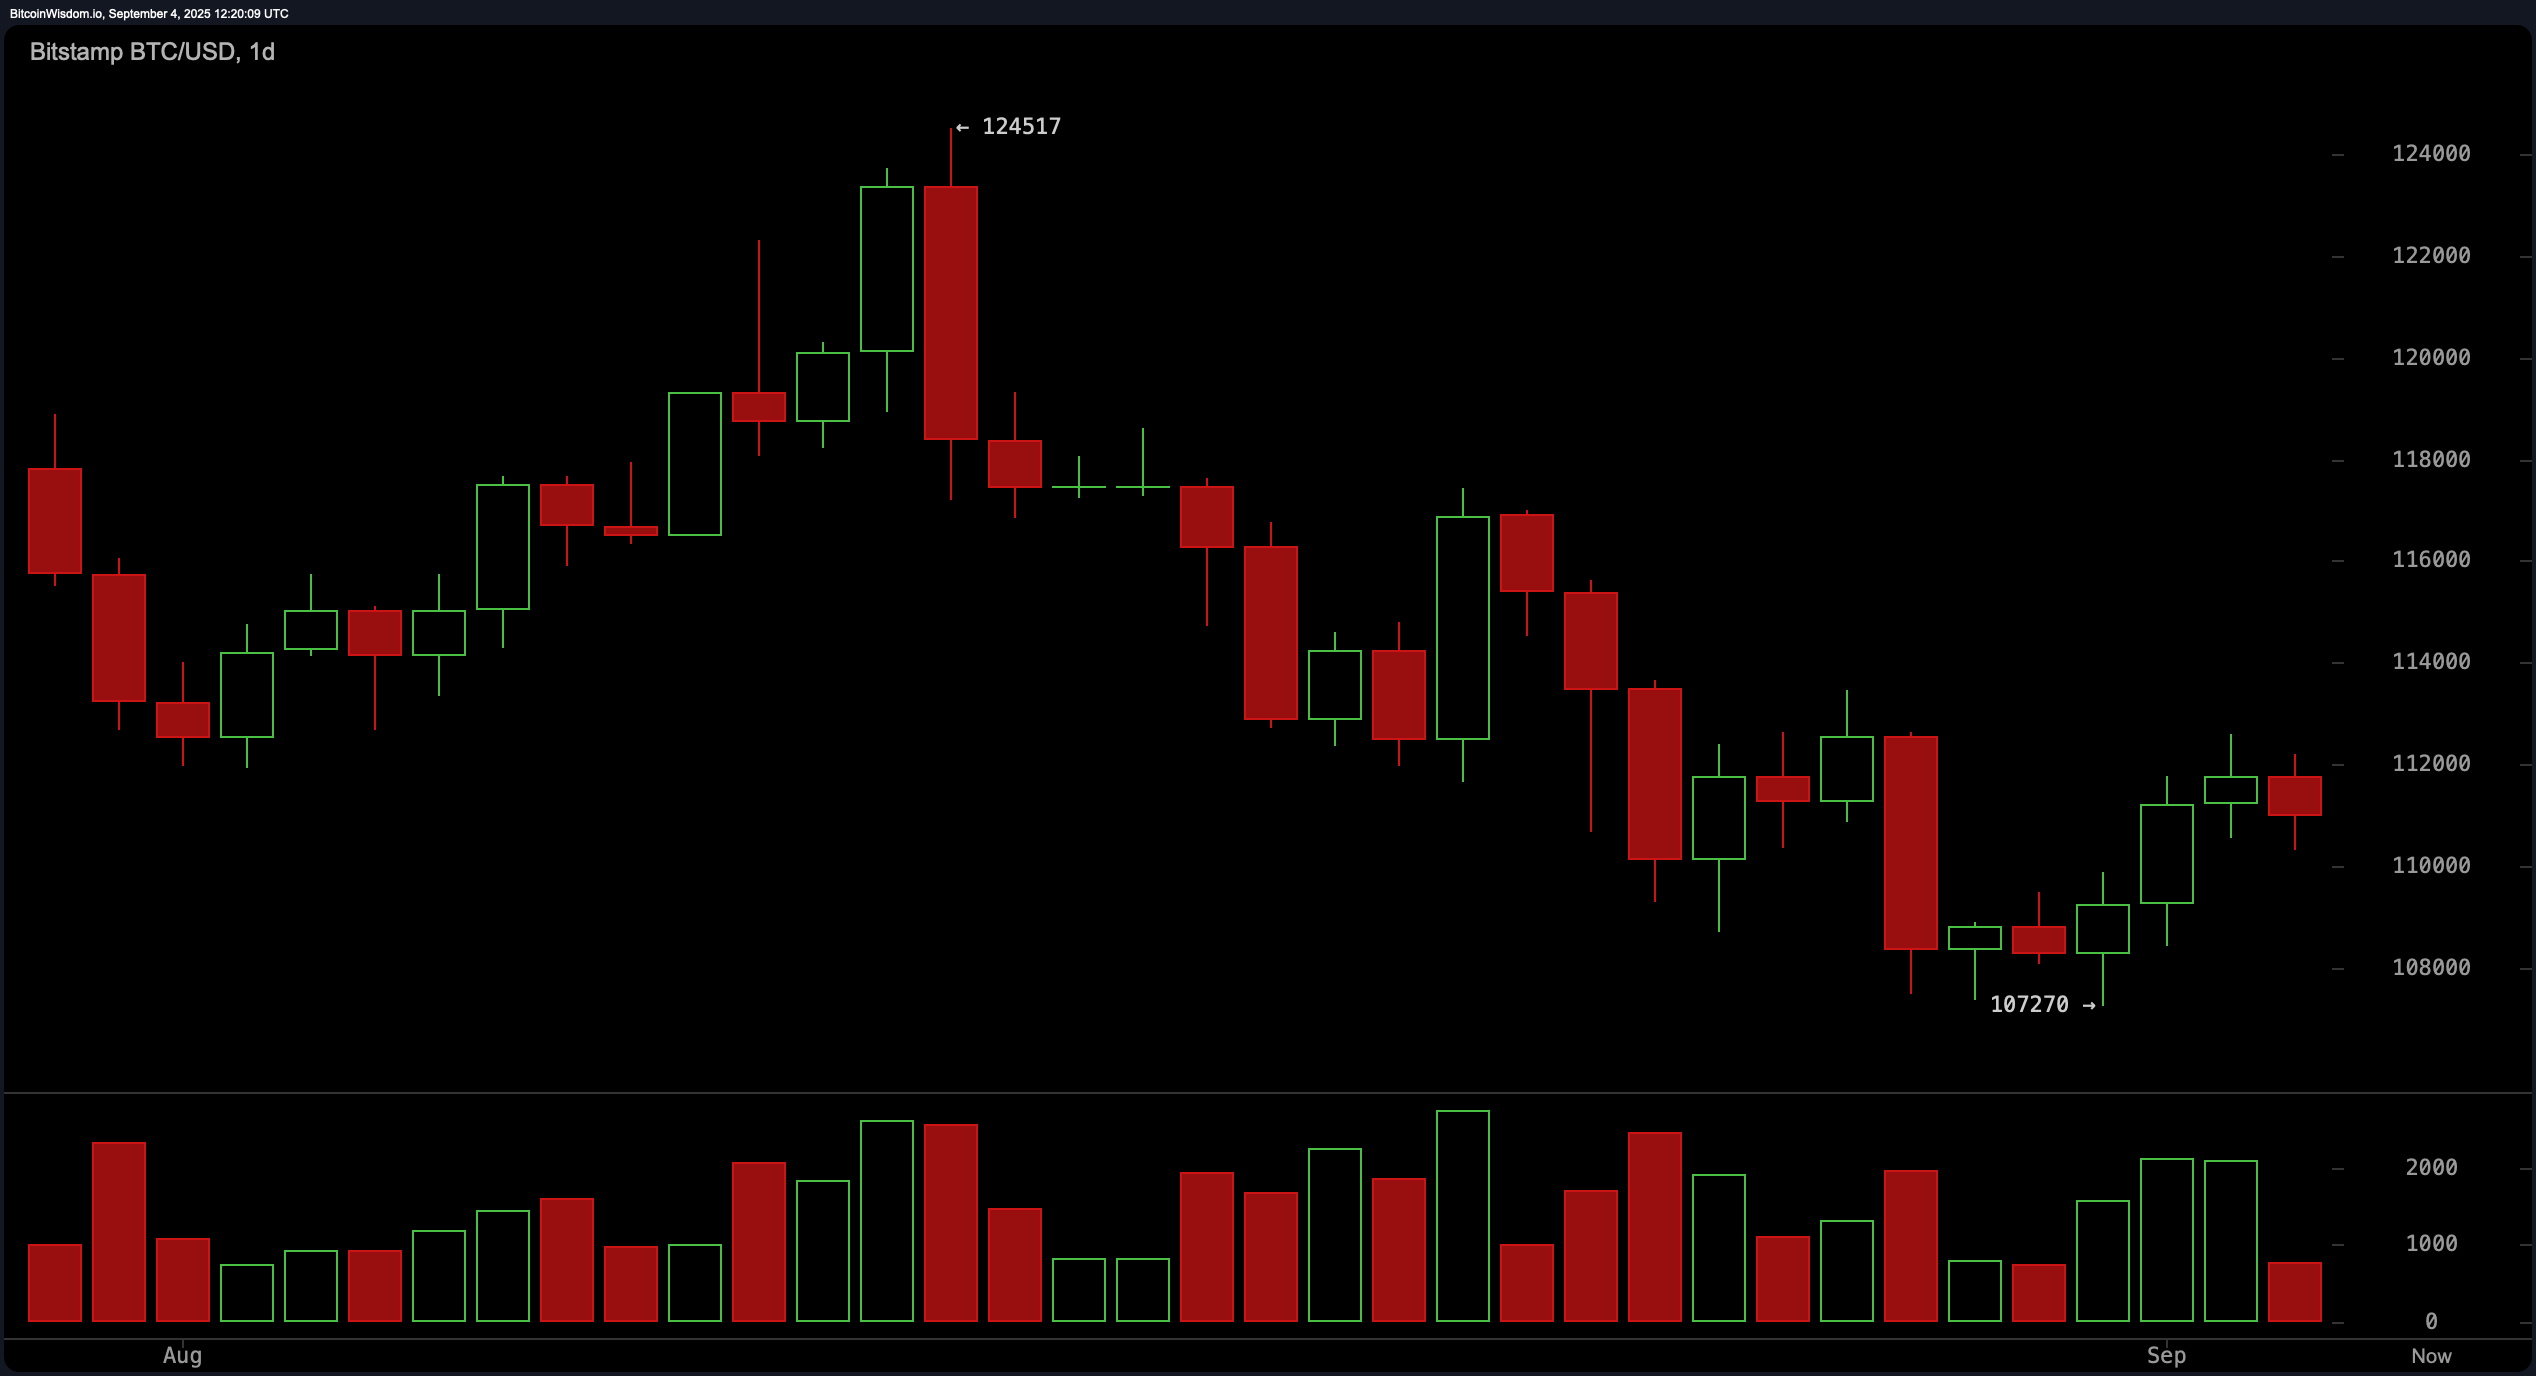
Bitcoin is currently priced at $110,700 to $111,010 over the last hour, with a total market capitalization of $2.20 trillion. Over the last 24 hours, bitcoin recorded a trading volume of $36.27 billion, fluctuating within an intraday range of $110,344 to $112,502.
Bitcoin
On the daily chart, bitcoin appears to be entering a consolidation phase following a short-term bottom at $107,270. Price action is forming a series of higher lows and higher closes, suggesting a possible short-term reversal or relief rally. The exponential moving average (EMA) for the 10-day period stands at $111,037, while the simple moving average (SMA) for the 10-day period is at $110,442, both signaling optimism. However, bearish pressure remains above the 20-, 30-, and 50-period moving averages (MAs), indicating resistance in the $112,000 to $115,000 range. The relative strength index (RSI) at 45, the Stochastic at 40, and the commodity channel index (CCI) at −38 all indicate neutral momentum on the daily timeframe, aligning with the broader market indecision.
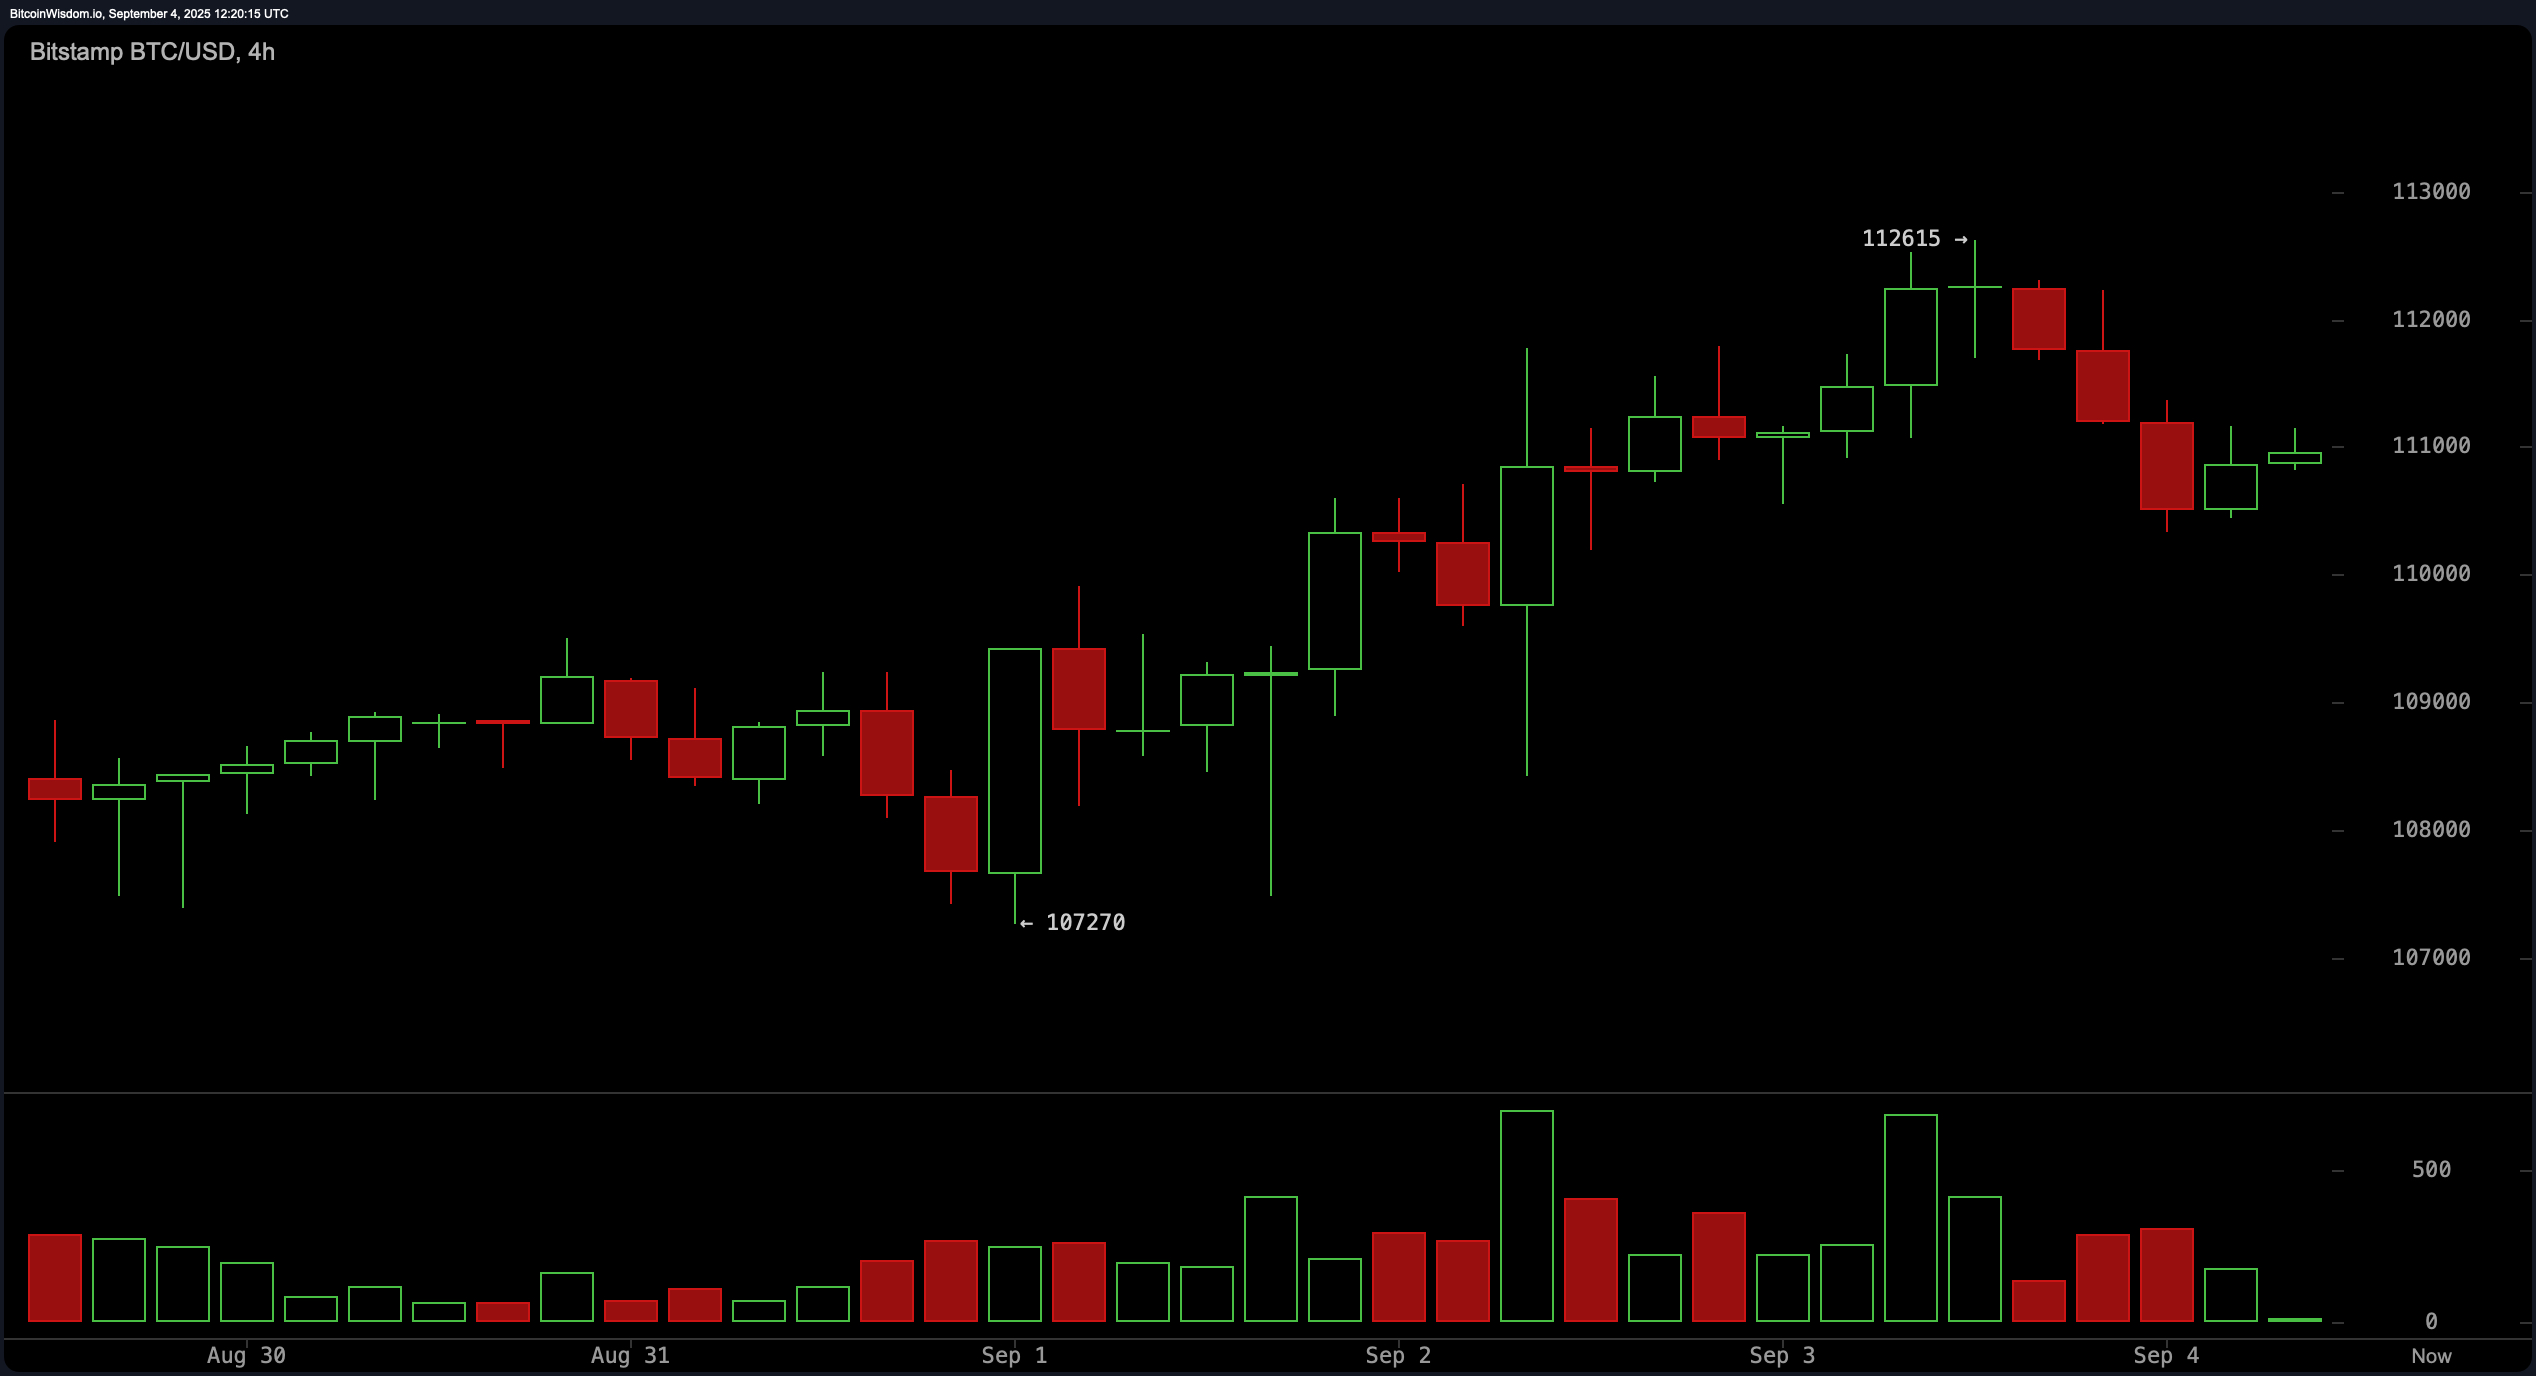
The 4-hour bitcoin chart offers a more bullish tone. After bouncing off the $107,270 support level, bitcoin staged a V-shaped recovery, peaking near $112,615. Although the price has since pulled back slightly, it continues to hold above $110,800, underpinned by a rise in volume during the earlier leg upward. This setup suggests bullish consolidation with potential for another push higher. Some oscillators, like the momentum, remain positive with a value of 970, indicating a bullish trajectory, while the moving average convergence divergence (MACD) shows a bearish cross at −1,547, signaling mixed short-term sentiment.
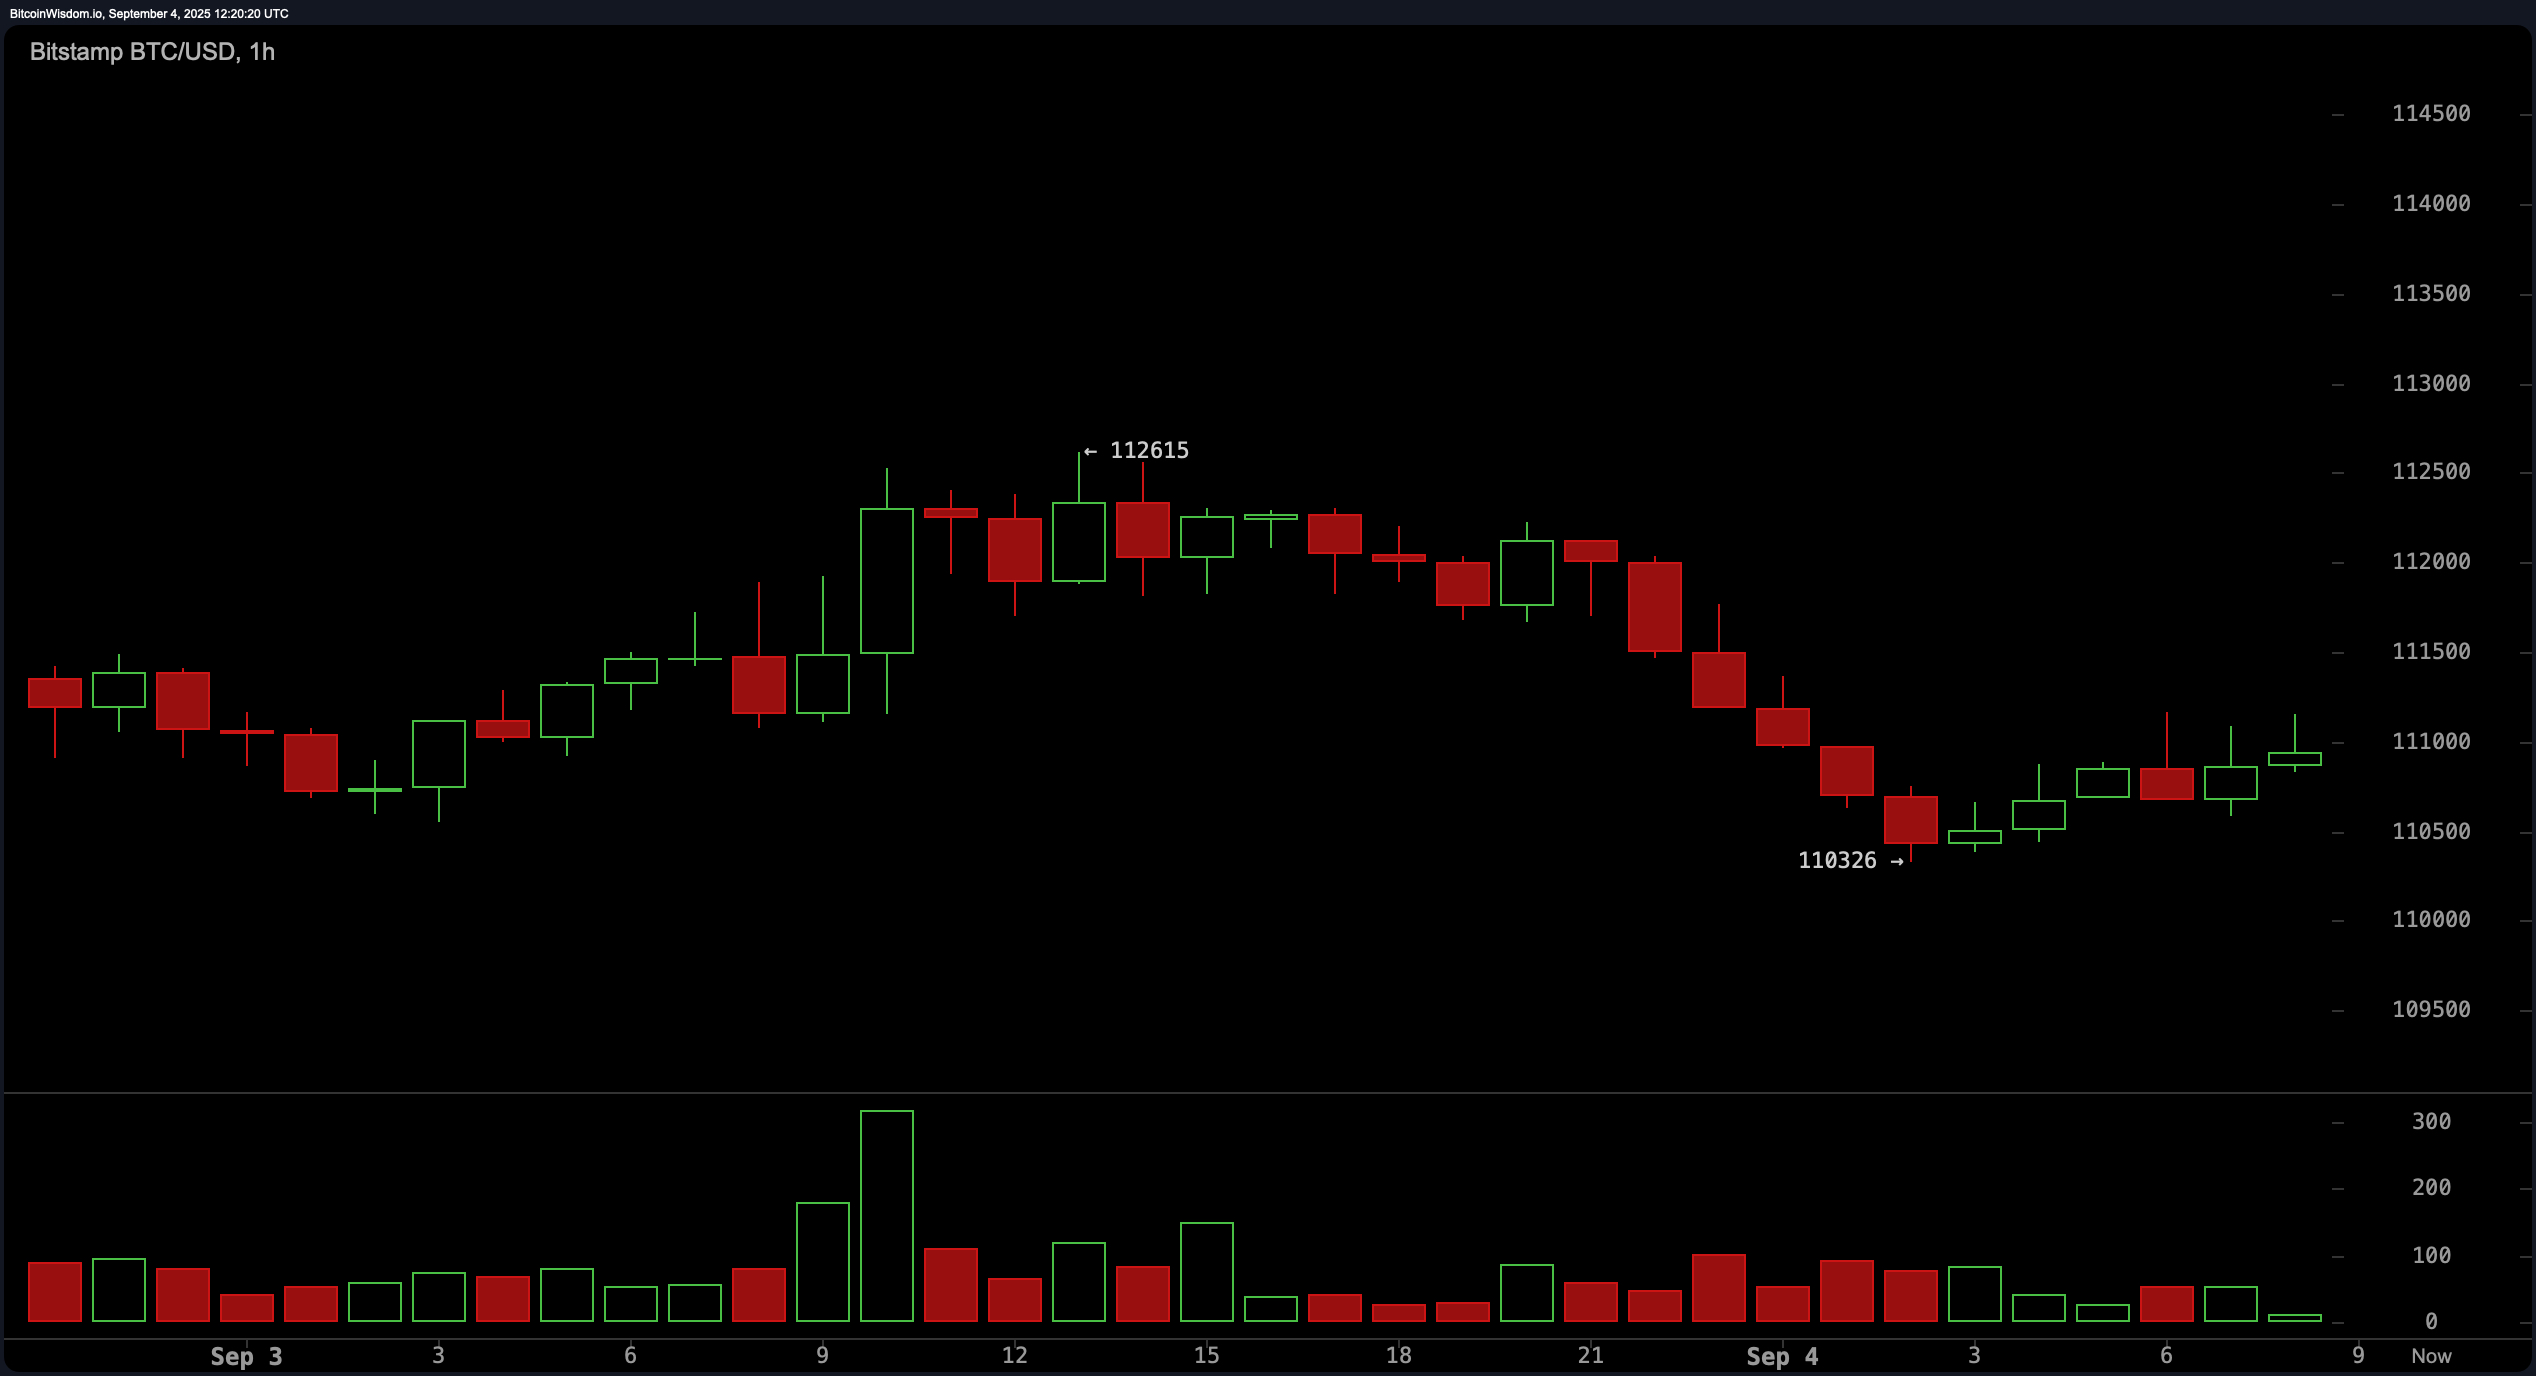
On the 1-hour chart, bitcoin is making higher lows after its decline from $112,615, pointing to a stabilization phase. Buyers appear to be stepping in around the $110,300 to $110,800 zone, supported by declining red volume candles and stronger green volume during attempted breakouts. This suggests weakening selling pressure and possible bullish accumulation. Traders may look for scalping opportunities above $111,200 with tight stop-losses below $110,300. A confirmed hourly close above $112,000 could set the stage for a retest of recent highs.
The oscillator readings across all timeframes provide a cautious outlook. With the RSI, stochastic, CCI, average directional index (ADX), and awesome oscillator all sitting in neutral zones, there is no clear momentum dominance. Notably, the MACD remains in bearish territory while momentum signals a bullish trend, indicating a divergence that traders should monitor closely. The mixed signals reflect a market in transition, awaiting a catalyst to define direction.
In summary, the combined multi-timeframe technical outlook leans slightly bullish, particularly on the 4-hour and 1-hour charts. A breakout above $112,500 on strong volume could drive bitcoin toward the $114,000–$115,000 range. Conversely, a break below $110,000 with significant volume would invalidate the bullish setup, potentially dragging the price back toward the $107,270 support zone.
Bull Verdict:
If bitcoin sustains support above $110,500 and breaks decisively above $112,500 with rising volume, the technical structure favors a continued rally toward the $114,000–$115,000 zone. Momentum indicators and short-term moving averages provide further validation for a bullish continuation.
Bear Verdict:
A failure to hold above $110,000, especially with an hourly close below $110,300 on increasing volume, would signal a breakdown toward $109,000 and potentially retest the $107,270 support. Mixed oscillator signals and persistent resistance from mid-term moving averages reinforce the risk of a bearish reversal.