On Sept. 9, 2025, bitcoin is trading at $112,569 with a market capitalization of $2.24 trillion and a 24-hour trading volume of $39.50 billion. The intraday price has fluctuated between $111,200 and $113,226, suggesting a tight range amidst cautious bullish sentiment.
Bitcoin
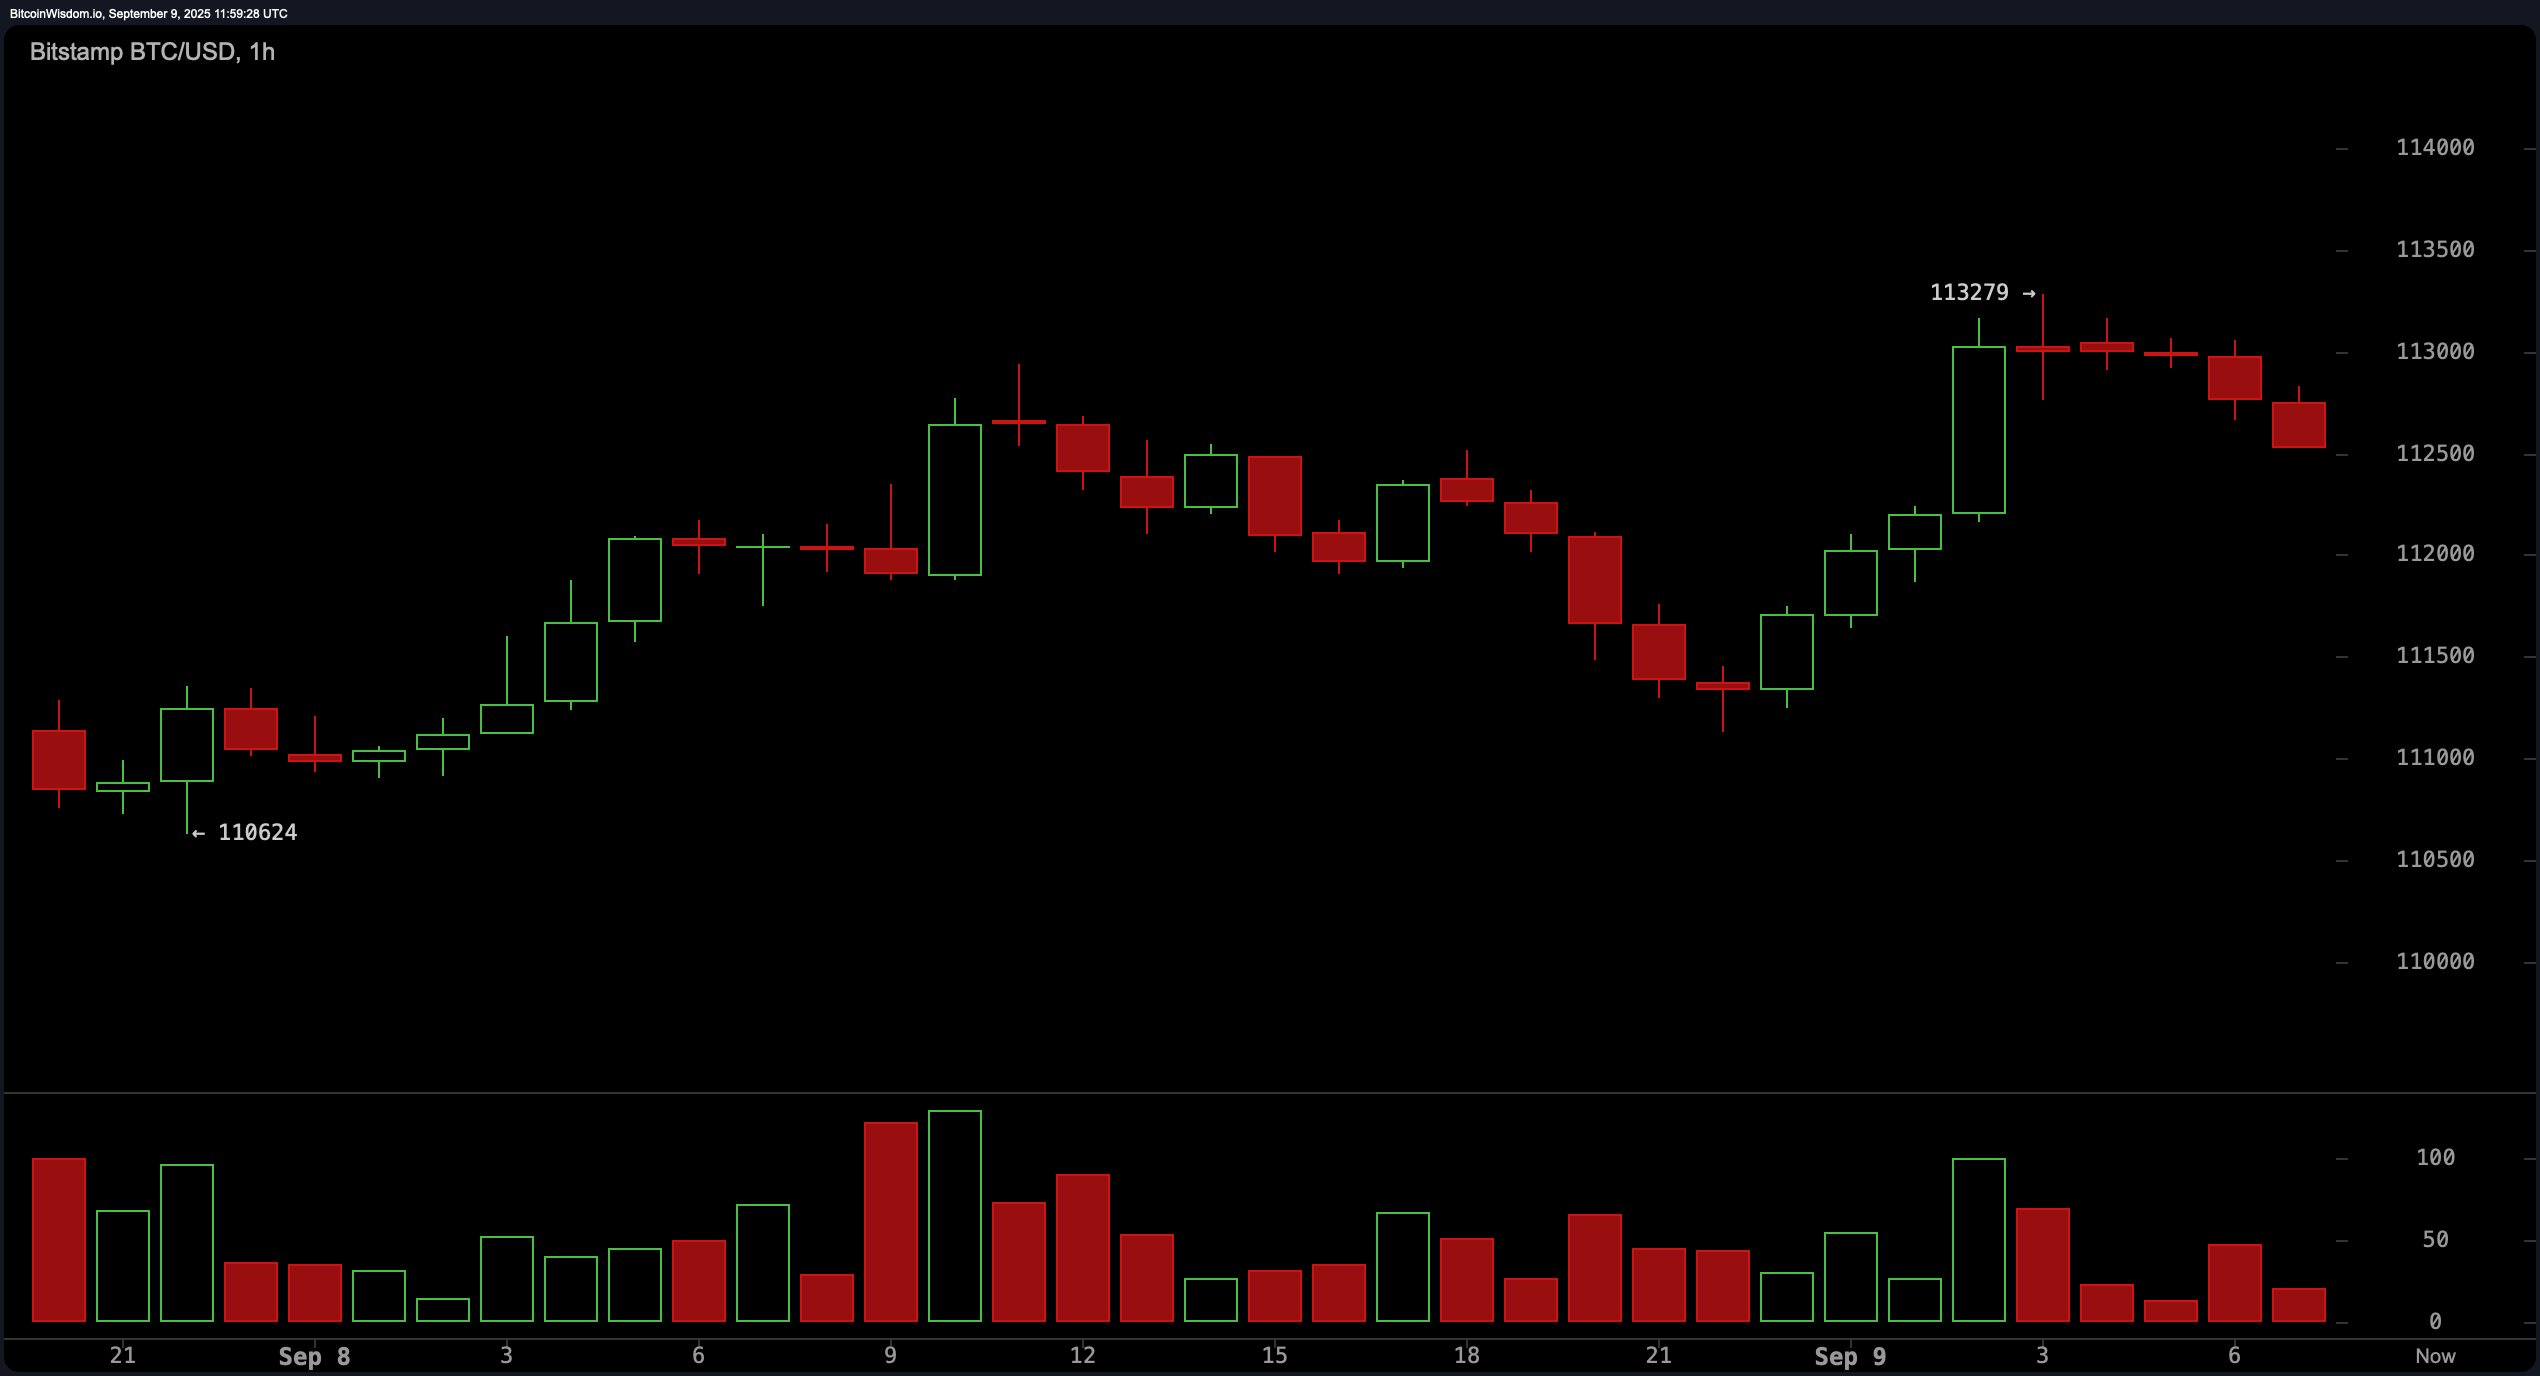
The 1-hour chart for bitcoin shows signs of short-term consolidation following a peak at $113,279. After a notable pump, weak bearish pressure has emerged, characterized by declining volume and minor retracement. Micro support has formed around $110,624, while buyers are attempting to reclaim higher levels. A rebound off the $112,000 mark or a successful retest and hold of $113,000 with volume could signal renewed upward momentum. Intraday resistance is clearly visible at $113,200 to $113,500, with $114,000 serving as a key psychological barrier for the day.
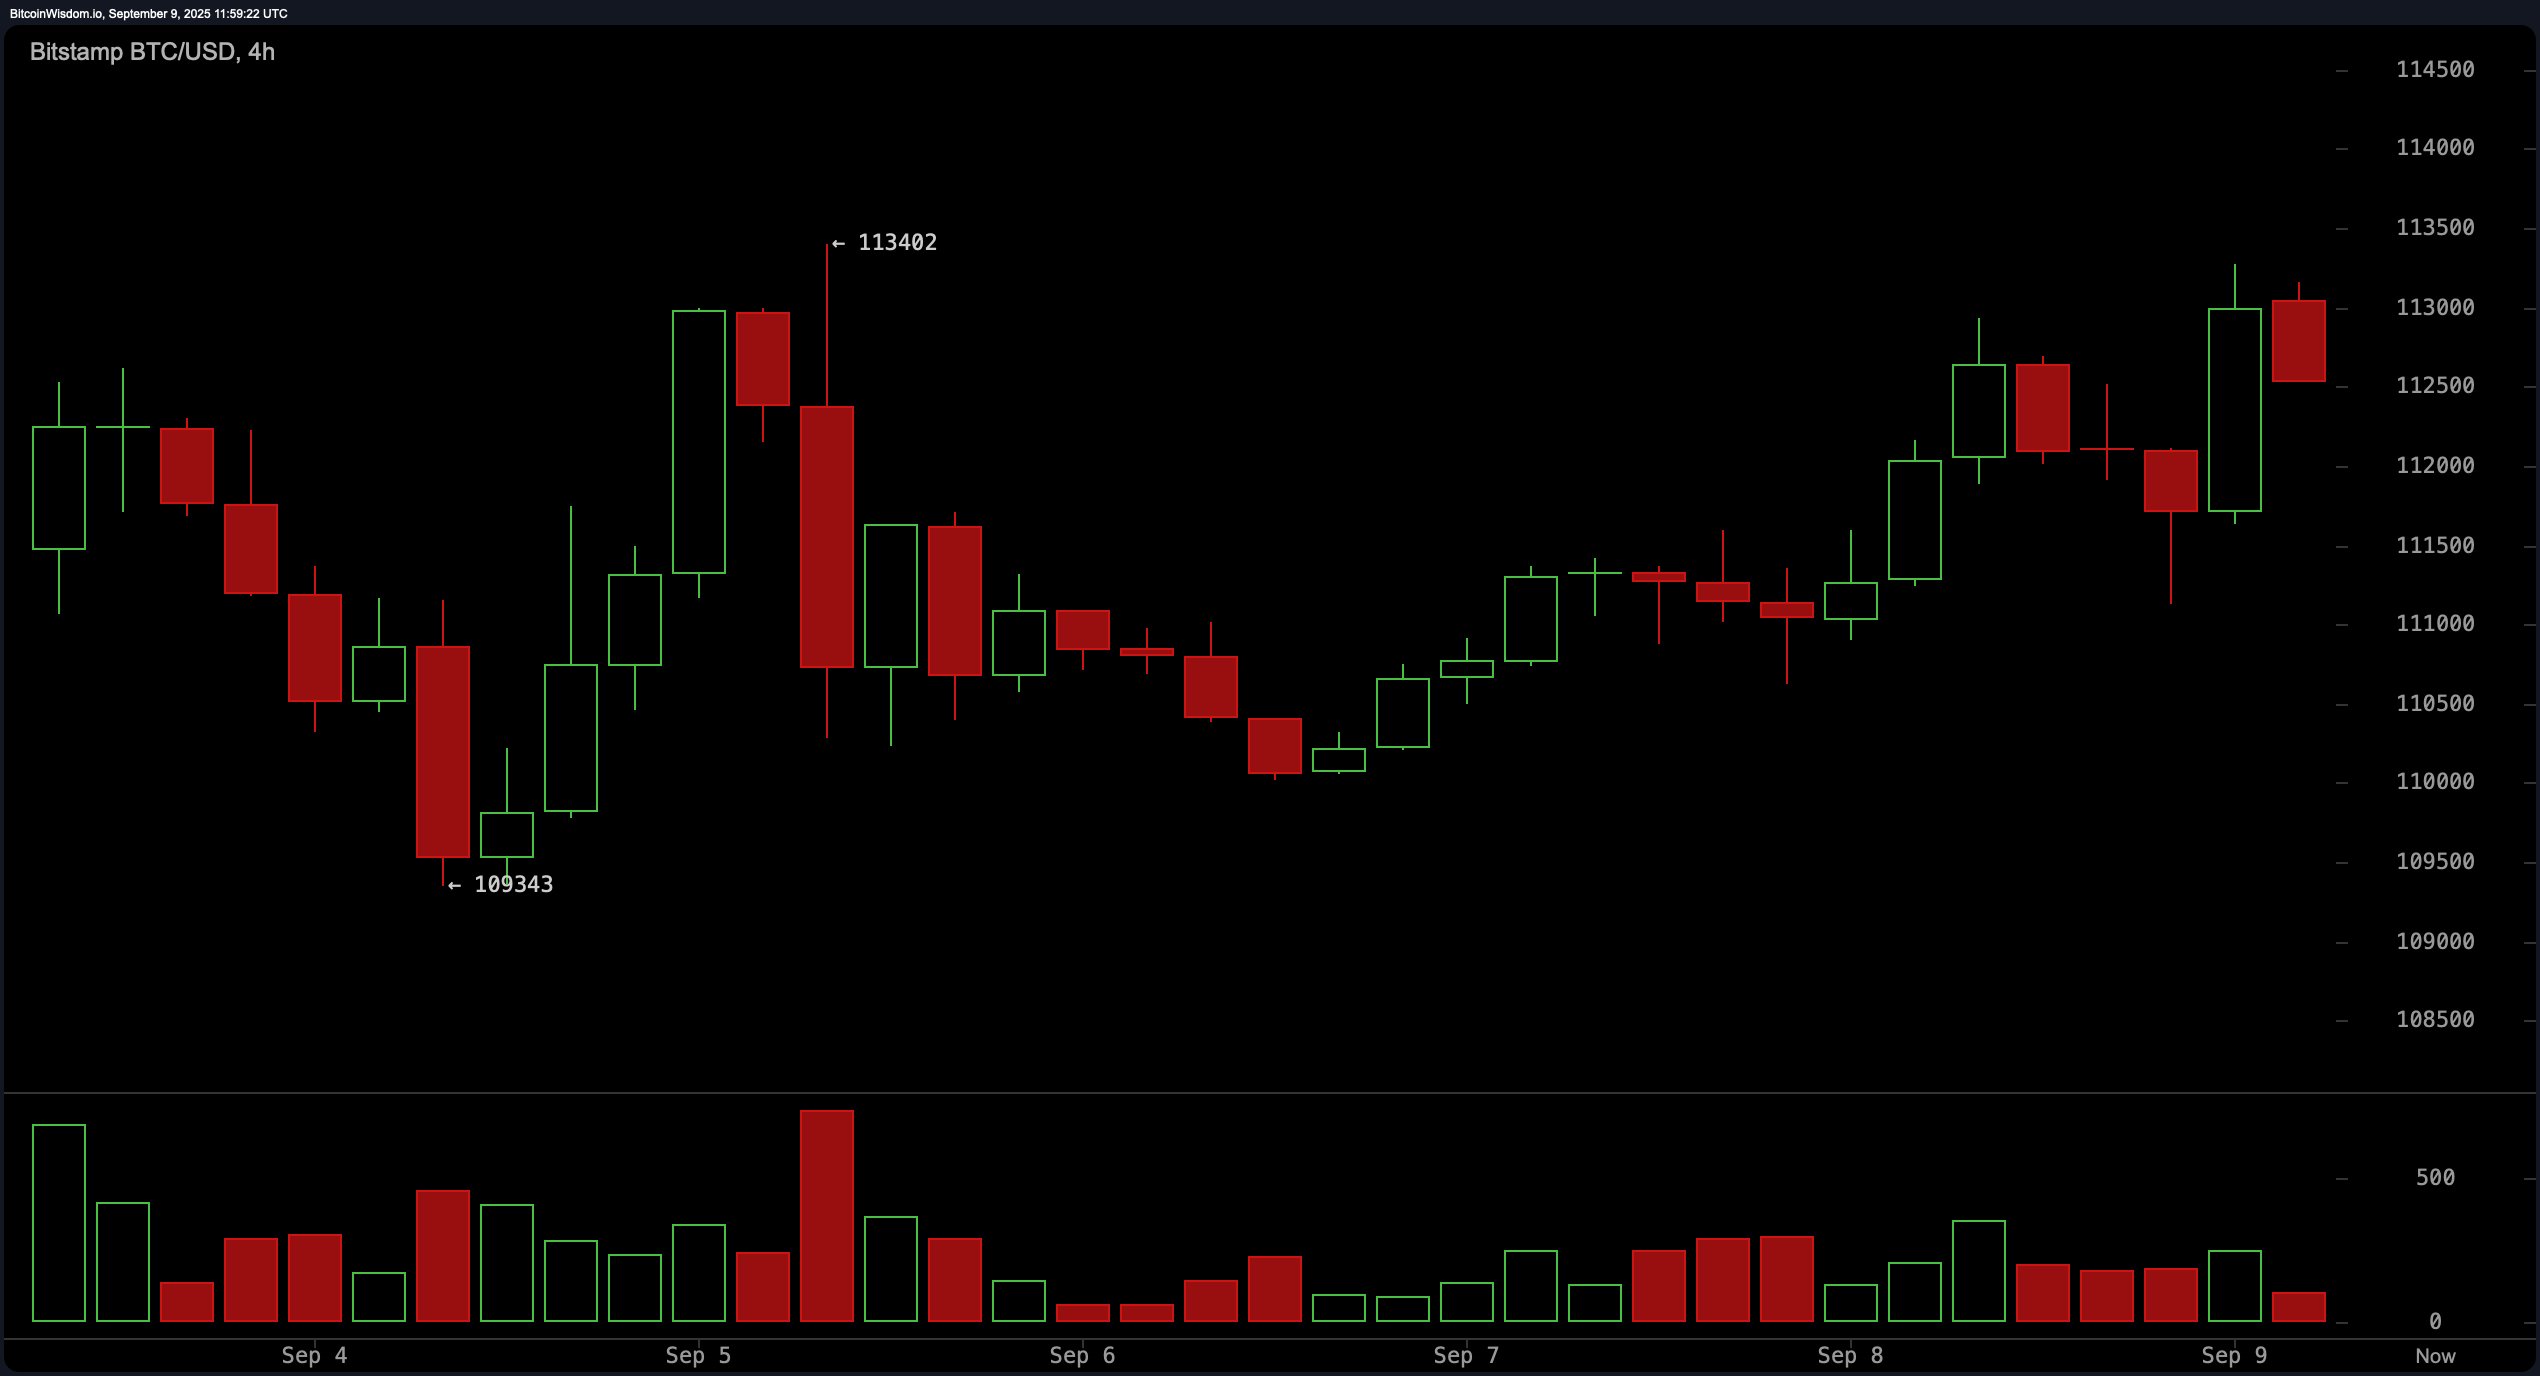
Looking at the 4-hour timeframe, bitcoin is displaying a firm higher low and higher high structure, suggesting the continuation of an uptrend. After forming a local bottom at $109,343, the price has climbed to a local high of $113,402. Notably, volume has spiked on bullish candles, adding credence to the rally. A bullish engulfing candle near $111,500 marked a favorable re-entry opportunity. Traders are advised to consider entering on pullbacks between $111,500 and $112,000, with a protective stop just below $110,000. Immediate resistance lies between $113,400 and $114,000, and a breakout beyond this level could open the path to higher gains.
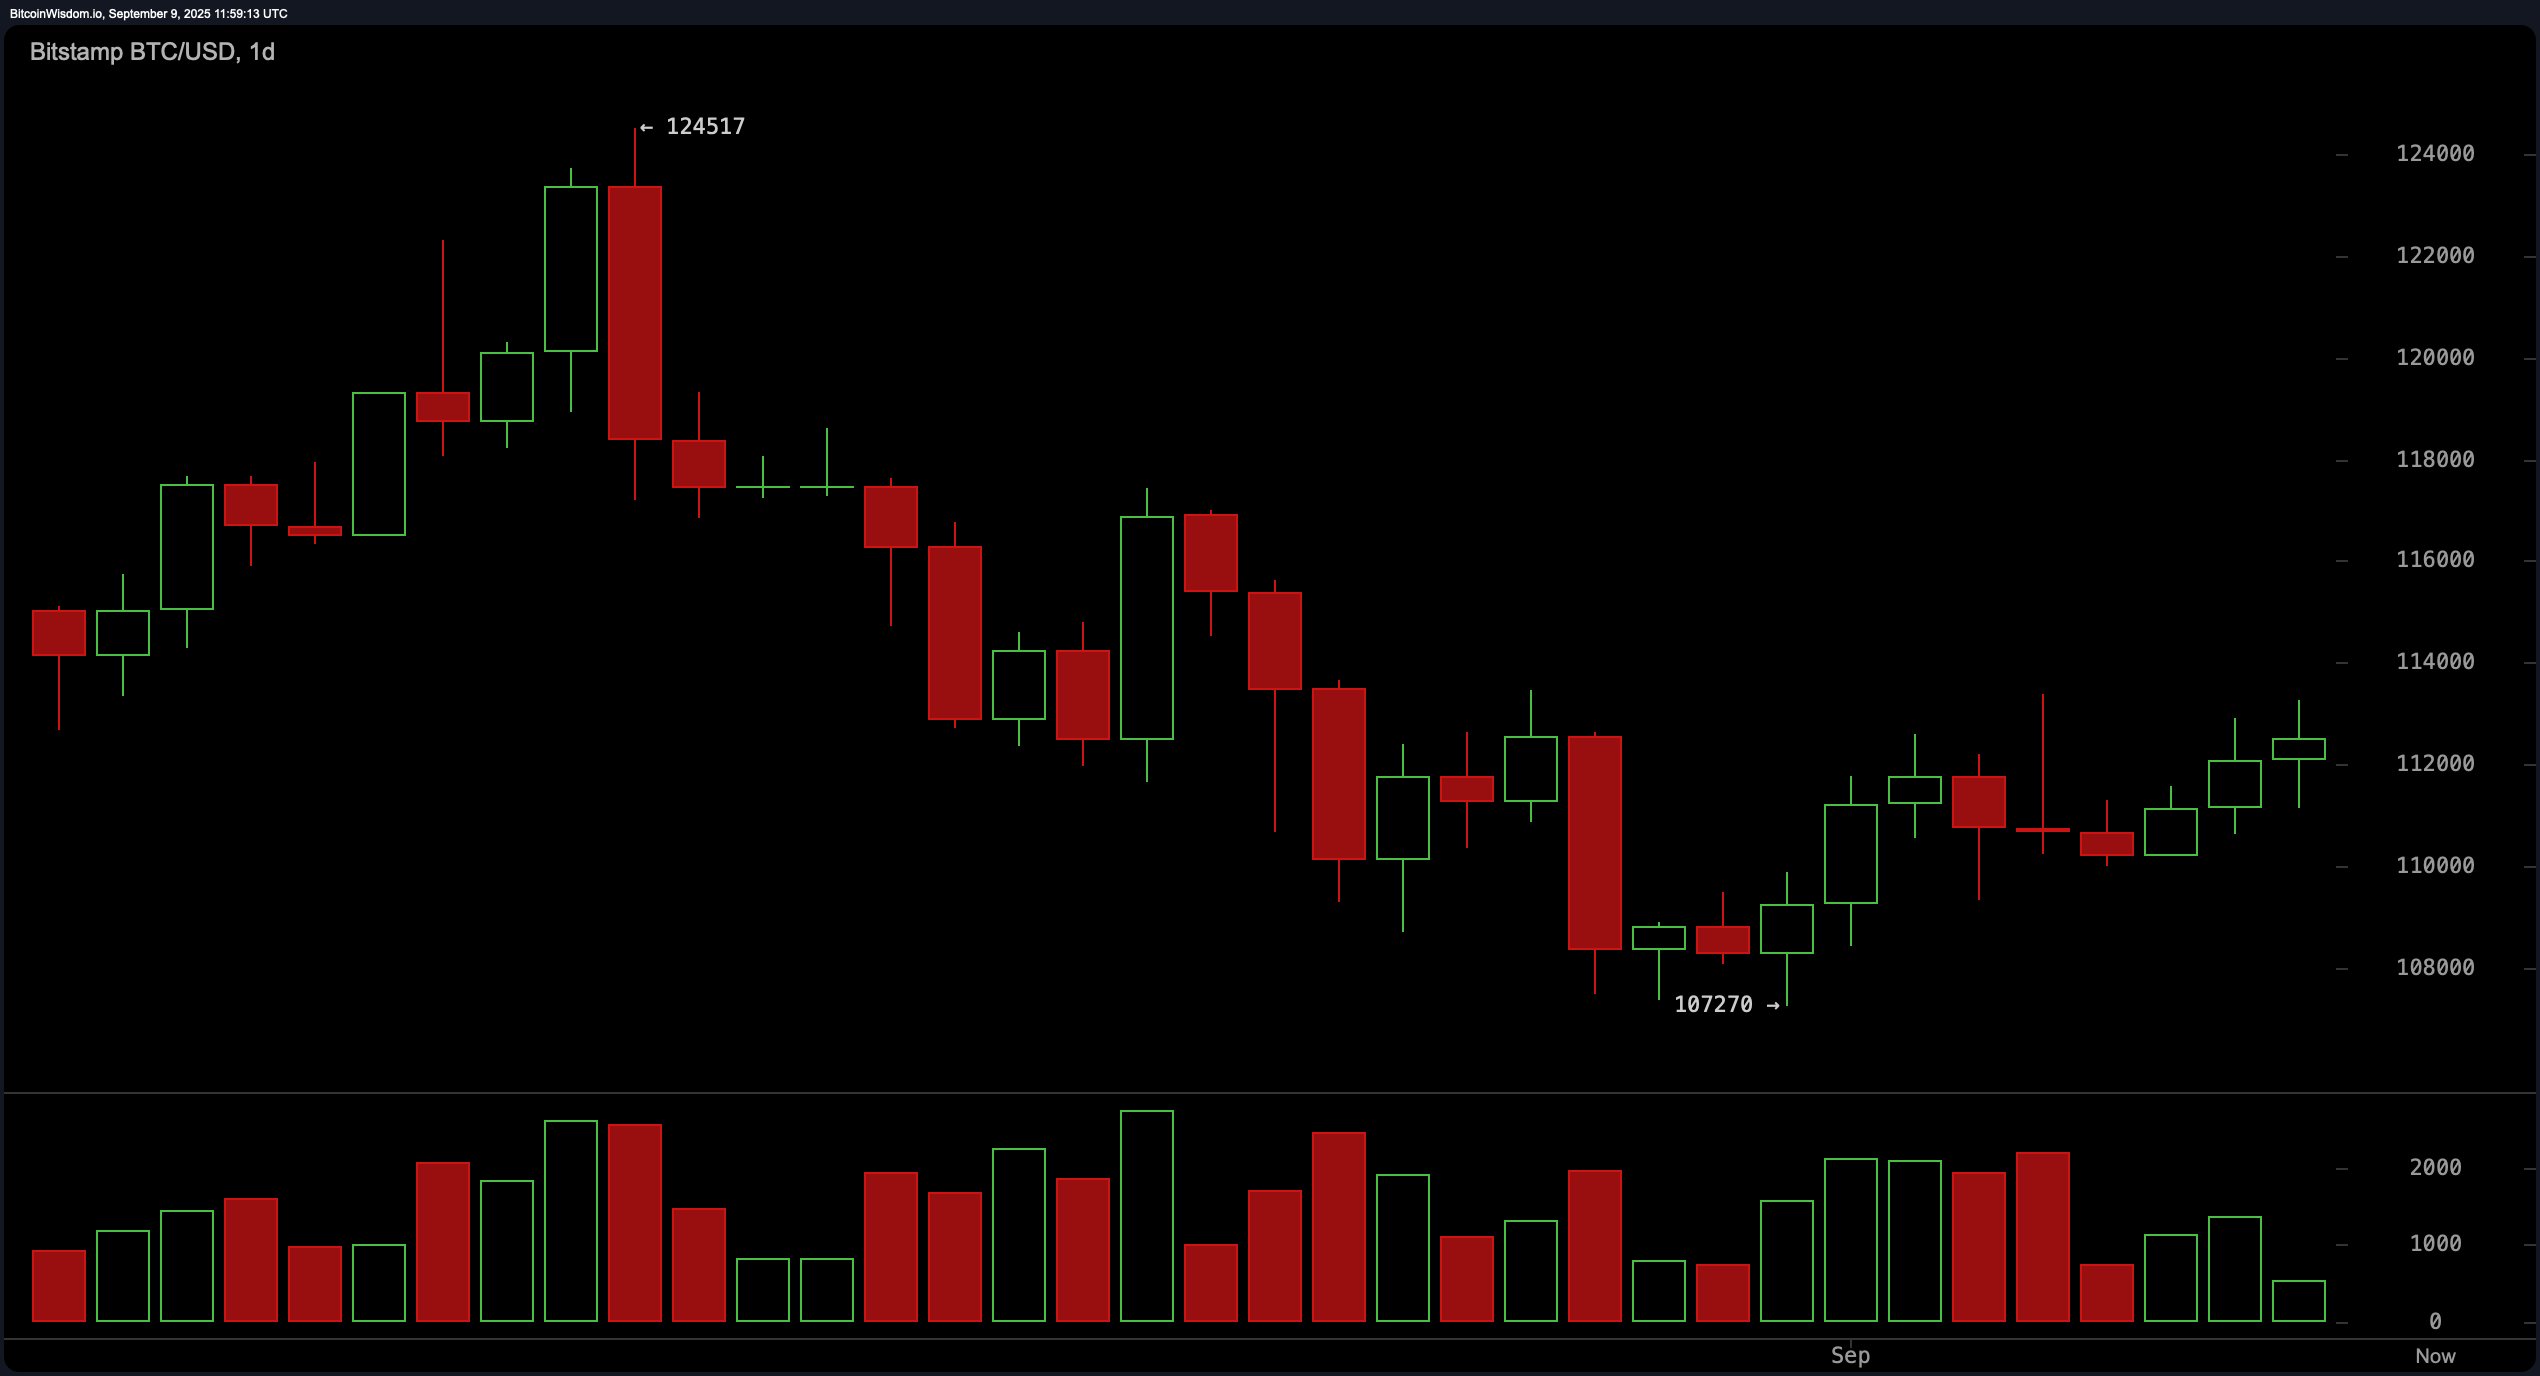
On the daily chart, bitcoin‘s price action reflects a recovery pattern following a steep decline from $124,517 to a recent bottom of $107,270. This correction was marked by high volume, indicative of liquidation events or panic-driven exits. Currently, the price structure is forming a bullish staircase pattern with consistently higher lows and highs, possibly pointing toward a double bottom formation at the $107,000 zone. While aggressive entry opportunities near $110,000 have passed, a conservative strategy would involve waiting for a daily close above $113,500. Key resistances are projected at $114,000 to $115,000, followed by a stronger zone between $120,000 and $124,000.
A breakdown of technical indicators supports a cautiously bullish stance. Oscillators are largely neutral, with the relative strength index (RSI) at 50.5, Stochastic at 74.9, commodity channel index (CCI) at 43.3, average directional index (ADX) at 14.9, and Awesome oscillator at −2,511.1. However, momentum is notably positive at 3,777.0, and the moving average convergence divergence (MACD) level stands at −961.4, both suggesting potential for continued upward movement.
Moving averages provide a mixed but generally favorable outlook. The 10-day and 20-day exponential moving averages (EMA) and simple moving averages (SMA) are all showing bullish signals, with price levels ranging from $110,799.4 to $111,941.4. The 30-day EMA remains bullish at $112,596.7, though the 30-day SMA has turned bearish at $113,518.7. Longer-term support is reinforced by the 100-day and 200-day EMAs and SMAs, all positioned well below the current price, highlighting underlying strength. Resistance is expected from the 50-day EMA and SMA, which remain above current levels at $112,950.7 and $114,831.5, respectively.
Bull Verdict:
If bitcoin decisively breaks and closes above the $113,500 threshold with accompanying volume, the prevailing uptrend is likely to accelerate. The formation of higher lows across timeframes and strong support from momentum indicators suggest further upside potential, with targets set between $114,000 and $124,000.
Bear Verdict:
Should bitcoin fail to reclaim $113,000 and sustain above it, the current rally may weaken, exposing the asset to renewed selling pressure. A break below $111,000 could invalidate the bullish structure, with downside risks extending toward $109,000 and potentially revisiting the $107,000 support zone.