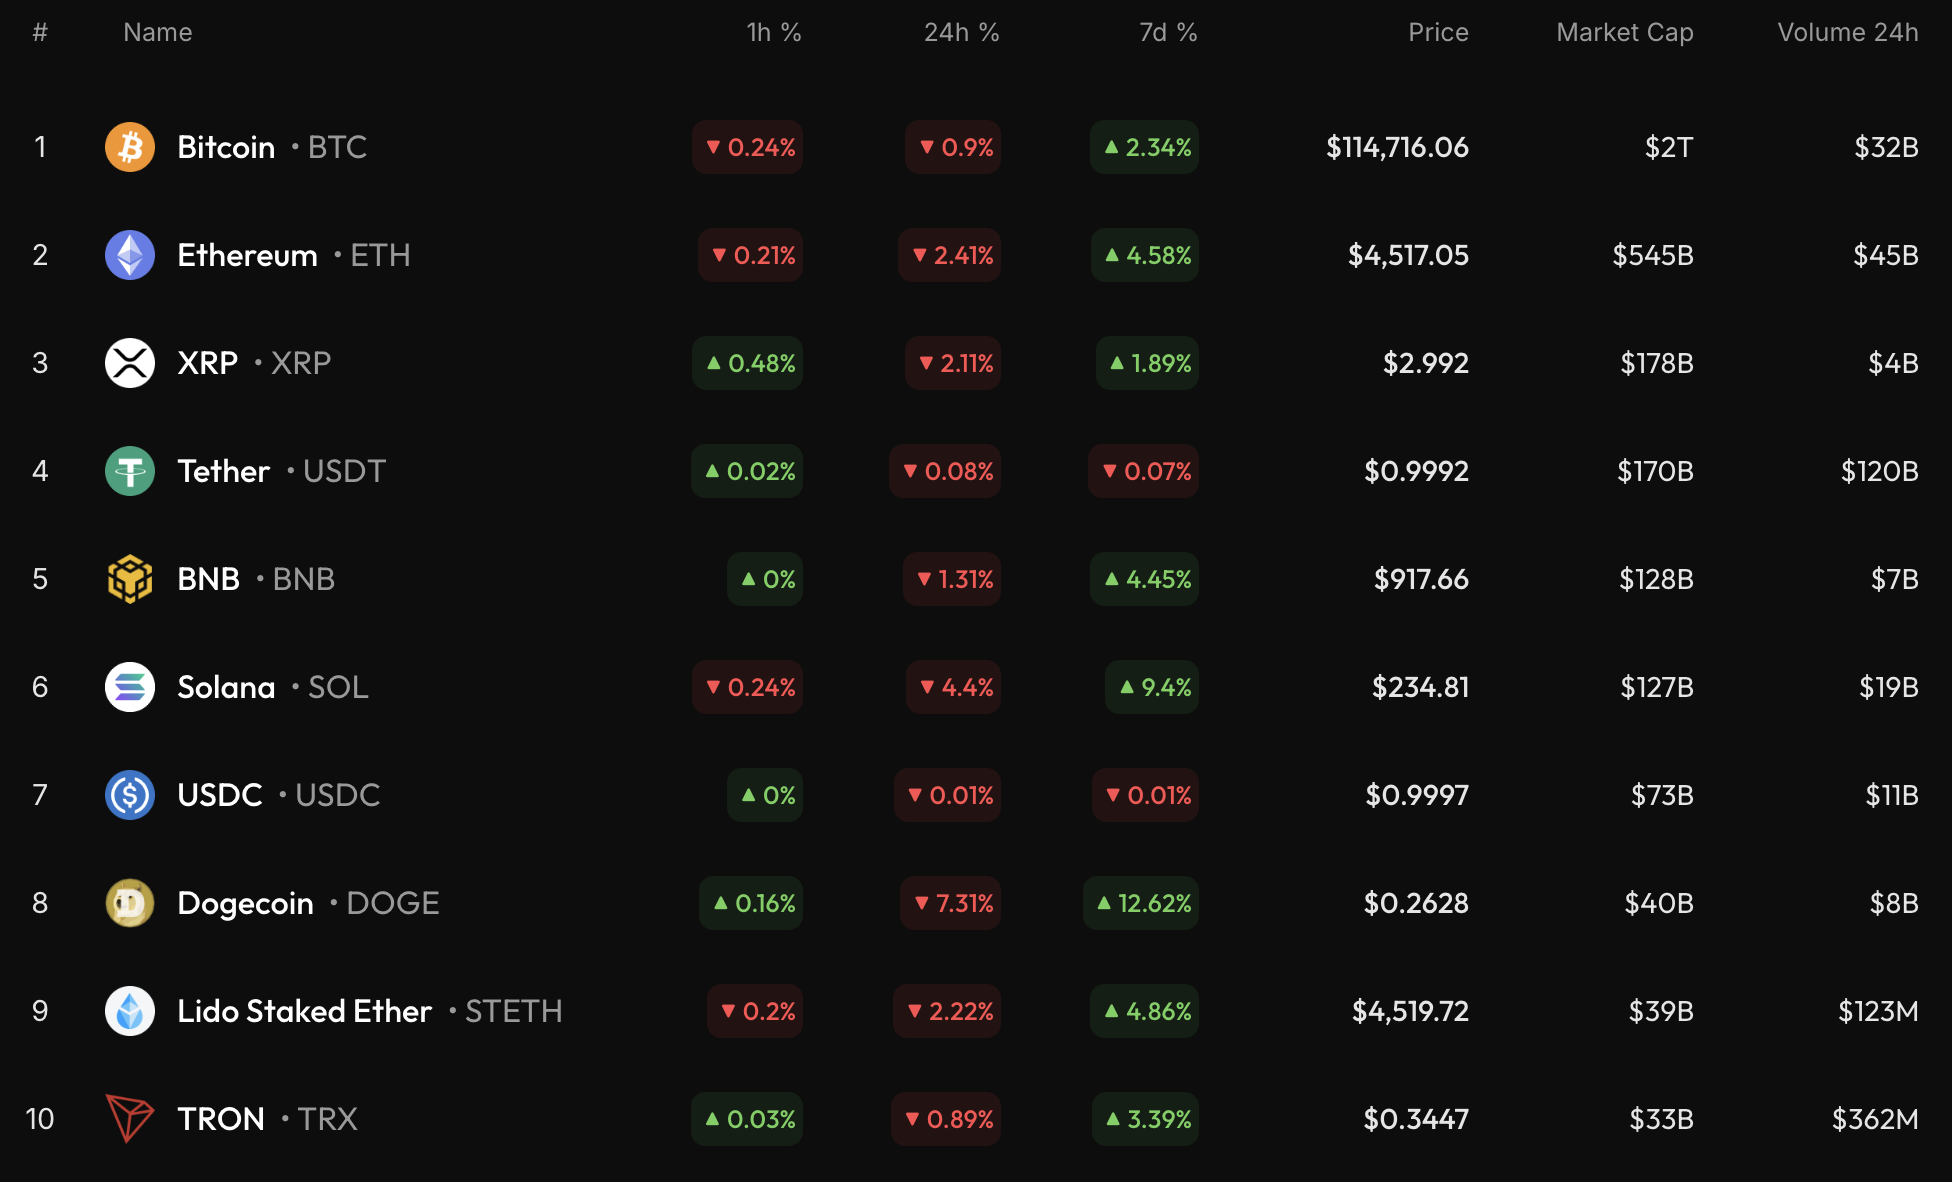
Most of the coins are in the red zone on the first day of the week, according to CoinStats.
BTC/USD
The price of Bitcoin (BTC) has declined by 2.41% over the past day.
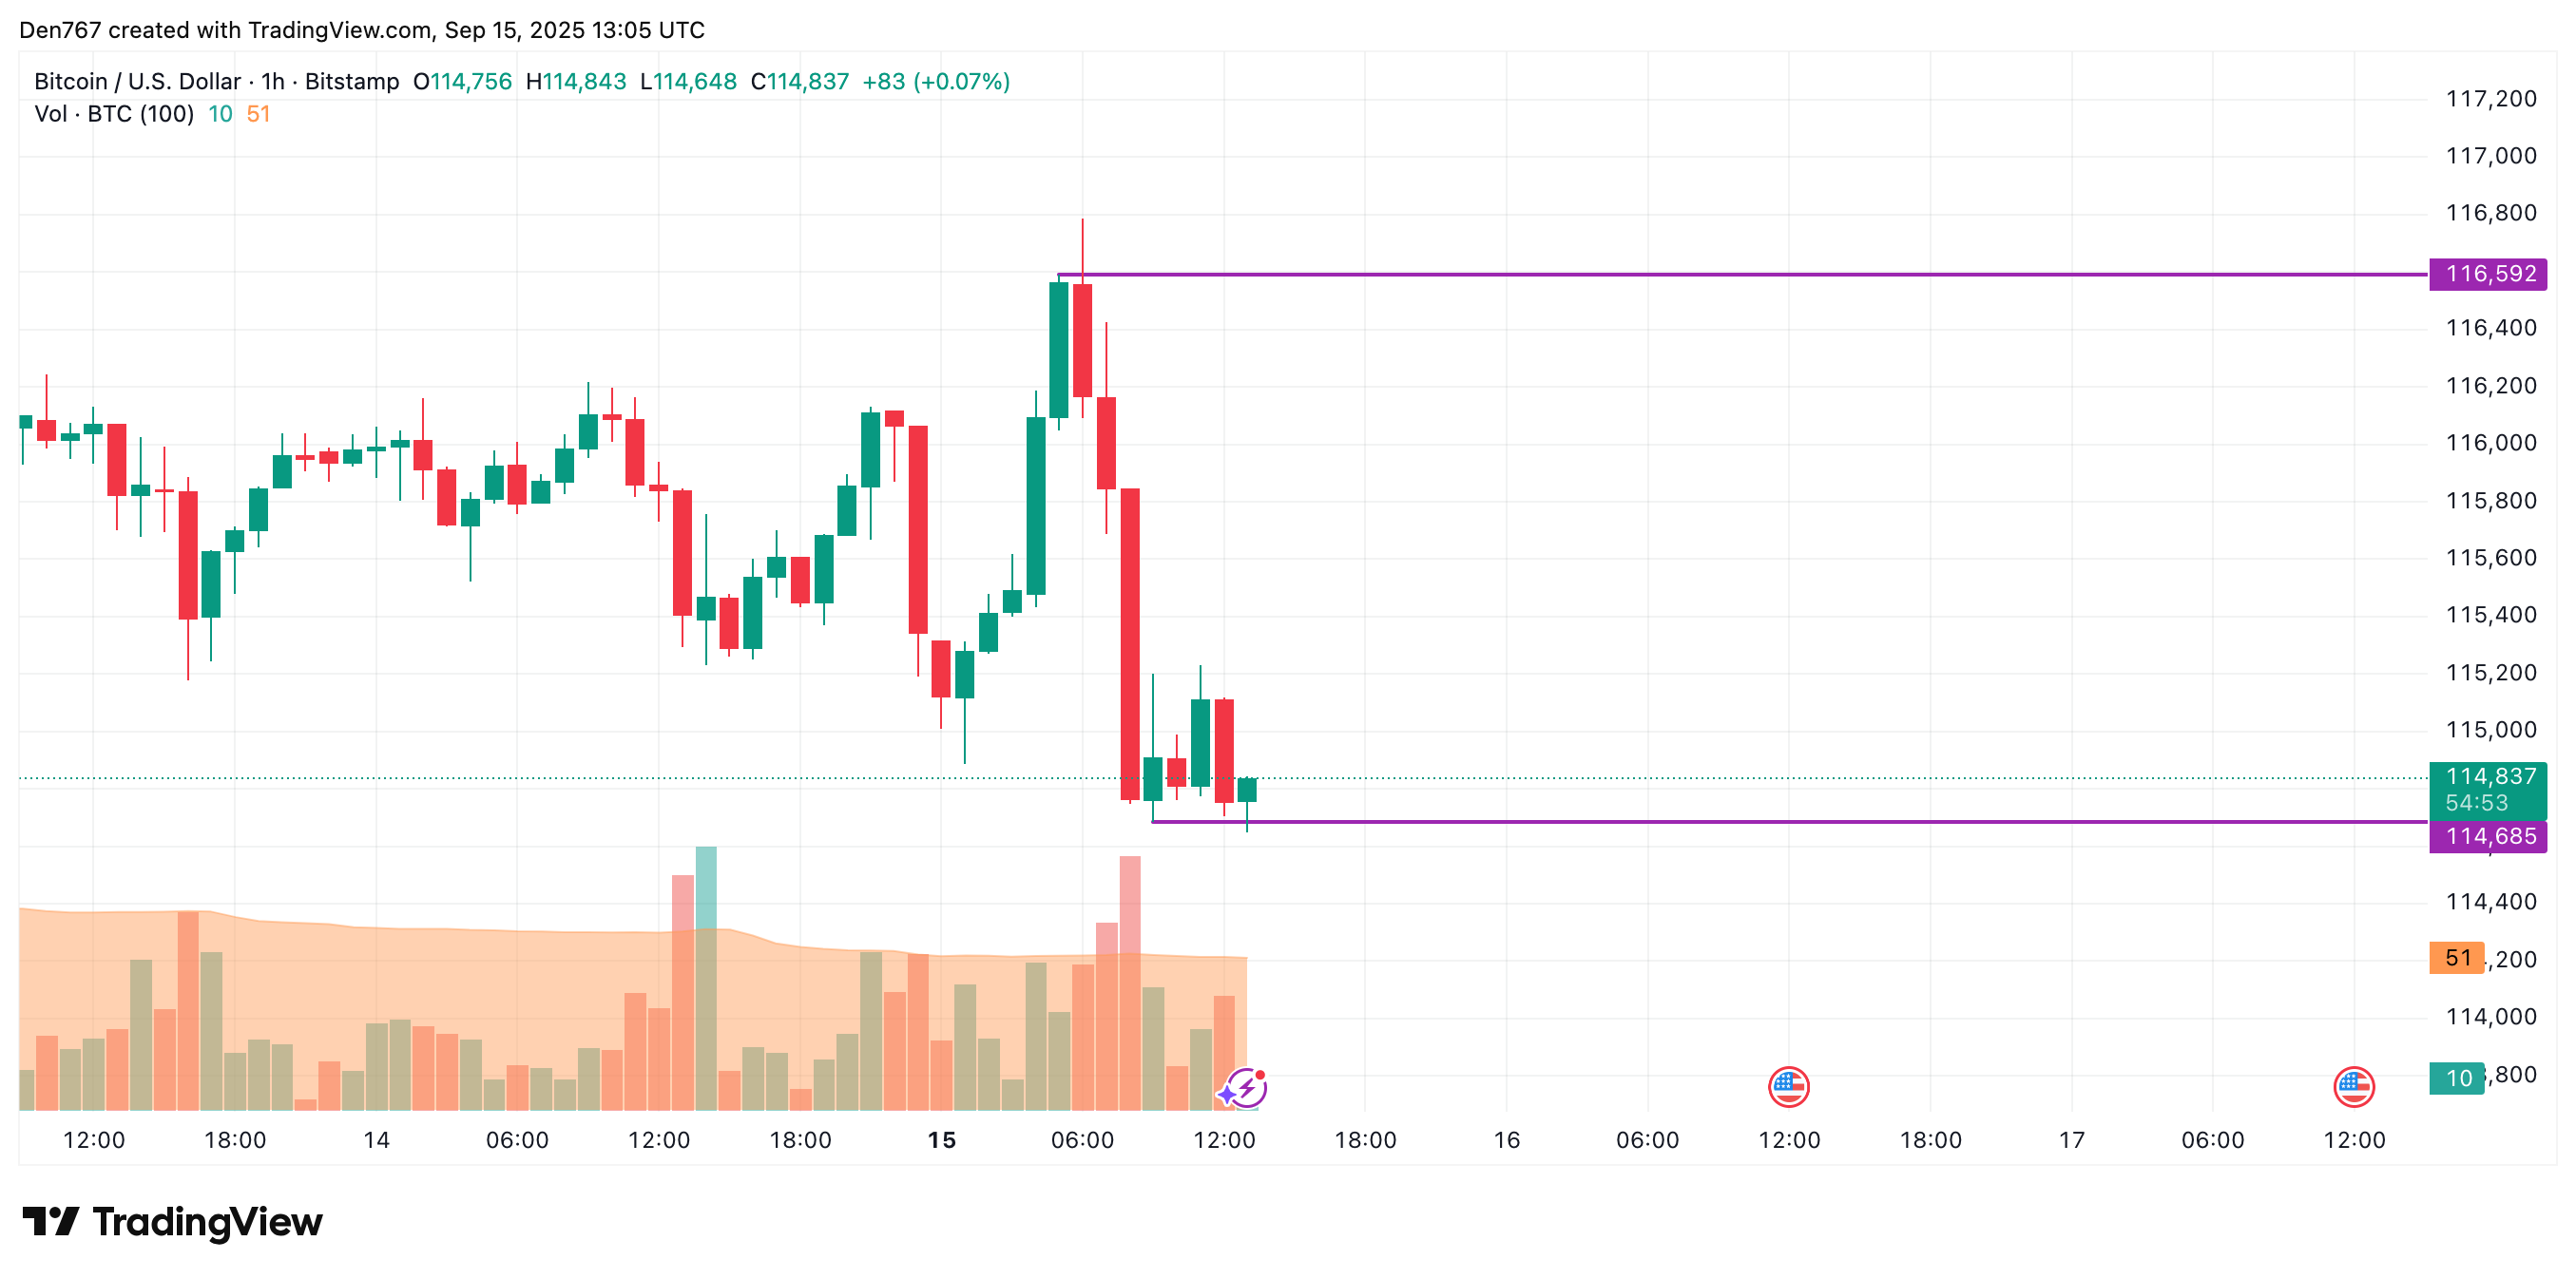
On the hourly chart, the rate of BTC has made a false breakout of the local support of $114,685. If a bounce back does not happen by the end of the day, one can expect a level breakout, followed by an ongoing drop to the $114,000 range.
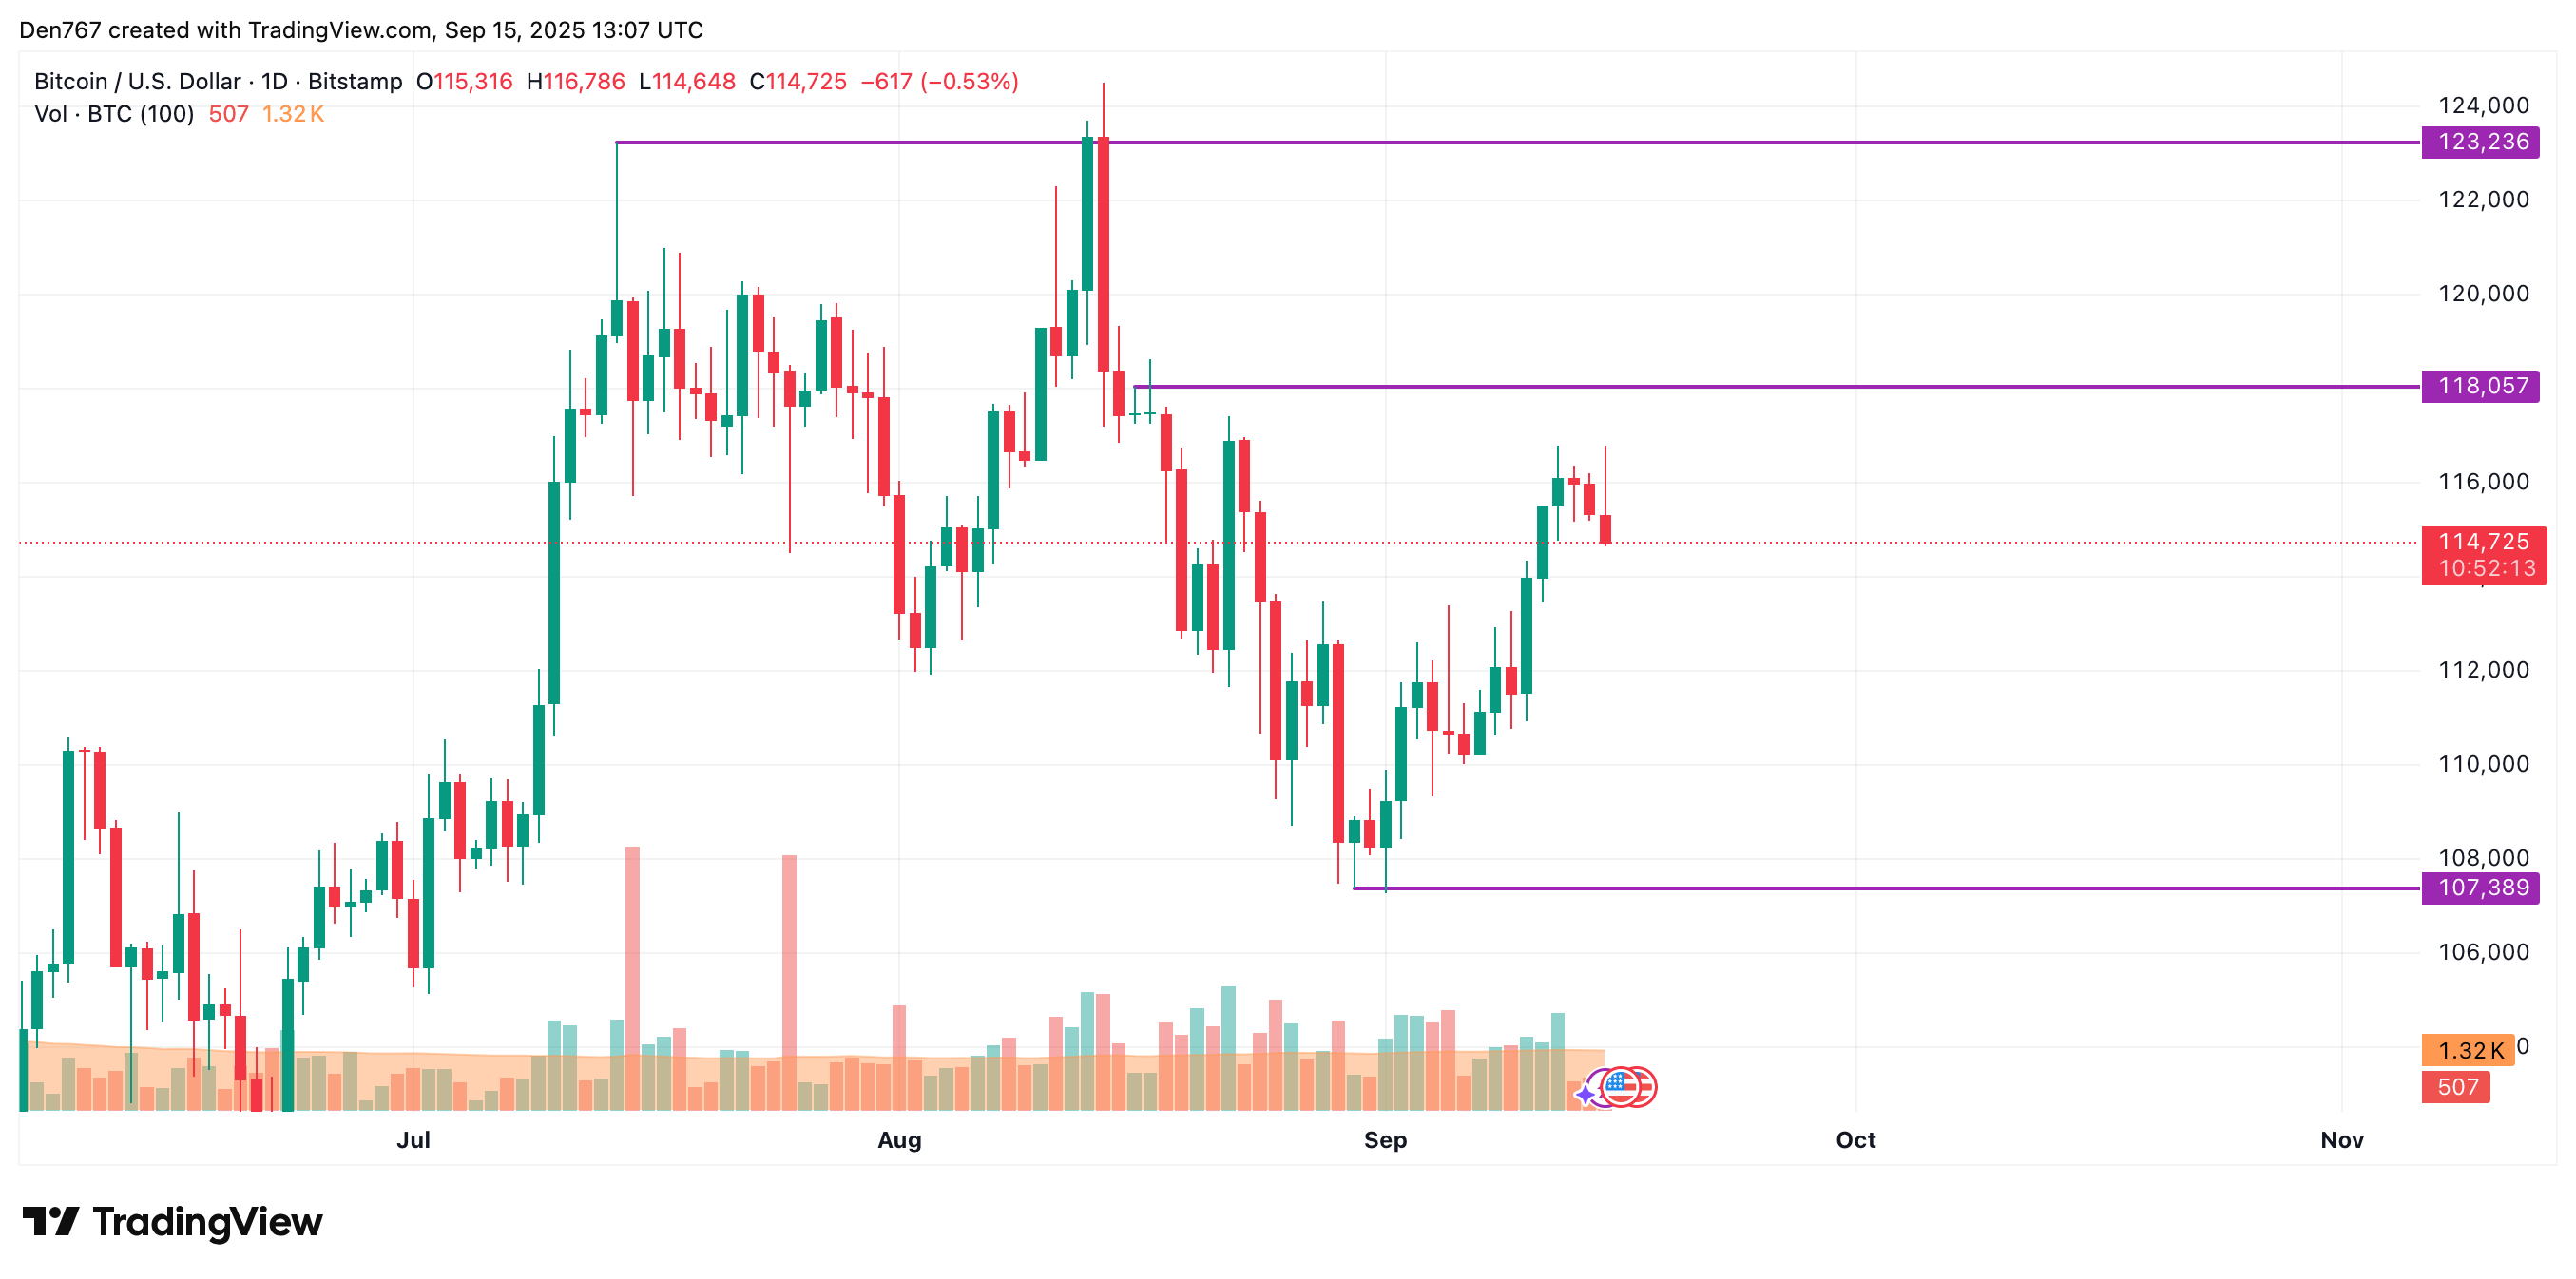
On the longer time frame, sellers are trying to seize the initiative.
If the daily candle closes around the current price or below, there is a high chance to see a test of the $113,000-$114,000 area by the end of the week.
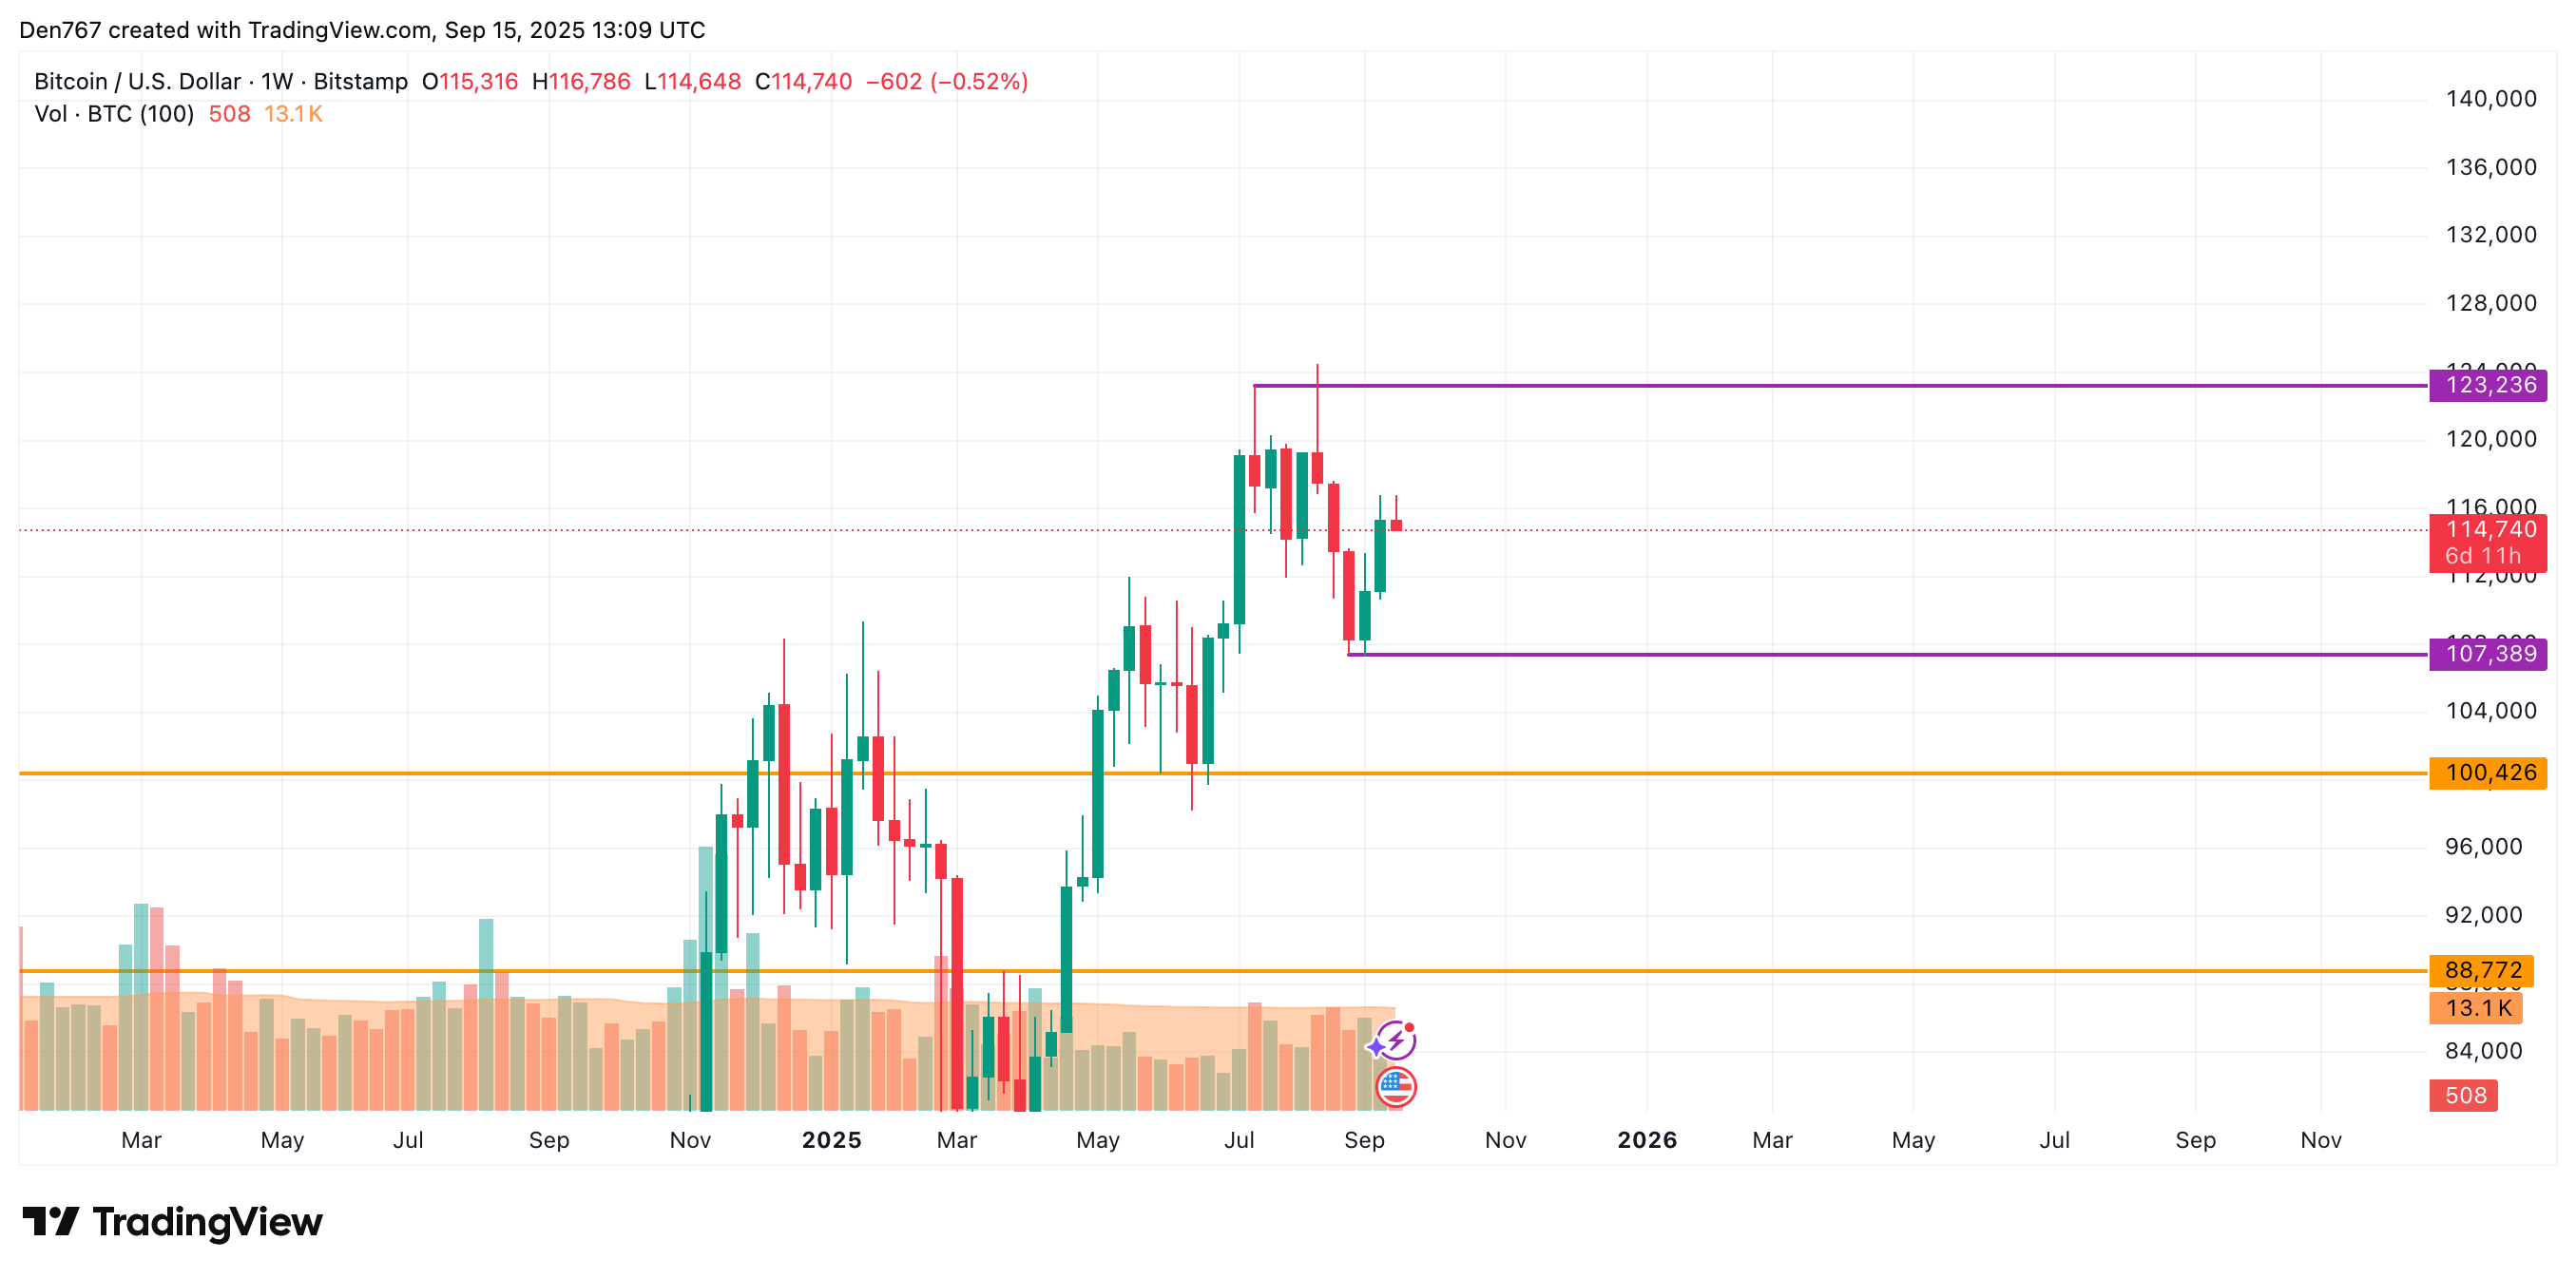
From the midterm point of view, neither buyers nor sellers are controlling the situation on the market as the price is in the middle of the channel, between the support of $107,389 and the resistance of $123,236. All in all, consolidation in the area of $113,000-$118,000 is the most likely scenario until the end of the month.
Bitcoin is trading at $114,734 at press time.