Bitcoin was priced at $112,686 on Sept. 22, 2025, with a market capitalization of $2.24 trillion and a 24-hour trading volume of $51.67 billion. The cryptocurrency traded within a daily range of $111,986 to $115,776, reflecting a period of elevated volatility and pivotal technical signals across multiple timeframes.
Bitcoin
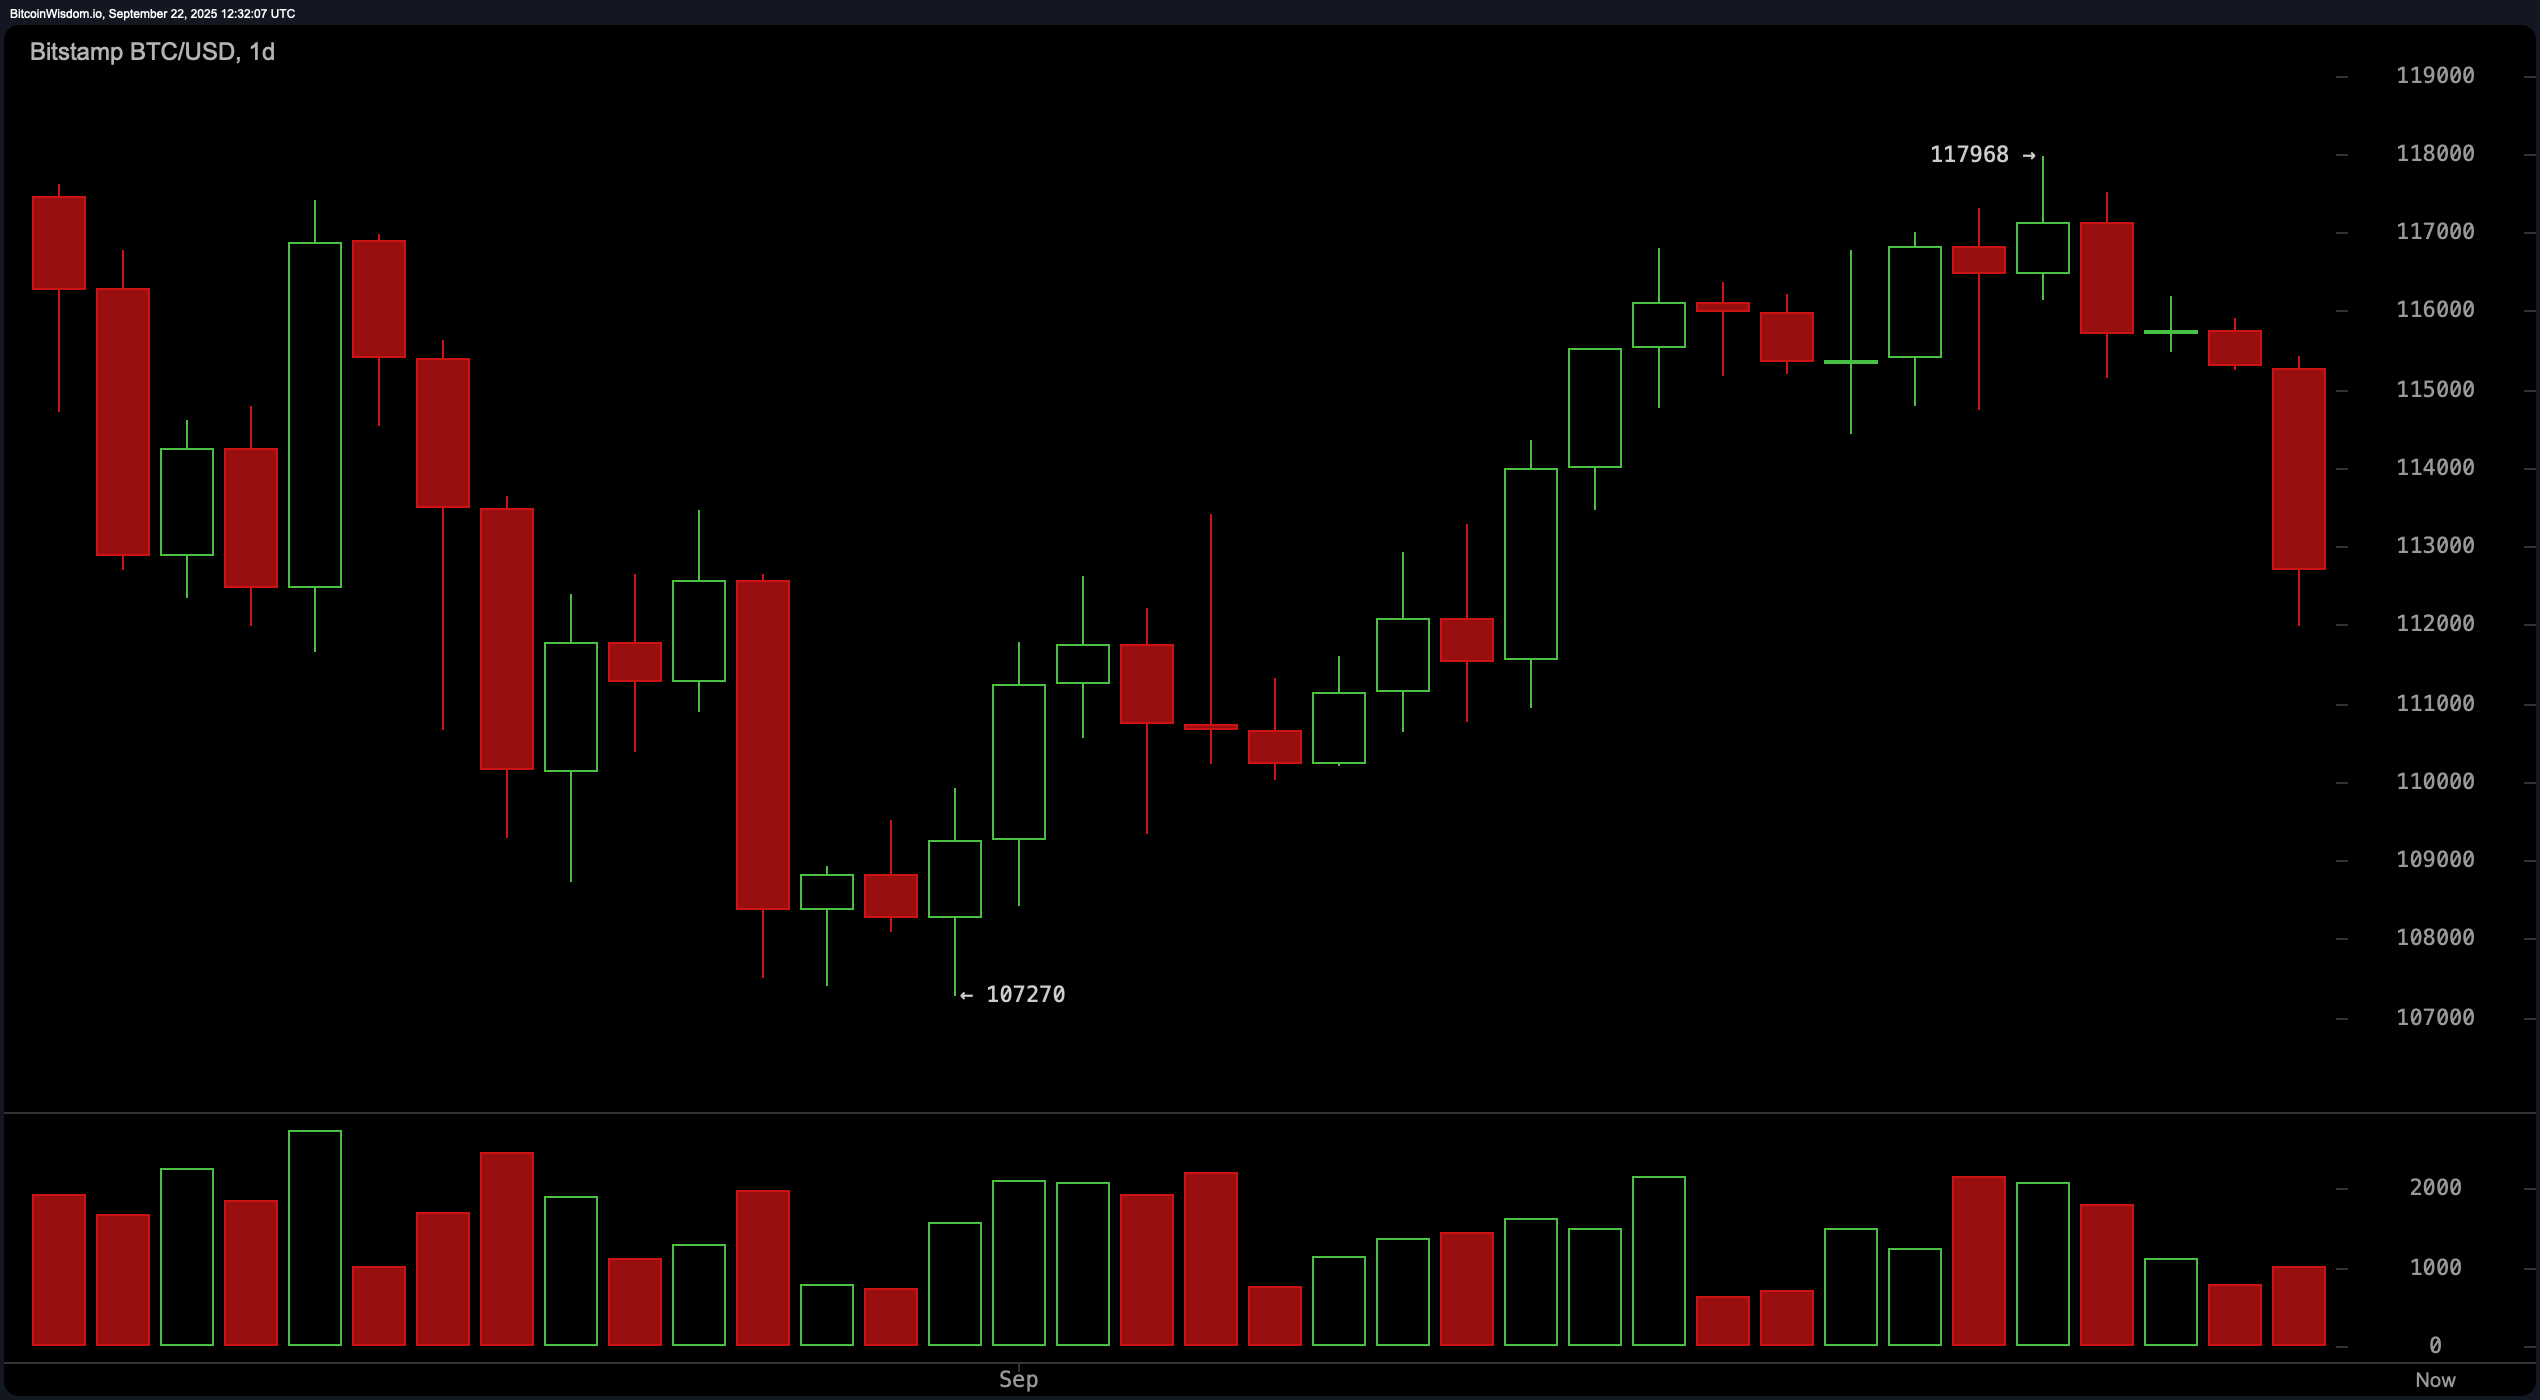
The daily chart reveals that bitcoin is experiencing a corrective phase following a short-term uptrend that peaked near $117,968. A bearish engulfing candle formed as the price reversed with significant volume, falling toward a support band between $112,000 and $113,000.
While a local bottom around $107,270 previously spurred bullish momentum, current price action suggests caution. The recommended strategy at the daily level is to wait for confirmation of support before re-entry, with upside potential toward the $116,000–$117,500 range and a stop loss beneath $111,000.
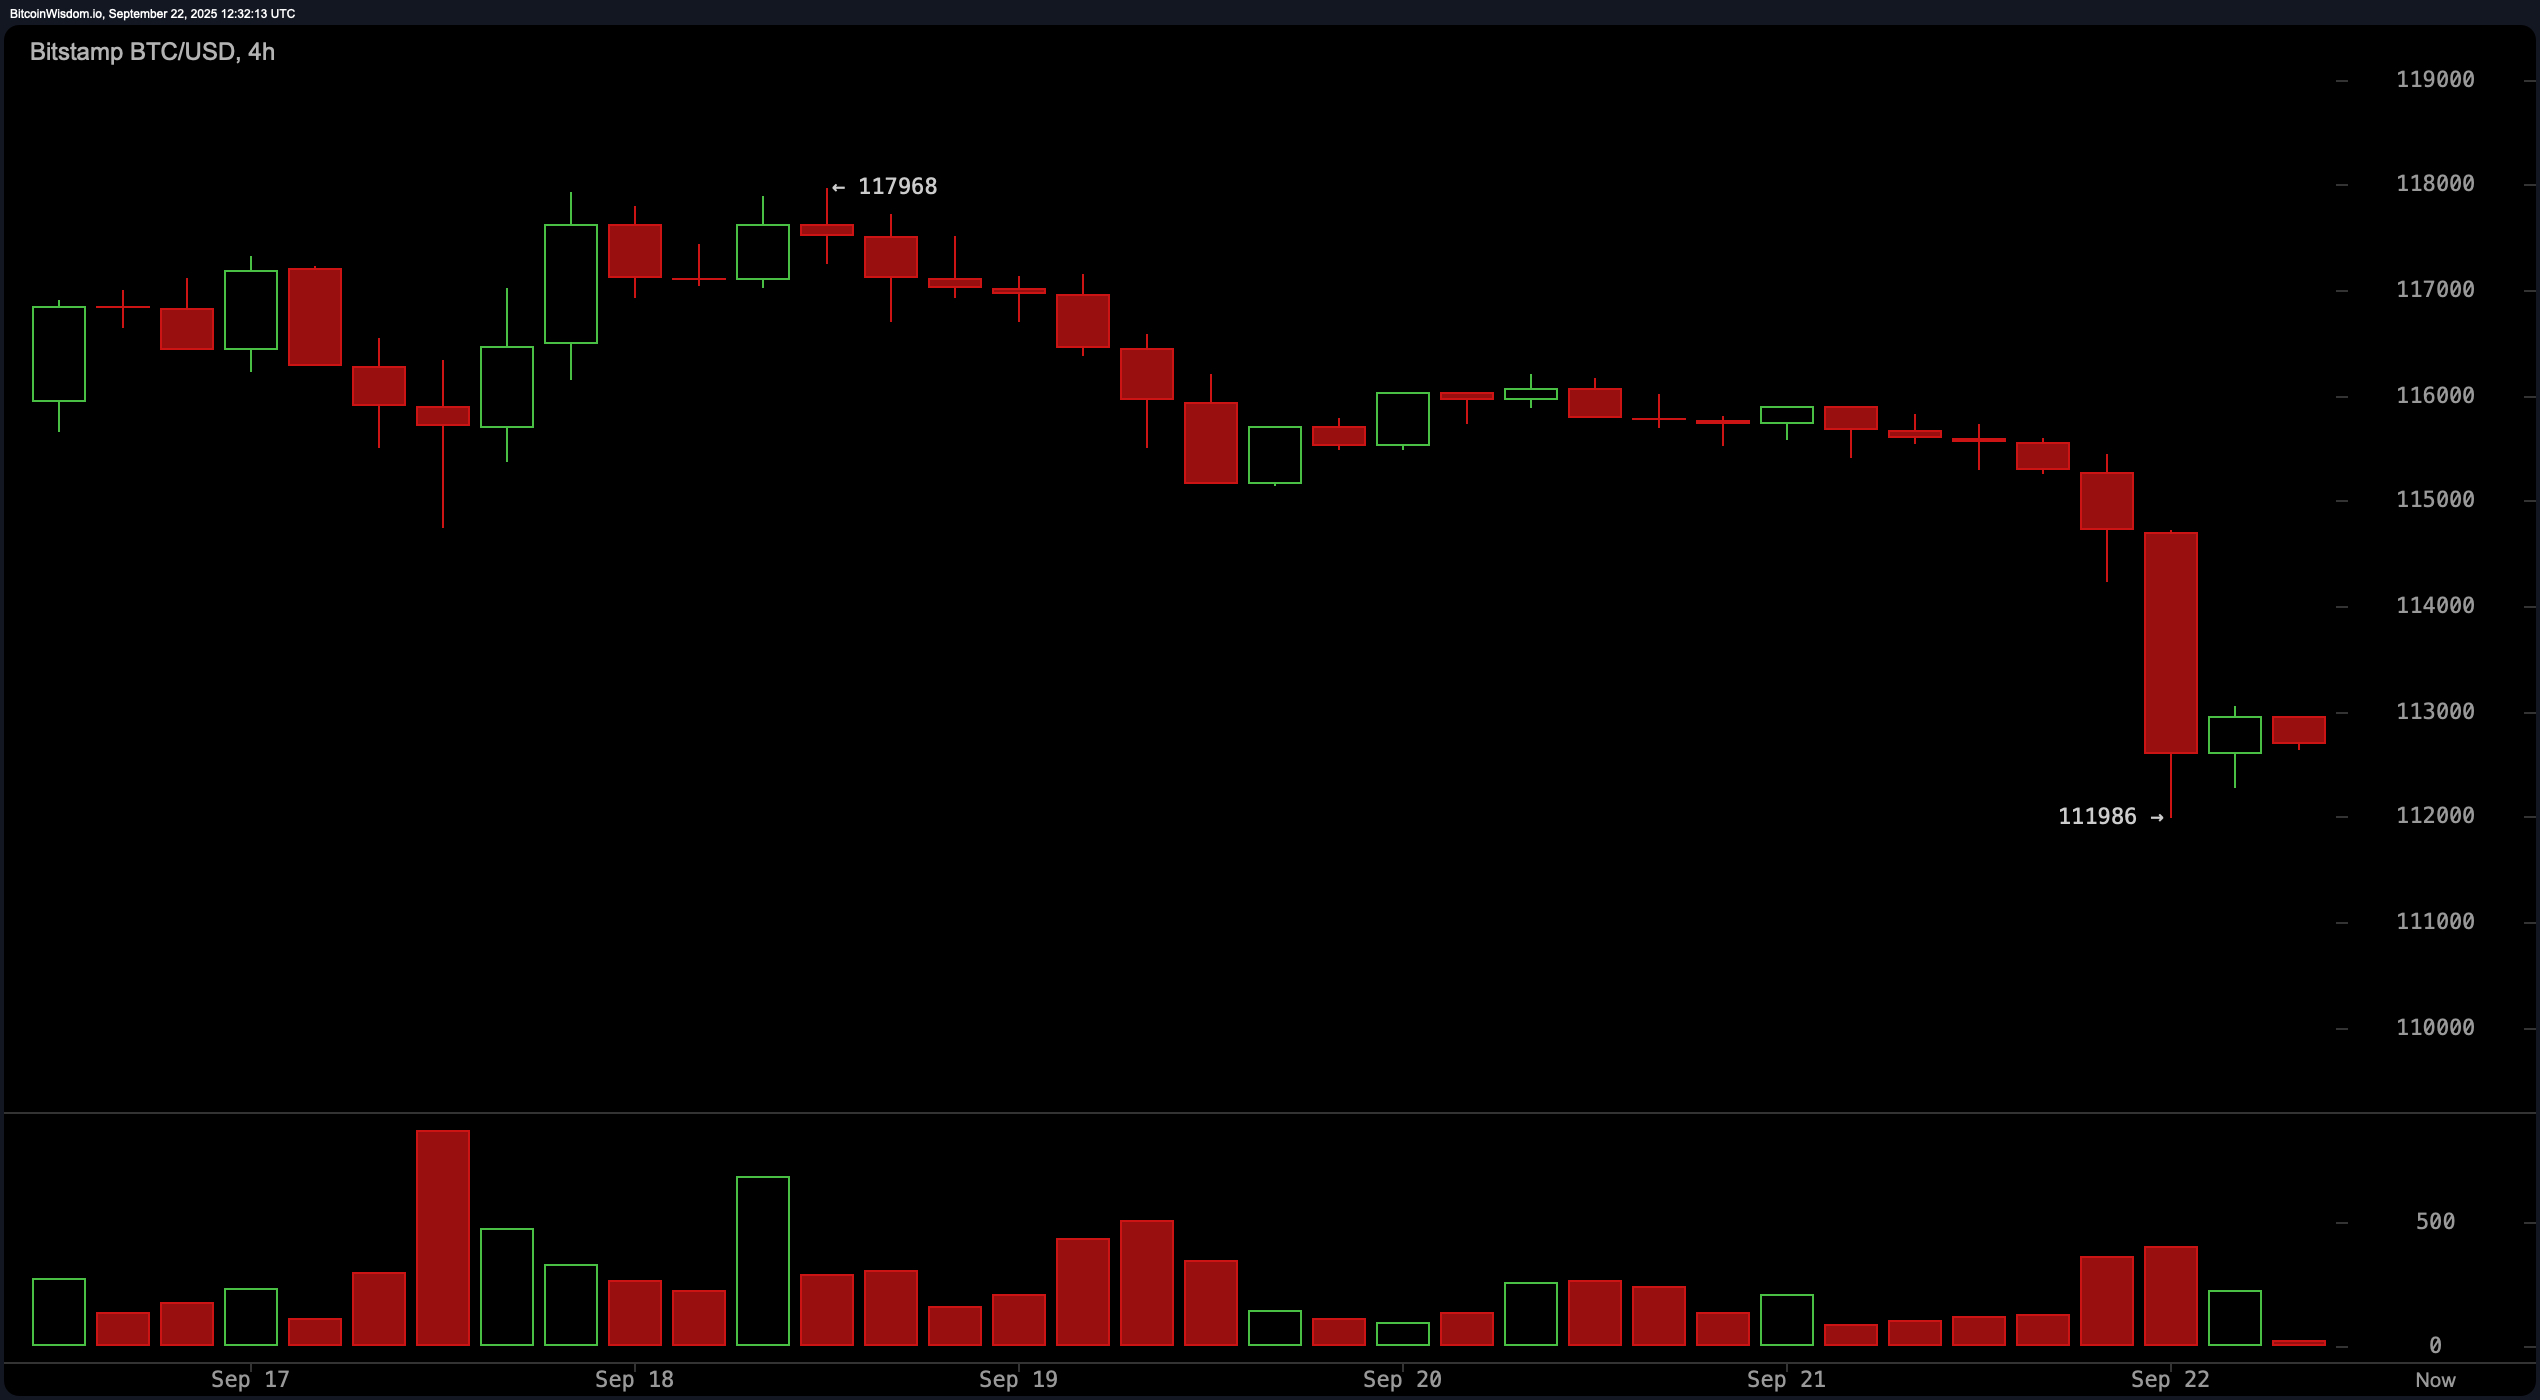
On the 4-hour chart, bitcoin underwent a sharp decline from $117,968 down to $111,986, marking a pronounced drop followed by a slight bounce. Volume surged during the decline, possibly signaling capitulation. While the short-term trend remains bearish, there are early signs of stabilization. The last four candles indicate waning selling pressure, supporting a neutral-to-bullish stance should price consolidate and break above $113,500. A cautious entry near $112,000–$113,500 may yield gains up to $116,000, provided support holds above $111,500.
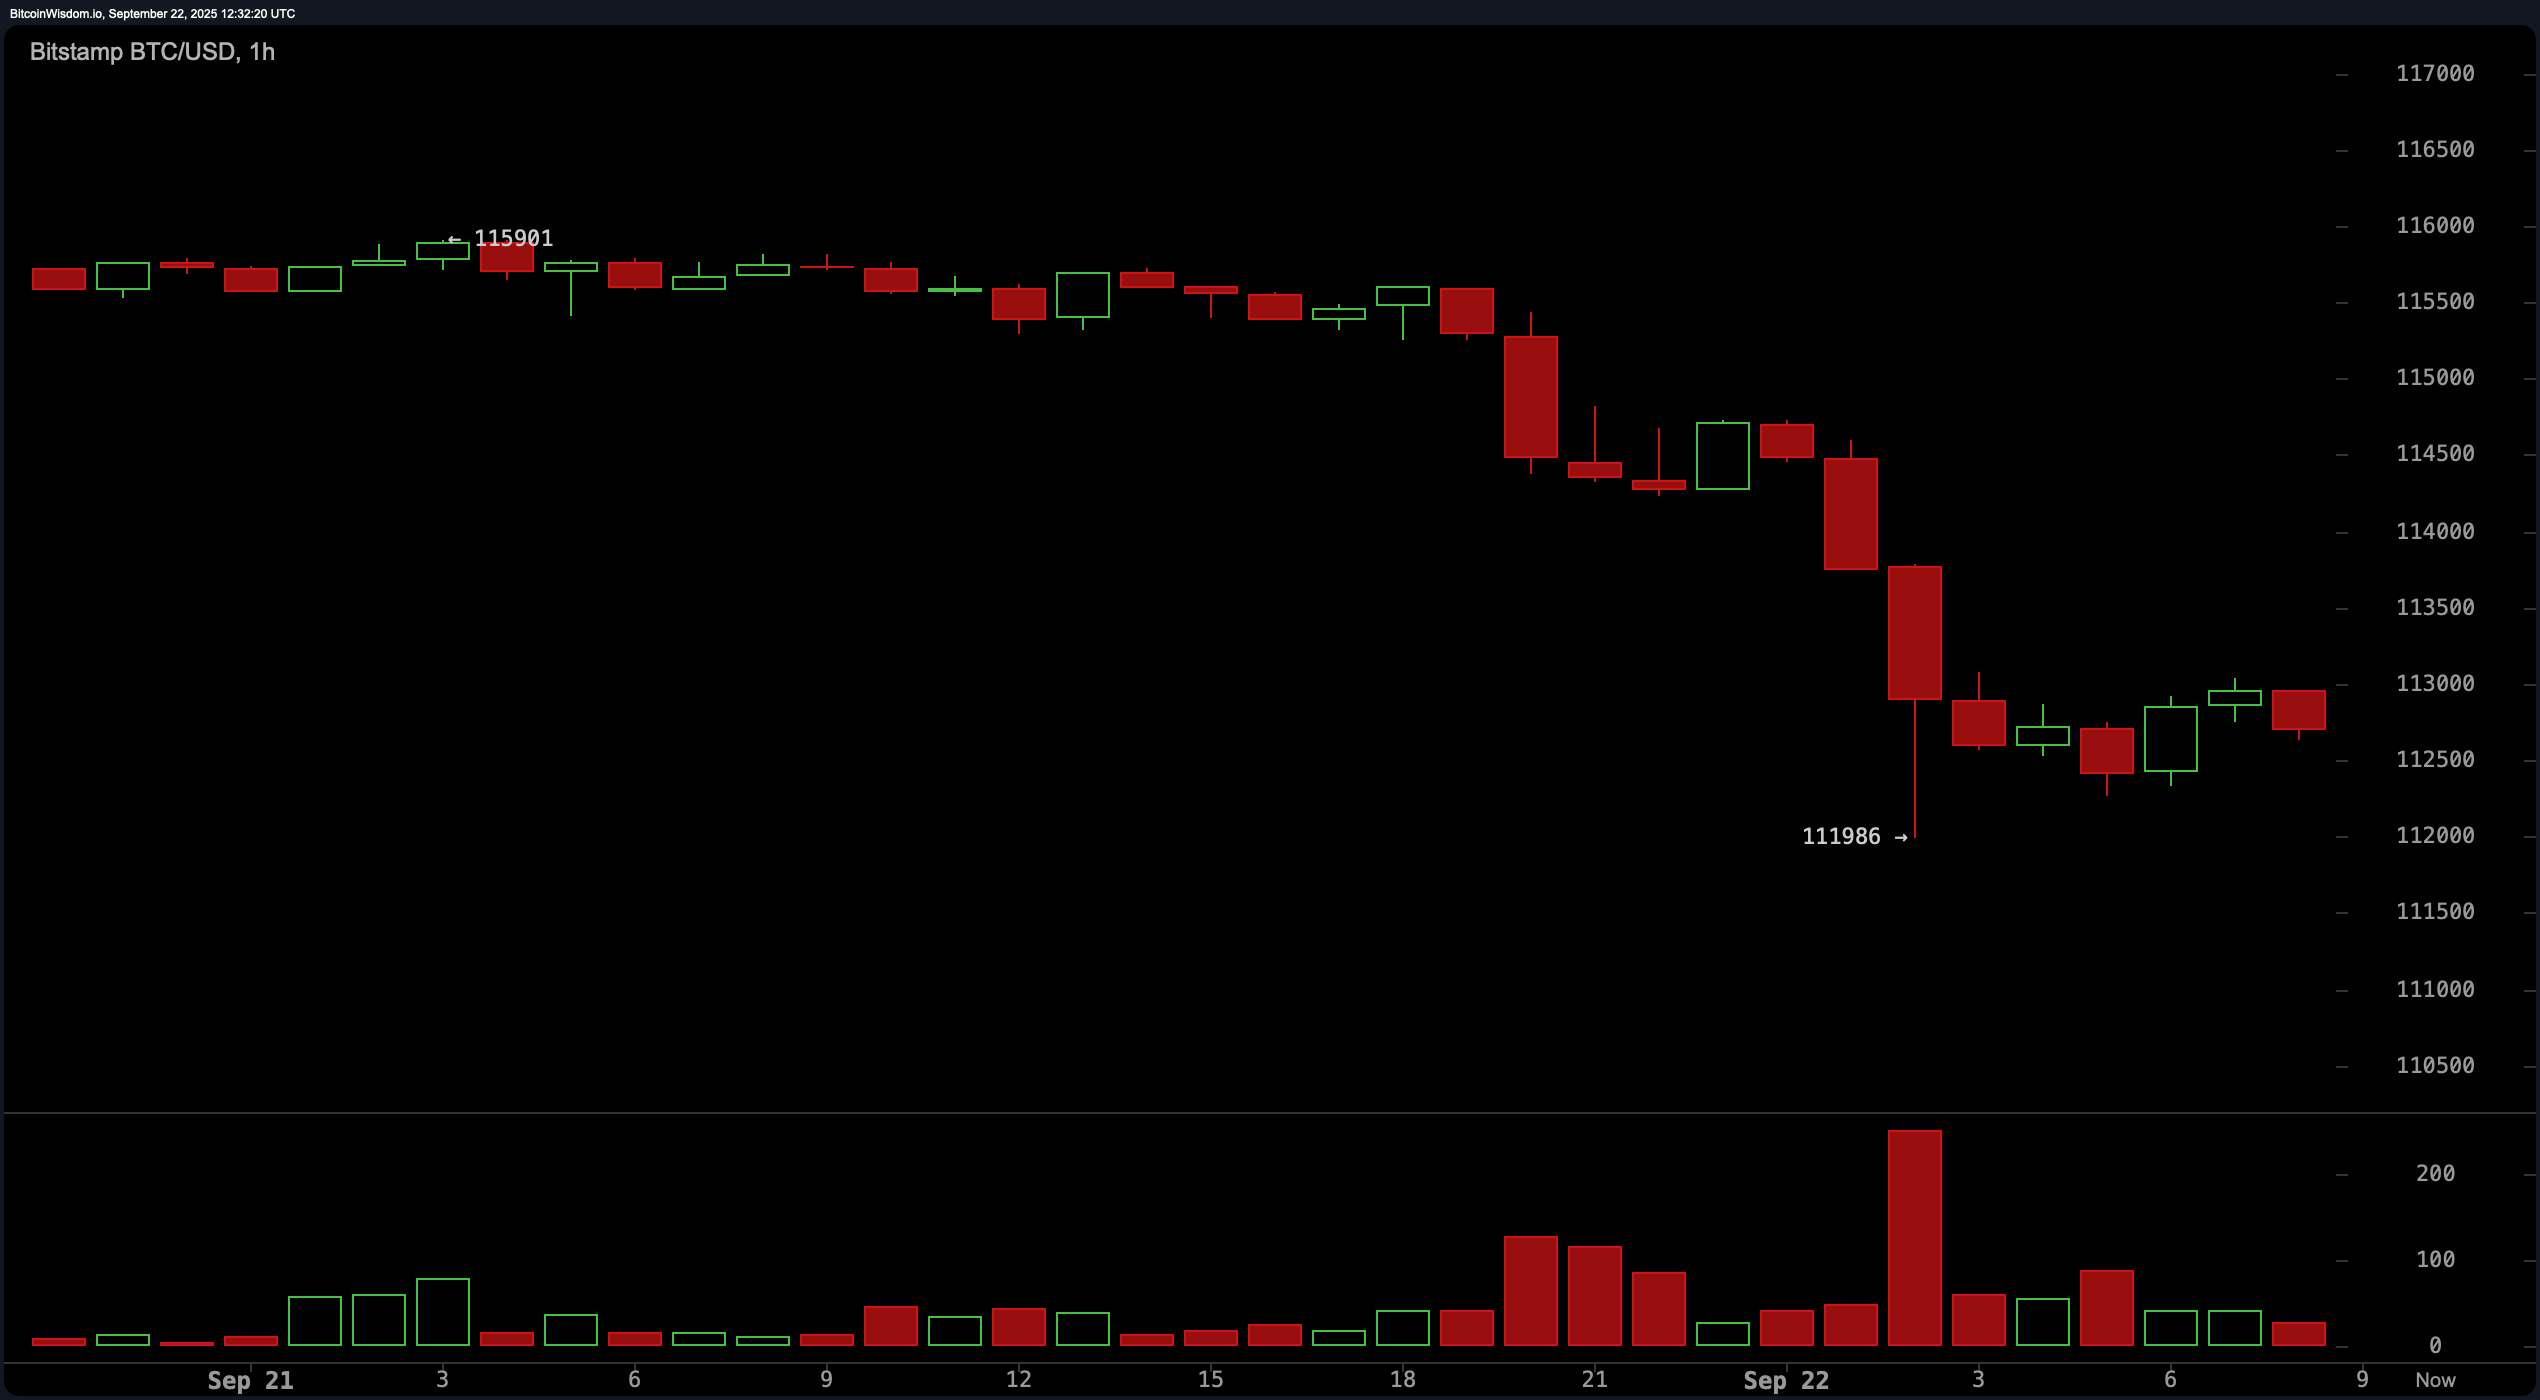
The 1-hour bitcoin chart depicts a continuing micro downtrend, with the price fluctuating between $112,500 and $113,000. A surge in volume on the move to $111,986 suggests a potential capitulation candle, often a precursor to a reversal. While bearish momentum is still evident, its strength is diminishing. Accumulation may be occurring at current levels. A breakout above $113,300 on strong volume could offer a short-term opportunity with targets at $114,500–$115,000, but any scalp entries should be managed with a tight stop at $112,000.
From an oscillator standpoint, indicators remain largely neutral. The relative strength index (RSI) is at 44, the Stochastic oscillator is at 54, the commodity channel index (CCI) sits at -21, and the average directional index (ADX) is at 17, all signaling indecision. The Awesome oscillator reflects a value of 2,710, also neutral. However, the momentum indicator shows a bearish -3,443 and the moving average convergence divergence (MACD) level registers at 551, also suggesting a bearish signal. These collectively point to market uncertainty with bearish undertones.
Moving averages (MAs) align with a bearish narrative in the short to medium term. The exponential moving averages (EMAs) for 10, 20, and 30 periods—all above the current price—suggest downside pressure, as do the corresponding simple moving averages (SMAs). The 50-period EMAs and SMAs continue the bearish alignment. However, the 100-period exponential moving average (EMA) at $111,882 and the 200-period EMA at $105,991 flash bullish signals, indicating deeper trend support. Long-term bullish structure remains intact, but short-term positioning must be carefully managed given prevailing selling pressure.
Bull Verdict:
Despite the current pullback, bitcoin remains structurally bullish on higher timeframes, with key long-term moving averages signaling continued upward momentum. A confirmed rebound from the $112,000–$113,000 support zone, coupled with a breakout above $113,500, could reinstate bullish control, targeting a return to recent highs near $117,500 and potentially higher.
Bear Verdict:
Bitcoin’s inability to hold above short-term moving averages, paired with weakening momentum indicators and a bearish engulfing pattern on the daily chart, suggests the path of least resistance remains to the downside. Failure to defend the $112,000 support zone could open the door to deeper retracements, with bearish continuation likely if price breaks below $111,500.