Despite a strong upward trajectory and renewed investor interest, bitcoin appears to be entering a short-term cooling phase following last night’s recent all-time high. Technical signals across multiple timeframes show bullish momentum remains intact, yet warning signs suggest a potential retracement before further gains.
Bitcoin Chart Outlook and Price Prediction
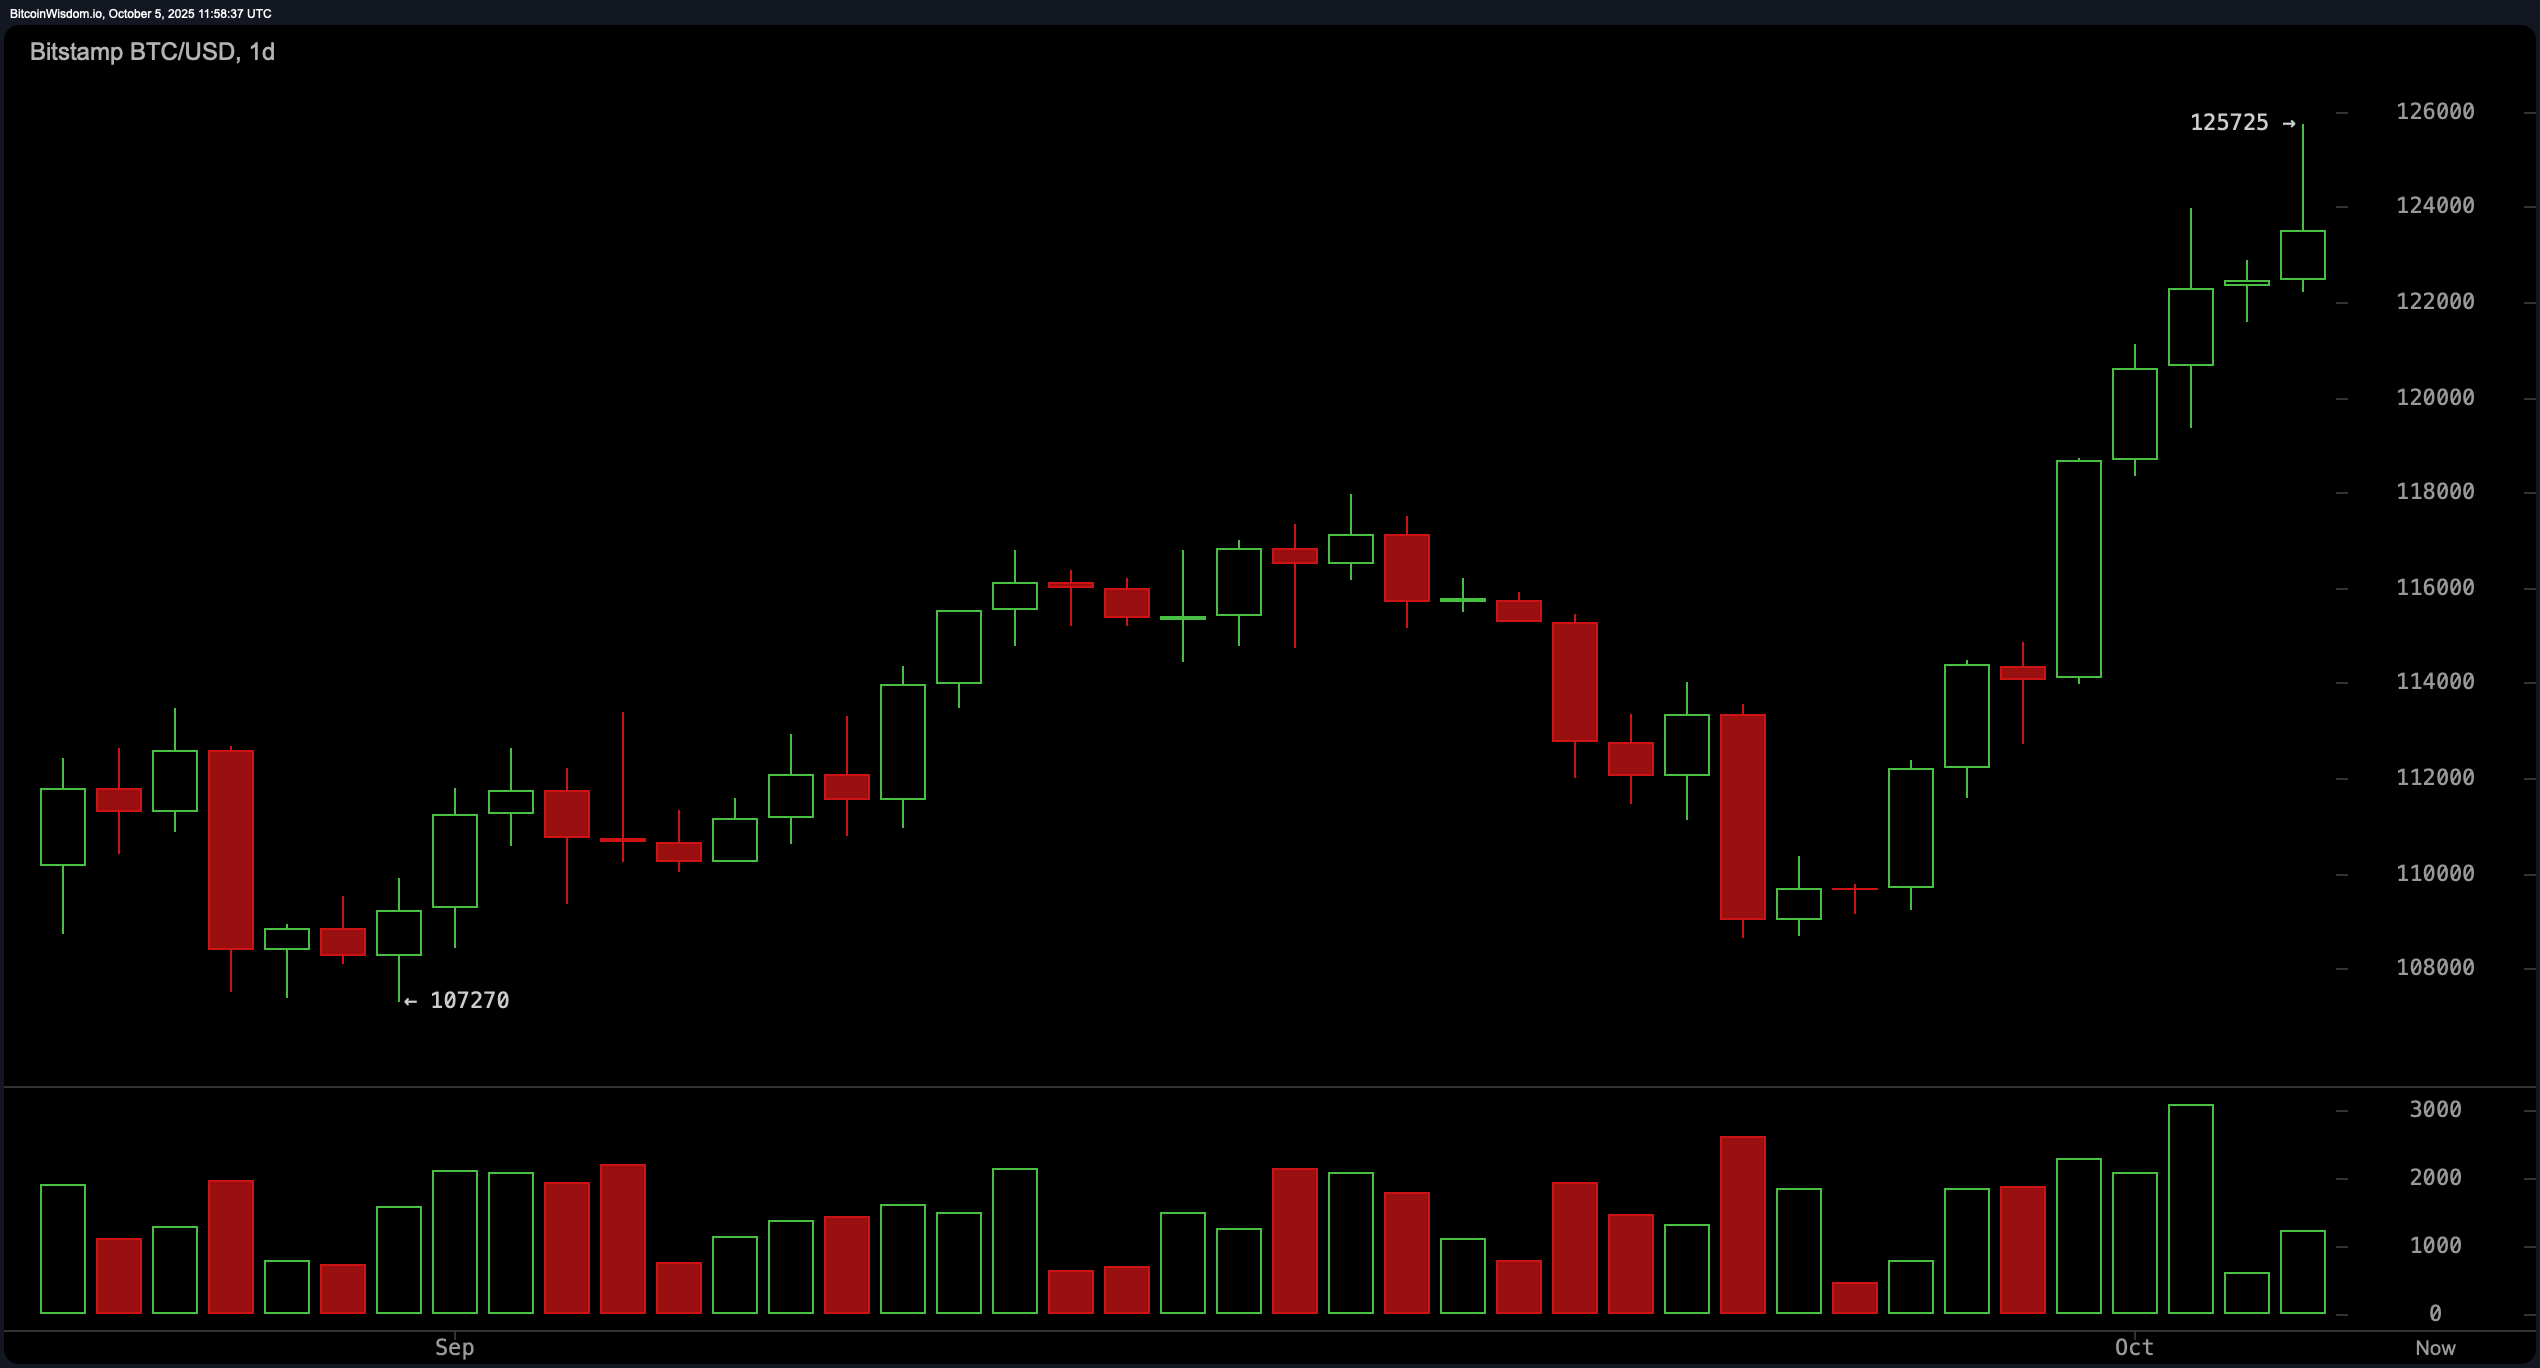
On the daily chart, bitcoin has clearly established a bullish structure, with higher highs and higher lows defining its upward trajectory. The price rallied strongly from the $107,000 zone to an intraday peak of $125,725, confirming bullish sentiment supported by increasing volume. However, the presence of an upper wick on the current candle signals possible profit-taking.
Combined with elevated levels in key oscillators, such as a relative strength index (RSI) of 71 and a stochastic reading of 89, the rally appears overextended, increasing the likelihood of near-term consolidation. Key support lies in the $120,000 to $121,000 range, while resistance remains firm around $125,000 to $126,000.
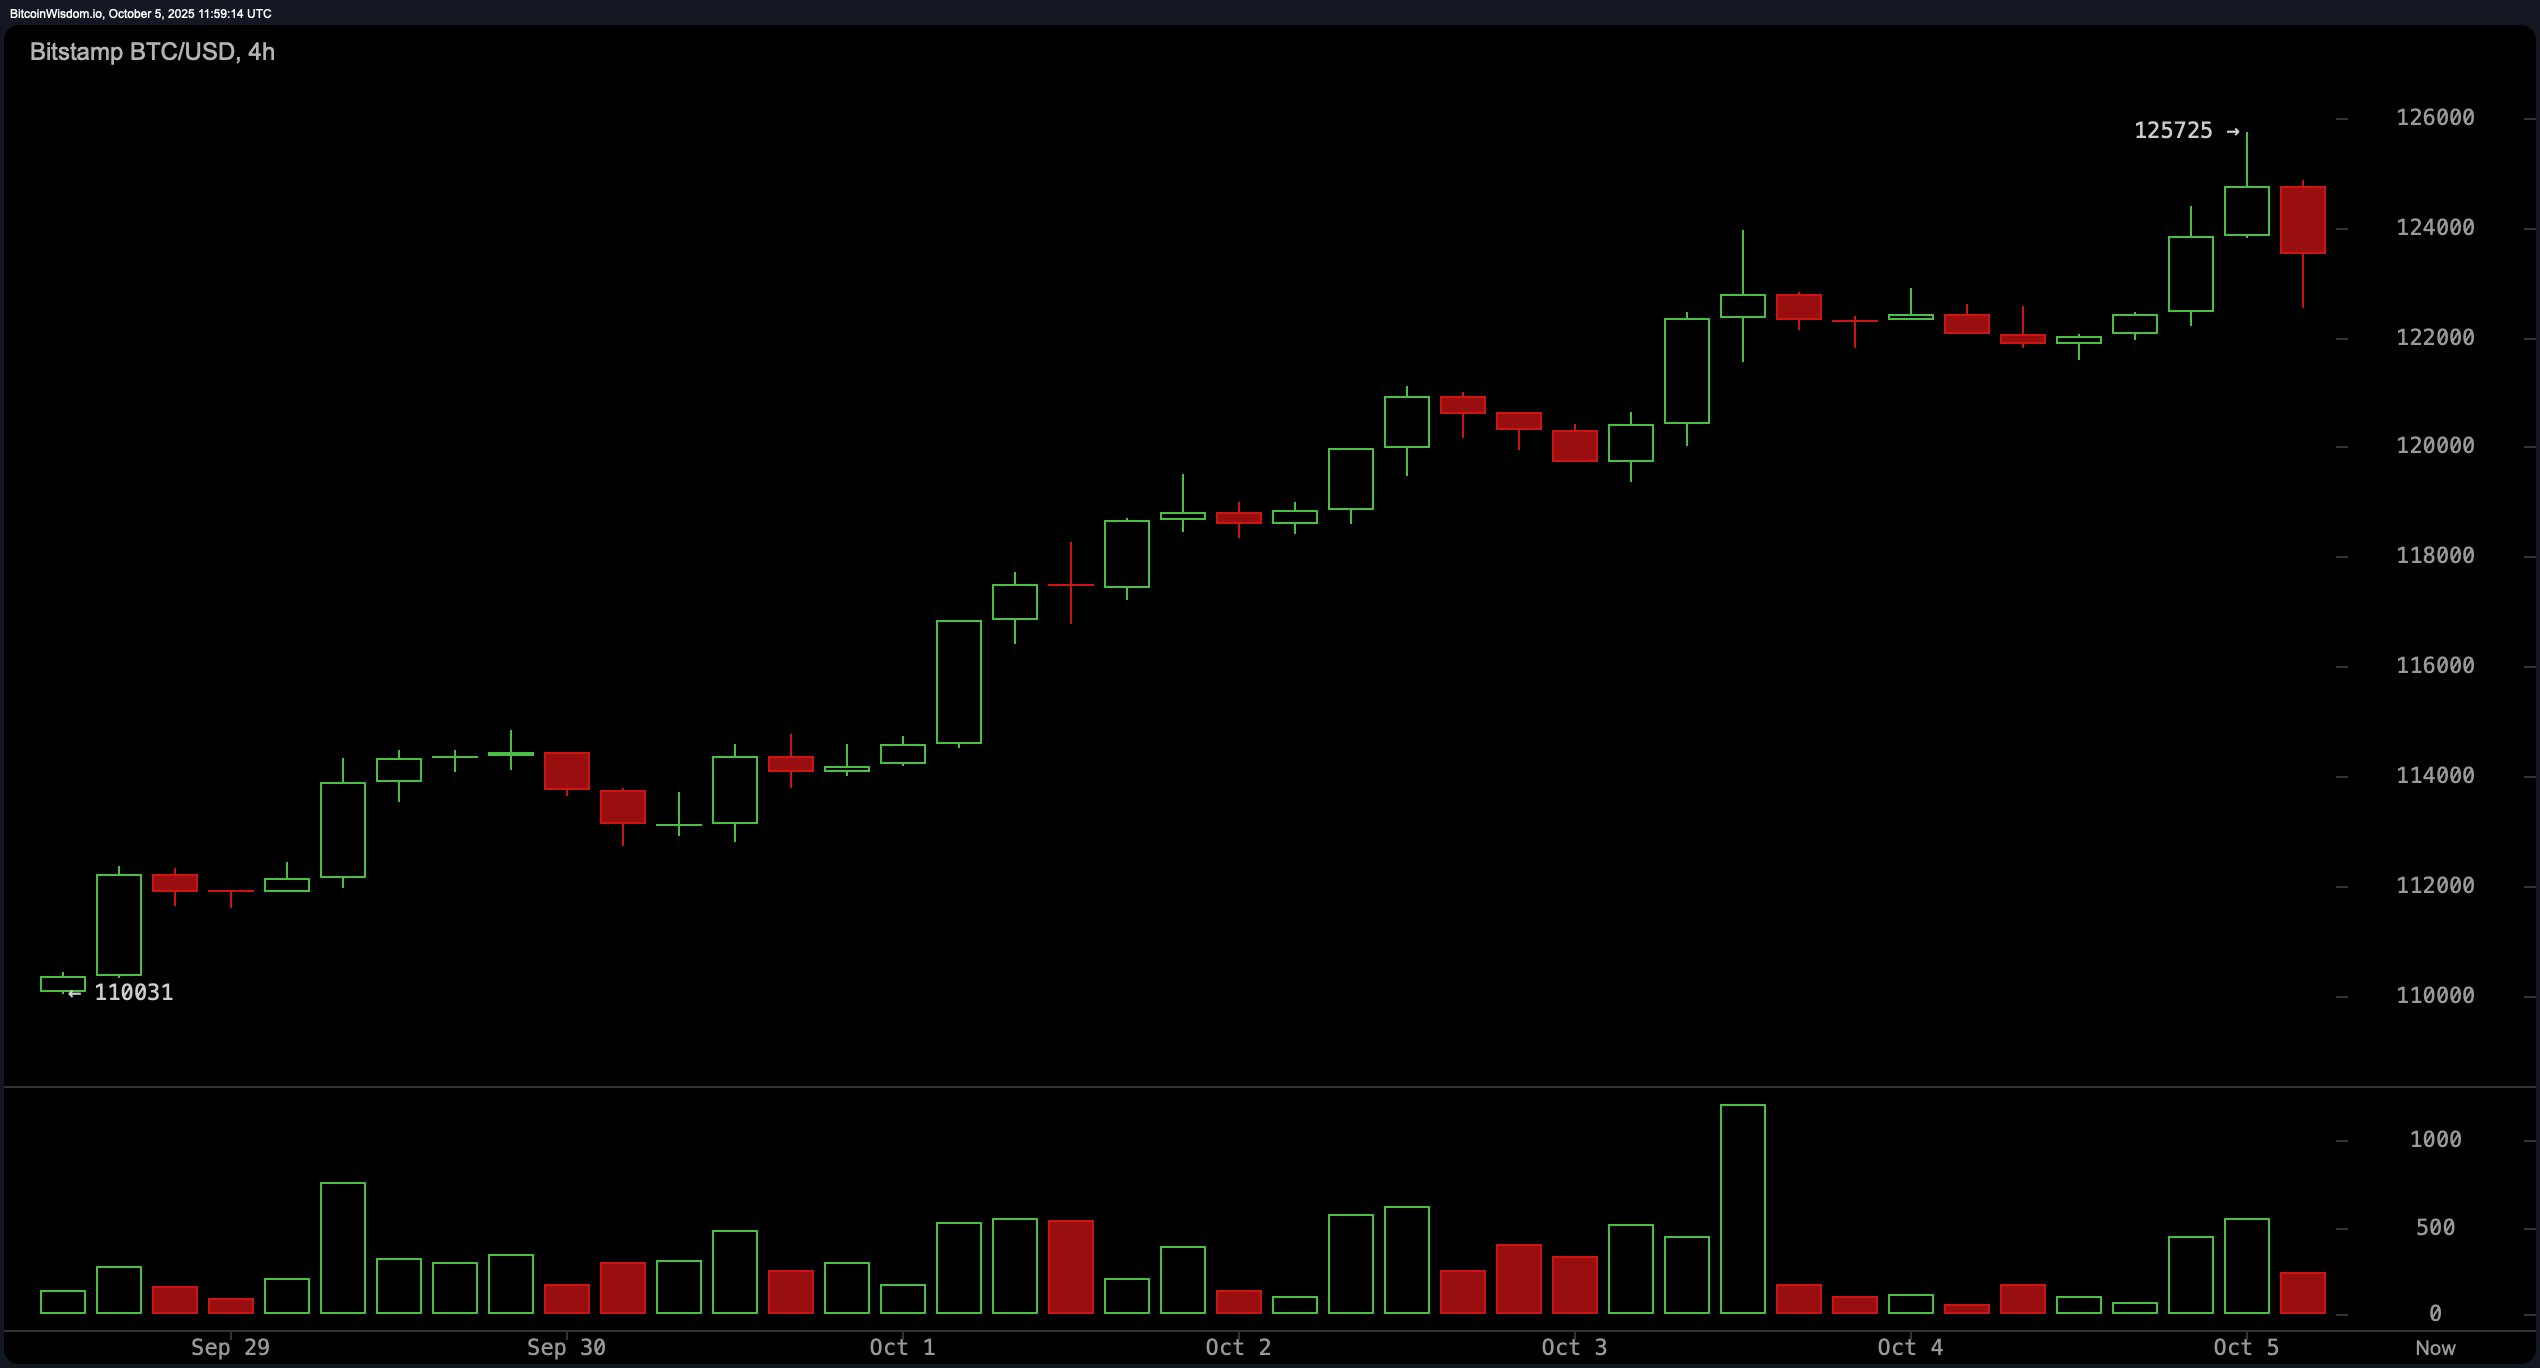
On the 4-hour chart, bitcoin shows a transitional phase. After reaching the daily high, the chart presented a bearish engulfing pattern, indicating the onset of a corrective move. Momentum indicators such as the average directional index (ADX) at 27 and the awesome oscillator at 6,472 remain neutral, reflecting the pause in the upward drive. A significant drop in volume reinforces the short-term slowdown. Should bitcoin hold support between $122,500 and $123,000, traders may consider re-entry upon bullish confirmation. Conversely, a break below $122,000 on strong volume would signal a deeper correction, potentially invalidating near-term bullish setups.
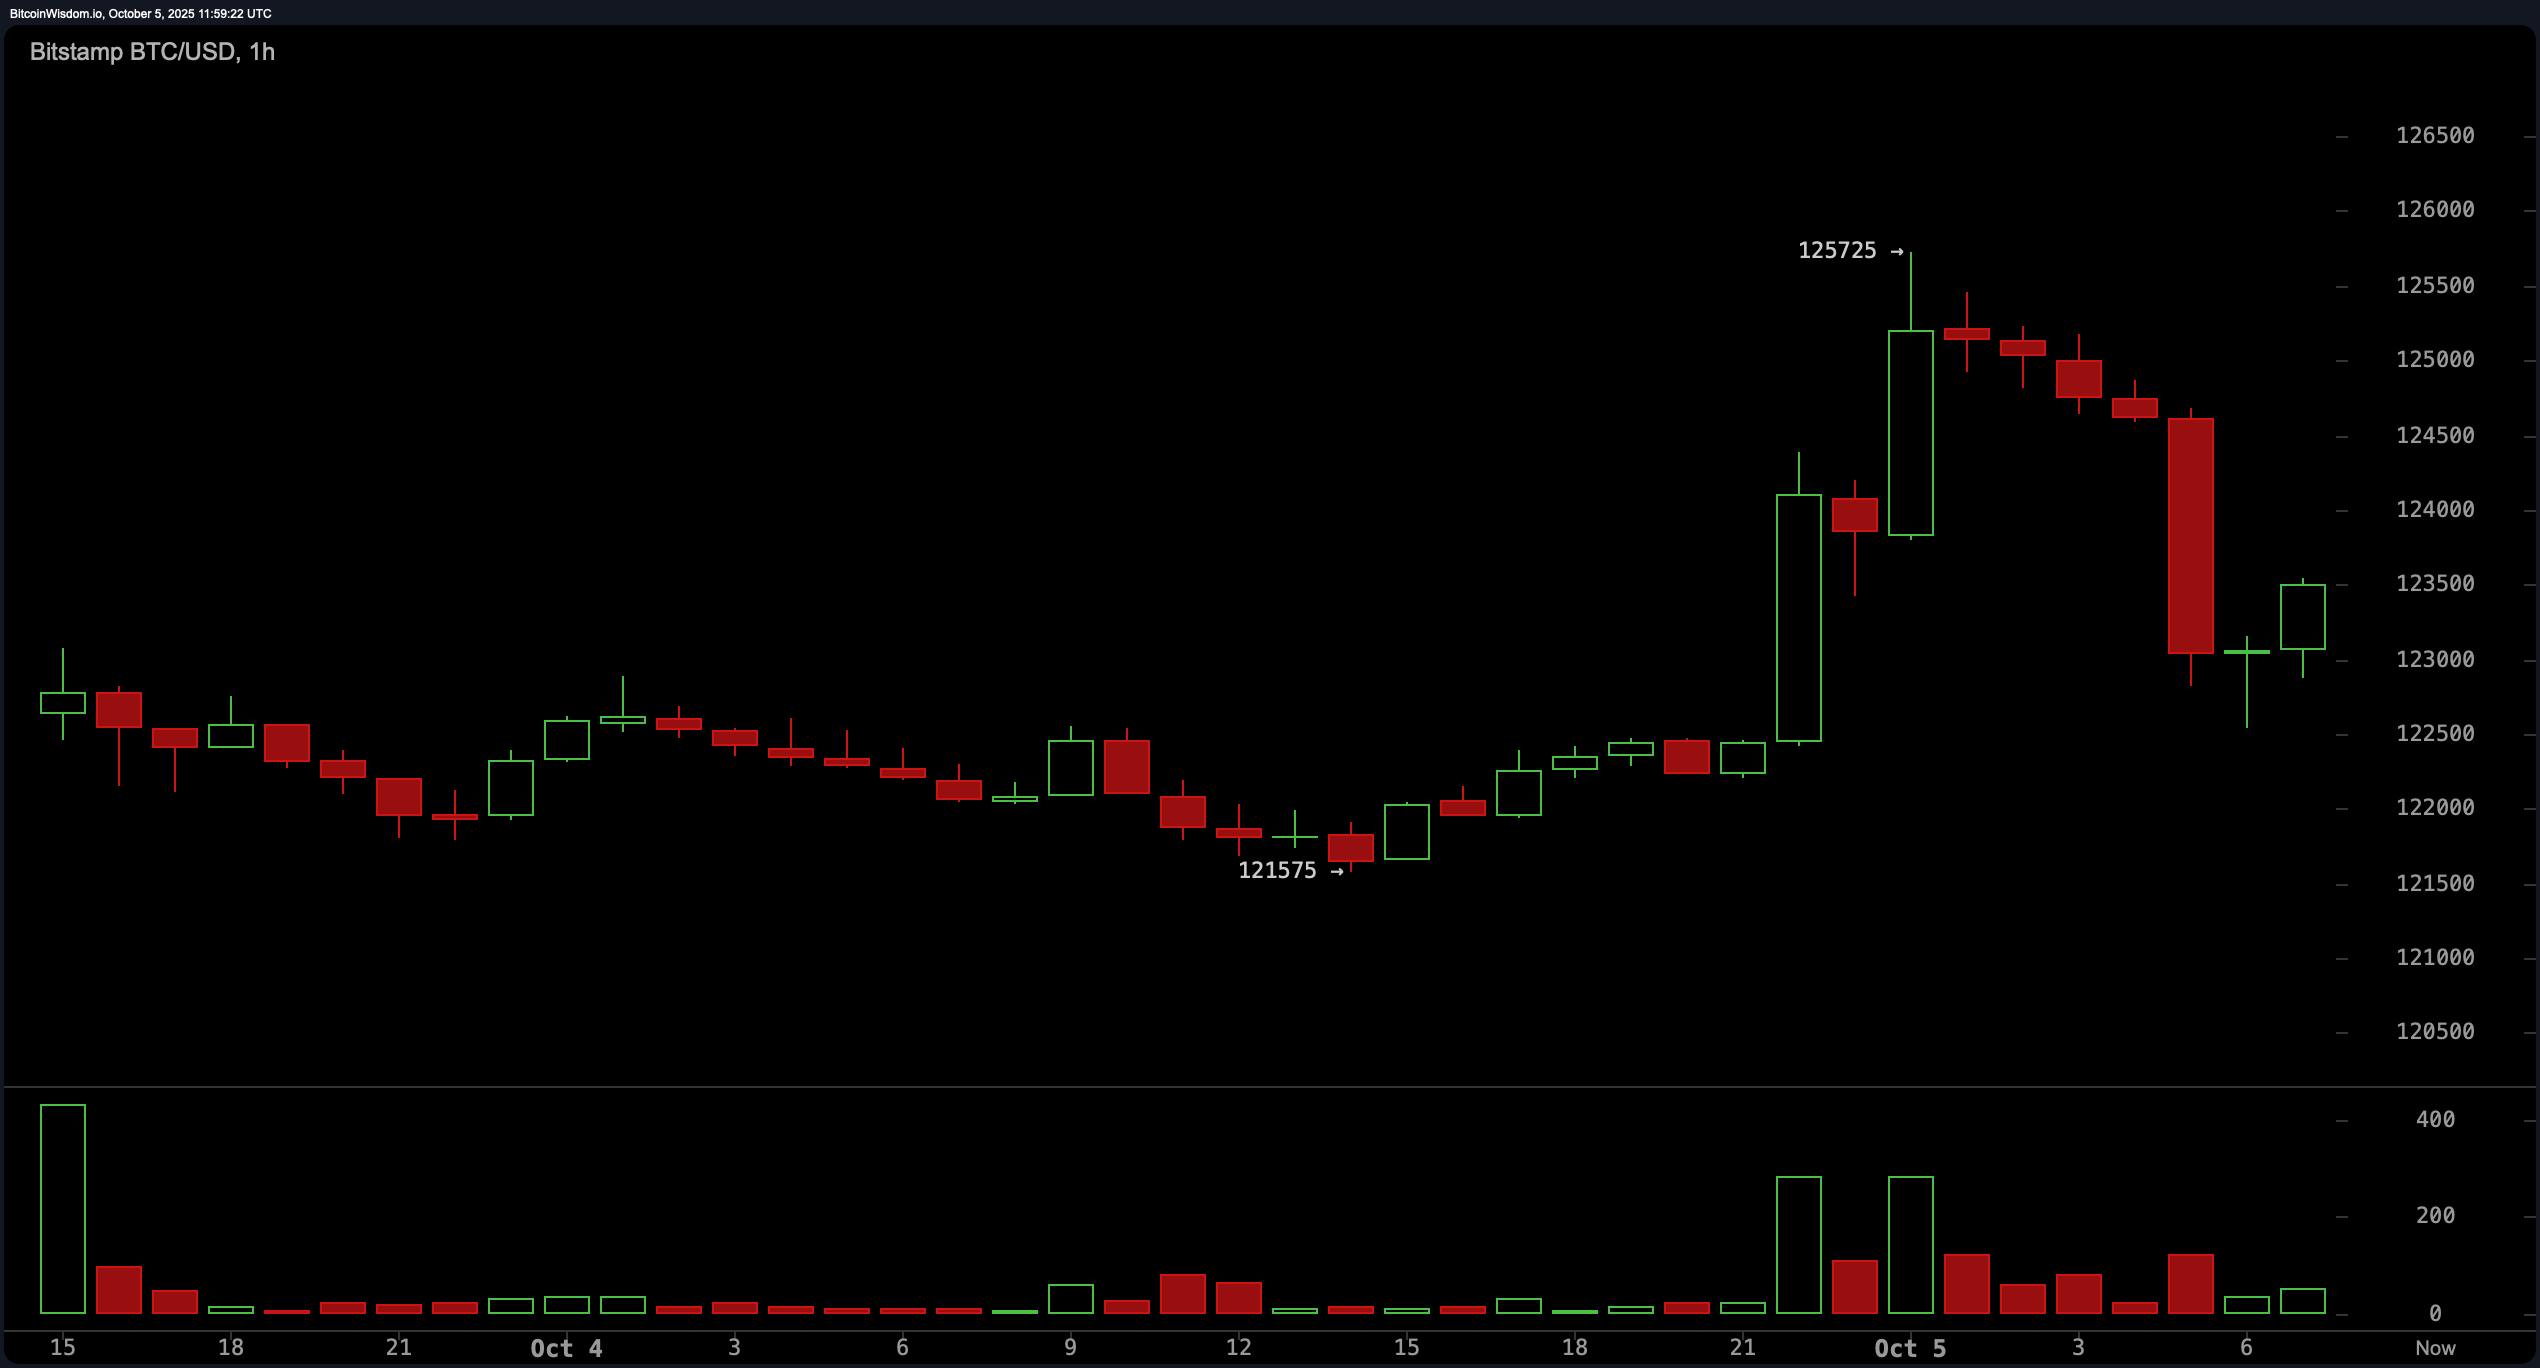
Zooming into the 1-hour chart, bearish signals take precedence. A local double top around $125,725 was followed by a swift decline to the $122,800 area, with the rebound toward $123,500 lacking sufficient volume or strength. The market may seek to retest the $122,000–$122,500 support zone, as a lack of follow-through suggests buyer hesitation. A bounce from this support, particularly if accompanied by increased volume, could present a favorable long entry. Alternatively, a clean break above $124,000 on strong momentum could reestablish bullish control.
Momentum oscillators paint a mixed picture. The relative strength index (RSI), Stochastic, and commodity channel index (CCI) all register neutral stances, despite elevated values, while the momentum oscillator at 14,514 and the moving average convergence divergence (MACD) level at 2,048 both indicate bullish values. This divergence highlights the potential for further gains, though with increased volatility. All key moving averages—including the 10, 20, 30, 50, 100, and 200-period exponential moving averages (EMA) and simple moving averages (SMA)—support continued upside, each flashing a positive signal and suggesting strong underlying trend strength.
Bitcoin remains in a broader bullish trend, but traders should proceed cautiously in the near term. Scalping opportunities exist near resistance levels around $125,000 with tight stop-losses above $125,800. Swing traders may look for entries near the $121,000–$122,000 area if bullish price action confirms. As always, disciplined risk management and confirmation through volume remain essential in navigating this high-volatility environment.
Bull Verdict:
Bitcoin’s multi-timeframe structure remains decisively bullish, supported by strong buy signals across all key moving averages and momentum indicators such as the momentum oscillator and moving average convergence divergence (MACD). As long as support holds above the $121,000 level, the current pullback appears to be a healthy consolidation within a broader uptrend, with potential for a breakout above $126,000 in the coming sessions.
Bear Verdict:
Despite bitcoin’s impressive rally, short-term price action reveals signs of exhaustion, including a double top on the 1-hour chart and declining volume on recent advances. If the price breaks below $122,000 with conviction, it may trigger a broader correction toward lower support zones, invalidating the current uptrend and putting the recent gains at risk.