Bitcoin’s rejection from the $125K liquidity pocket has initiated a healthy pullback toward the $120K region. The move appears corrective rather than impulsive, with strong confluence support aligning around the 100-day moving average and the prior breakout structure.
Technical Analysis
By Shayan
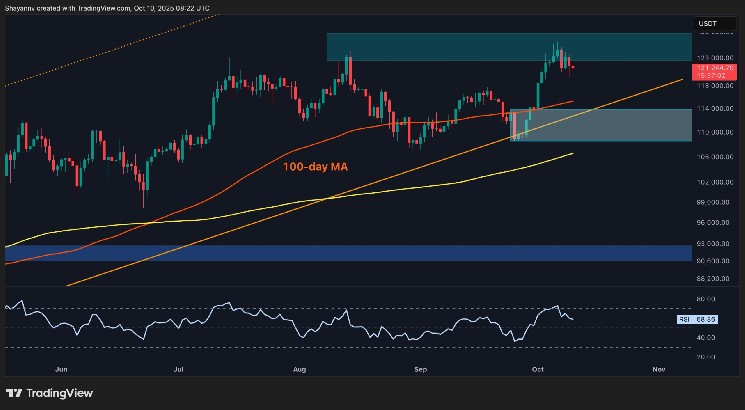
The Daily Chart
On the daily timeframe, BTC was rejected from the $125K–$126K liquidity zone, which coincides with the prior swing high and a key resistance cluster. The reaction has led to a retracement toward the $117K–$120K support range, an area reinforced by the intersection of the ascending trendline, the 100-day MA, and key Fibonacci retracement levels.
A rebound from this region could validate it as a higher low, setting the stage for renewed bullish continuation. Meanwhile, the RSI has cooled off from overbought territory, suggesting that momentum has reset and the market now has room to stabilize before attempting another run-up. However, a daily close below $117K would weaken this structure and open the door for a deeper correction toward $108K, where the next demand zone and prior consolidation base align.
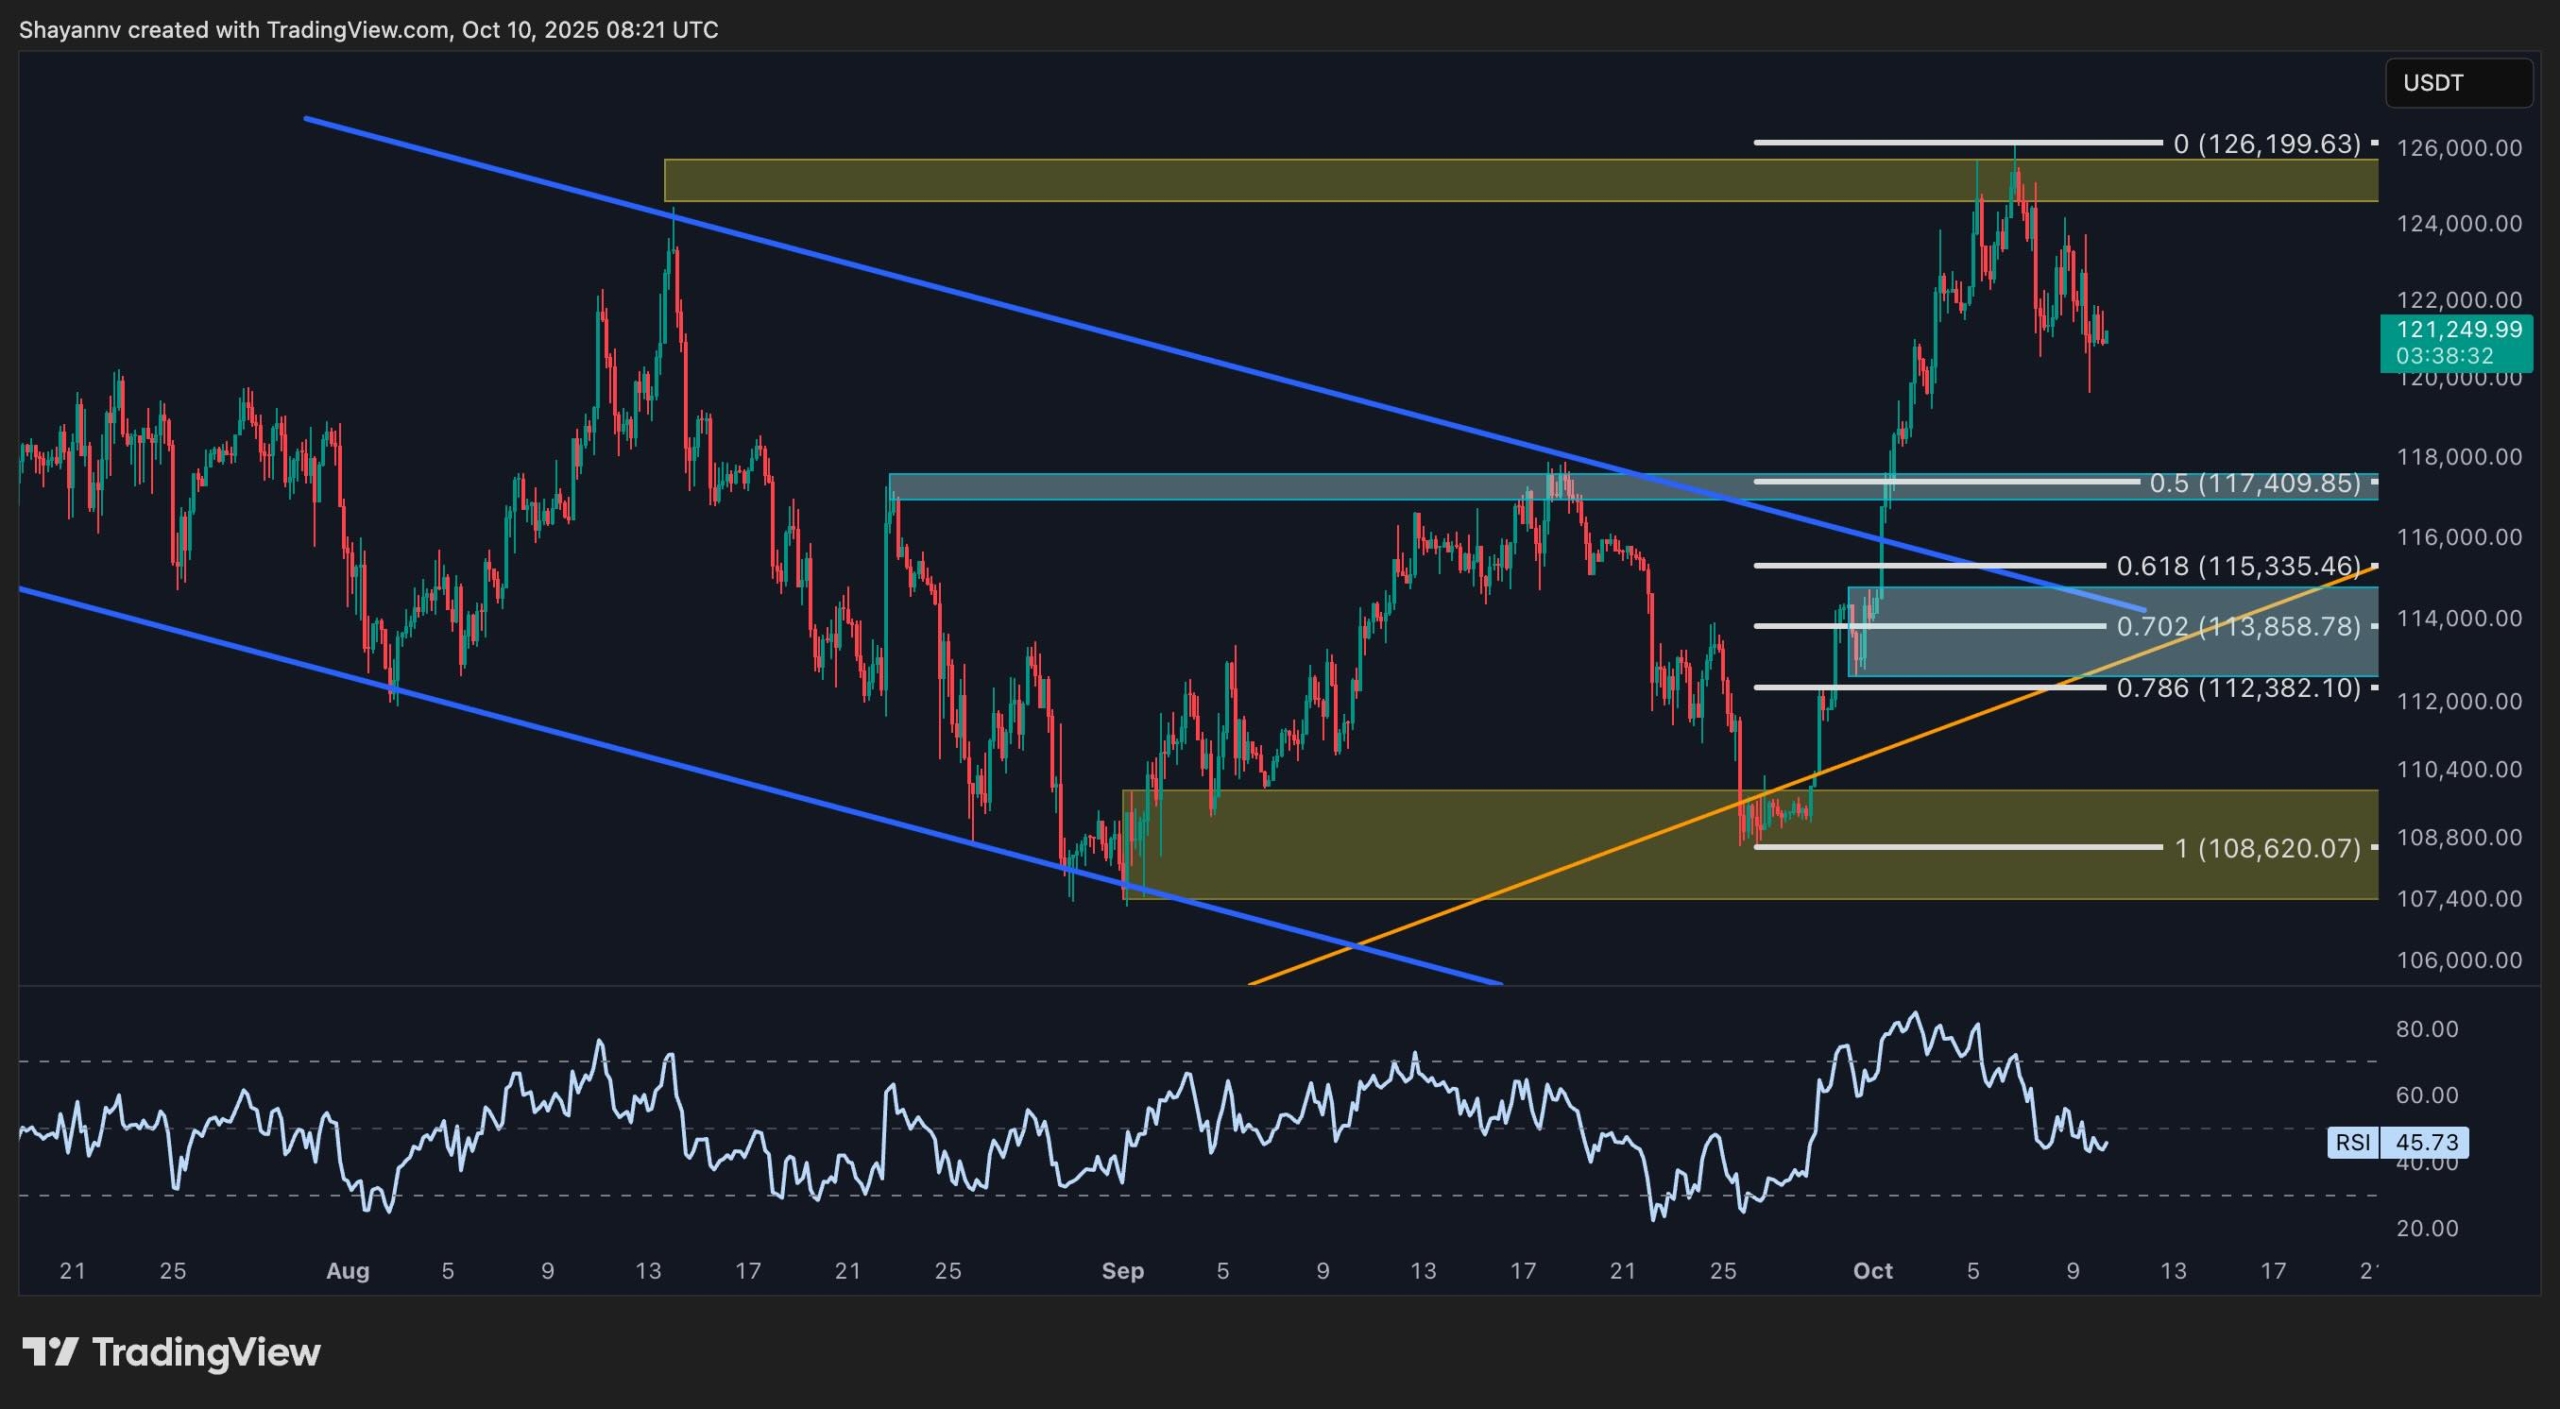
The 4-Hour Chart
On the 4-hour chart, Bitcoin’s short-term structure reveals clear signs of momentum loss following the breakout above the previous all-time high. After breaching $125K, the market printed a Three Drives pattern, characterized by three consecutive highs with diminishing strength, a classic signal of buyer exhaustion.
The correction that followed has produced a healthy retracement, with the $115K–$117K range emerging as the key support area. This zone overlaps with important Fibonacci retracement levels, the lower boundary of the breakout range, and the short-term demand block, forming a critical confluence of technical support. A strong bullish reaction from this zone could attract fresh buying interest and pave the way for another attempt toward $123K–$125K.
Conversely, failure to hold this area would confirm a shift in short-term momentum, likely exposing the lower liquidity pools near $108K, where Bitcoin previously consolidated before its breakout.
Sentiment Analysis
By Shayan
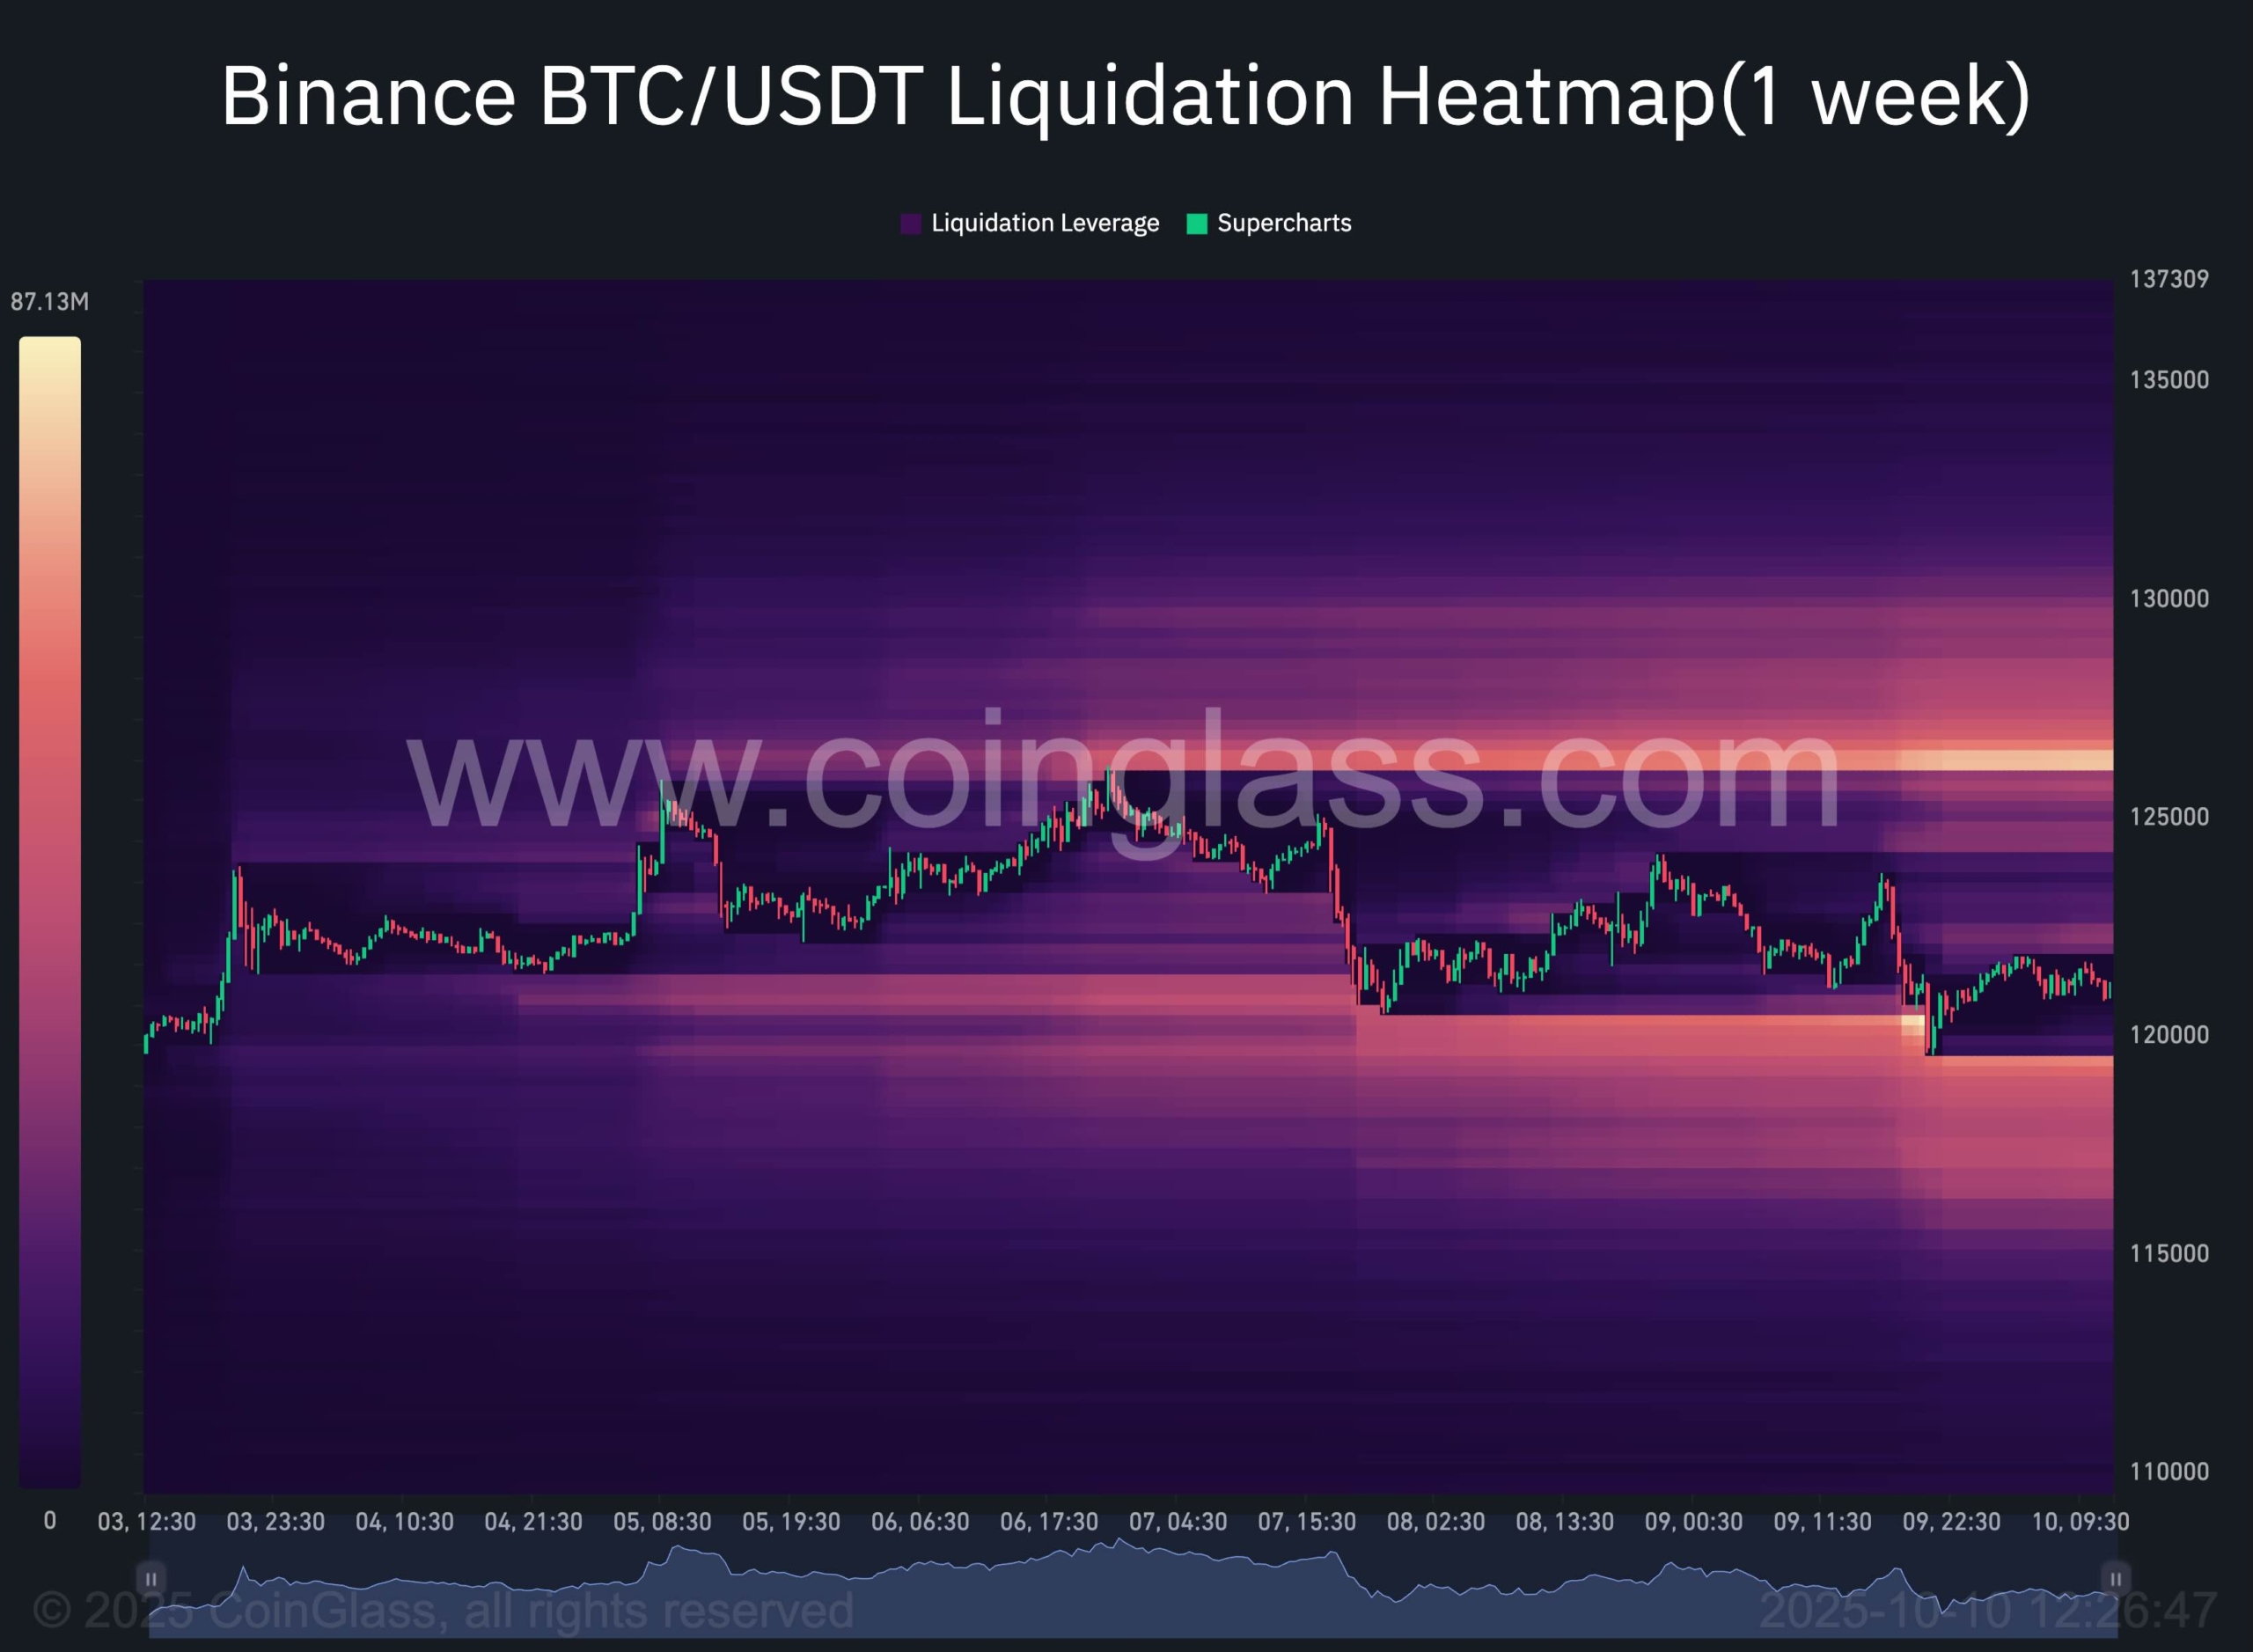
The 1-week Binance liquidation heatmap provides clear insight into the dynamics behind Bitcoin’s recent rejection and current pullback. A dense concentration of liquidity clusters between $124K and $126K coincides exactly with the region that triggered the latest rejection, confirming that a substantial number of leveraged short positions were opened as the price entered this upper band. The unwinding of these positions fueled the sharp reaction that followed.
Below the current price, new liquidity pockets have formed around $118K–$120K, indicating zones where over-leveraged long positions are likely to face liquidations if the price dips further. This area could act as a magnet for short-term price movement, pulling BTC into these thresholds before demand reemerges.
Interestingly, the heatmap also shows significant liquidity concentrations above $126K, extending toward $130K–$132K. This cluster remains a major target for institutional and algorithmic players (“smart money”), suggesting that once the $126K resistance is reclaimed and cleared, Bitcoin could accelerate rapidly toward the next liquidity band.
For now, the on-chain landscape supports a short-term consolidation bias, as the market digests the recent liquidation wave and awaits renewed directional momentum. Once the local demand zones stabilize and leverage resets, Bitcoin could be primed for another upward leg toward the liquidity-rich $130K region.