Bitcoin failed to continue its rally and discover new all-time highs above $126,000, leading to a sharp correction that has unsettled the market. Investors are showing signs of fear as the recent drop invalidated the breakout momentum that many expected to extend the bull run, and the market might be on the verge of a bearish shift.
By Shayan
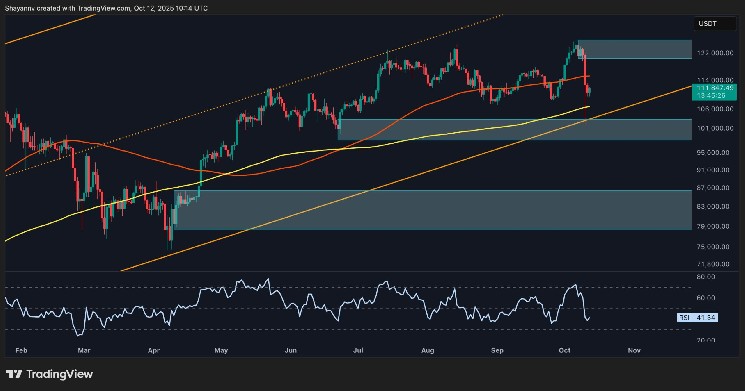
The Daily Chart
On the daily timeframe, BTC failed to continue beyond $126K and has fallen sharply to the $100K area, before rebounding quickly. The rejection from the ATH zone, combined with the breakdown below the 100-day moving average, signals a loss of bullish momentum.
The next major support sits around the $100K range, which also aligns with the trendline support and the 200-day moving average. The RSI near 41 suggests that while the market is cooling off, there’s still room for further downside if buyers don’t step in soon.
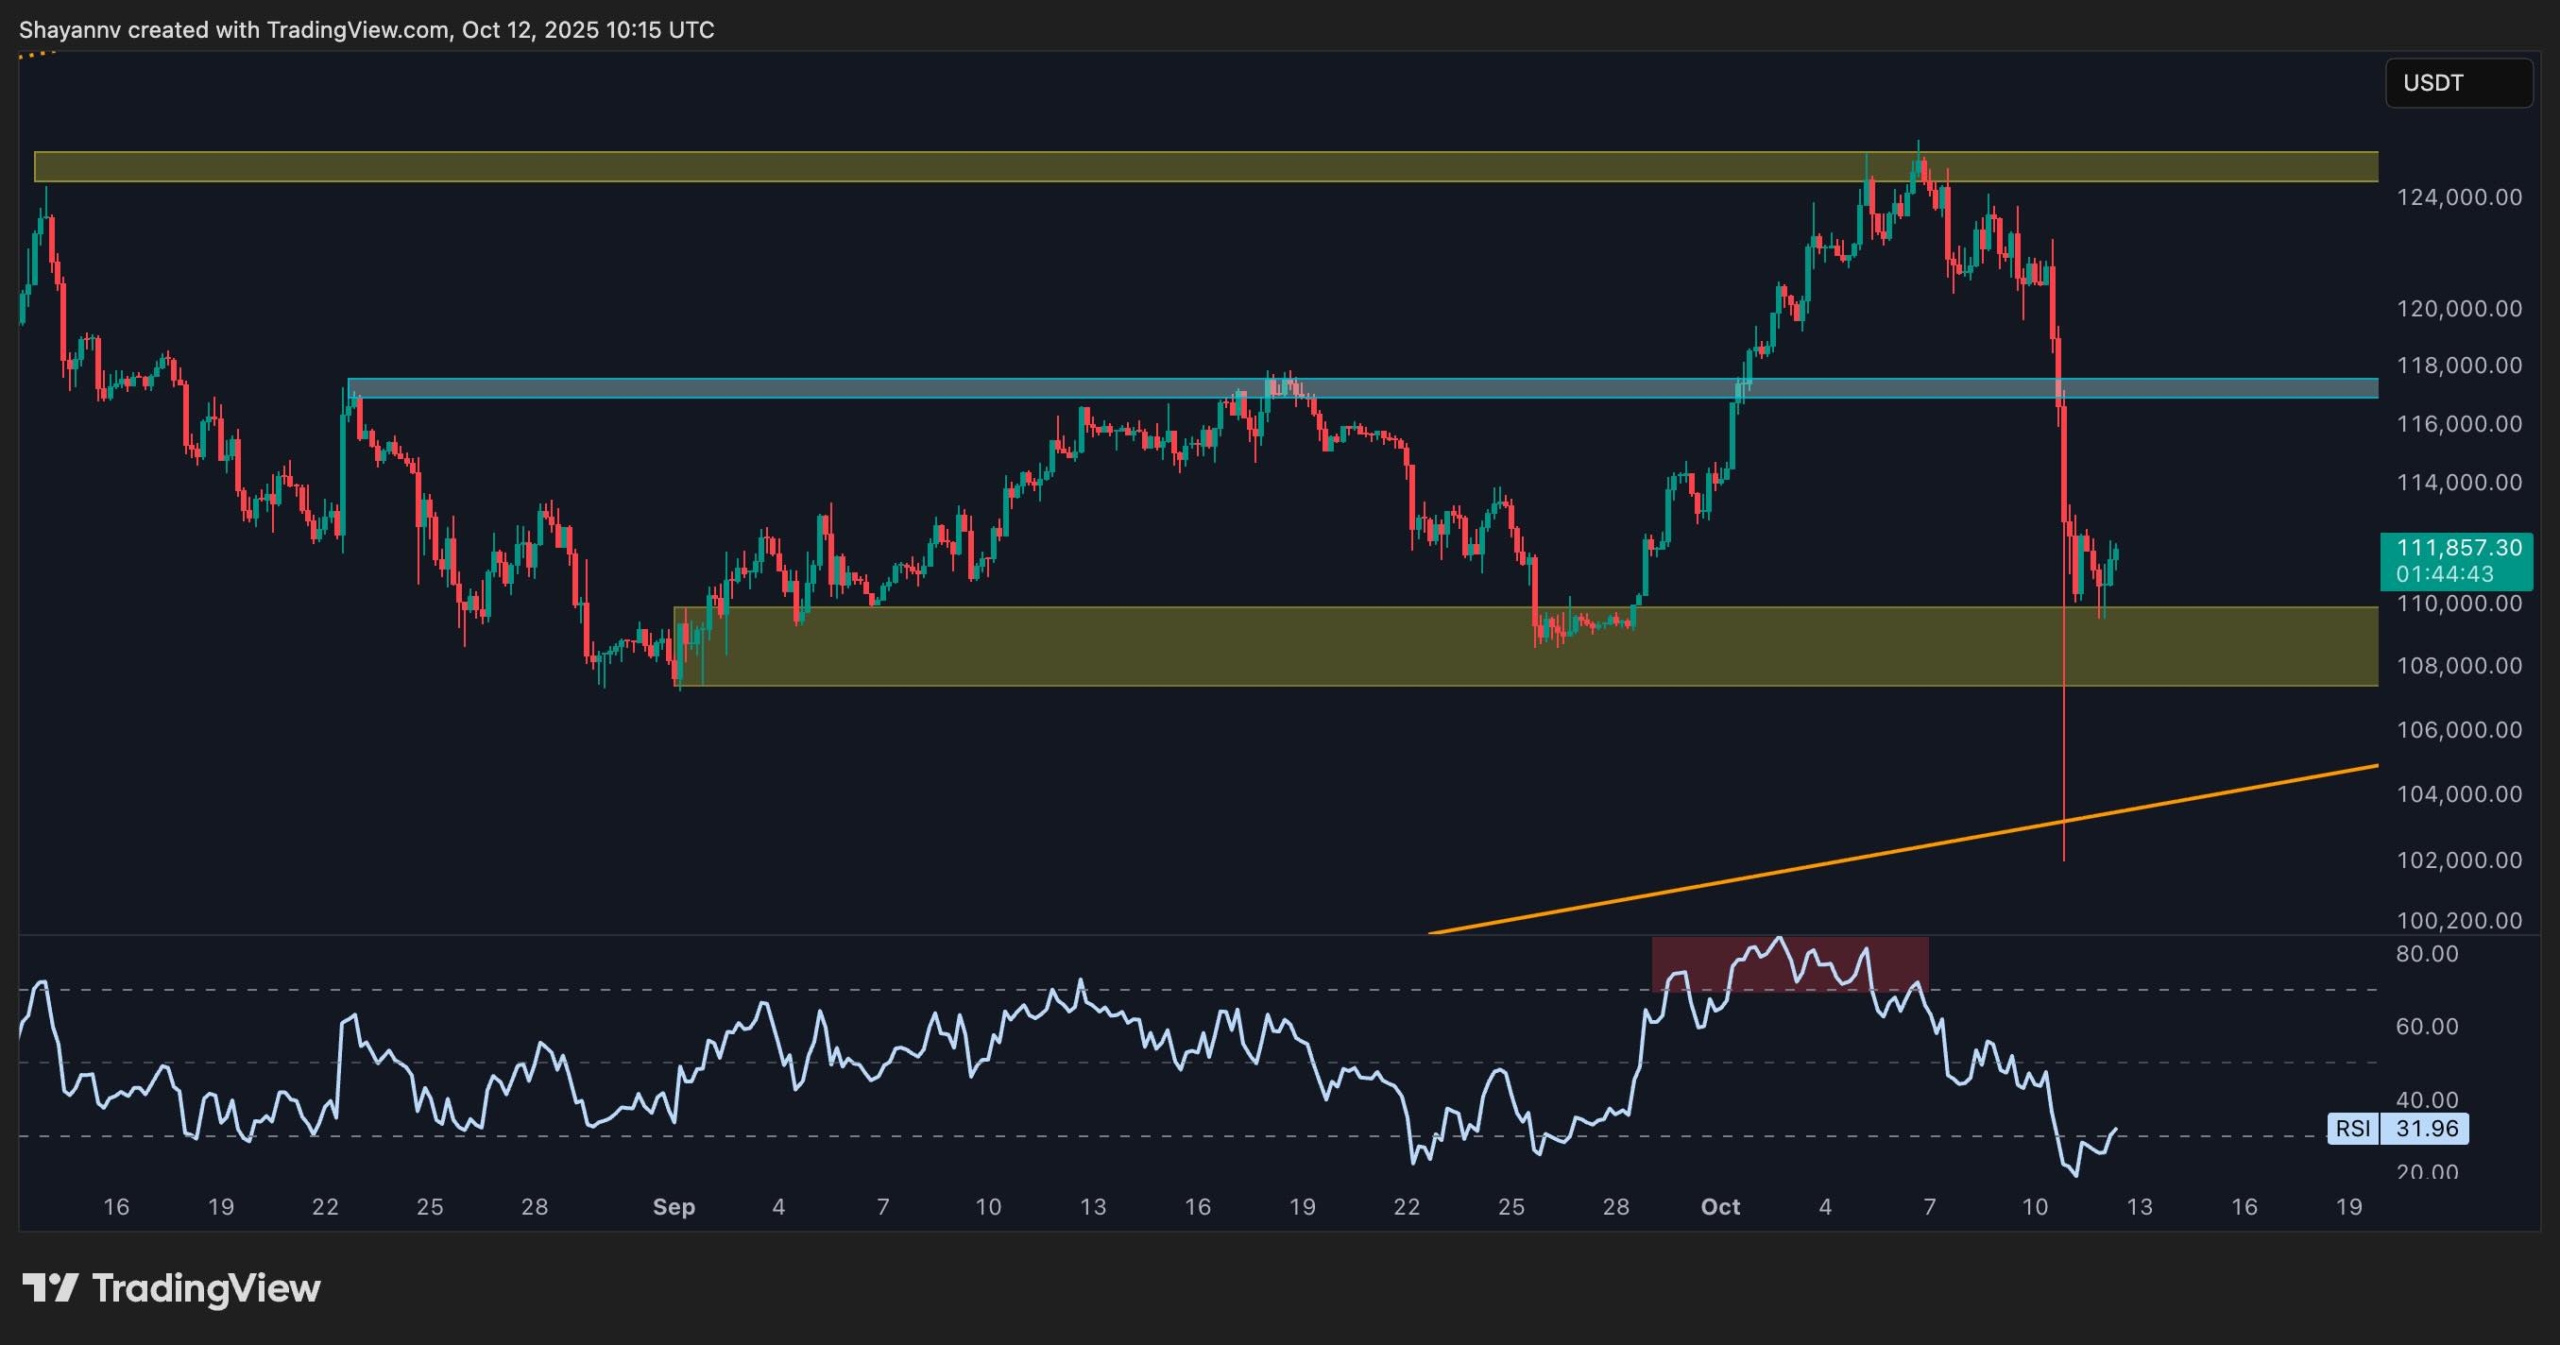
The 4-Hour Chart
The 4-hour chart shows that BTC found temporary support around the $110K zone after the intense sell-off. This area previously served as an accumulation zone before the last leg up, making it a critical short-term level.
The RSI remains weak around 32, showing limited strength from buyers. Immediate resistance lies around $117K, where previous support flipped into resistance. A rejection from this zone could trigger another leg down, possibly toward the $105k region, which aligns with the lower boundary of the large ascending channel. A breakdown of this channel would likely end the bull market, and Bitcoin would enter a long-term downtrend alongside the whole crypto market.
Sentiment Analysis
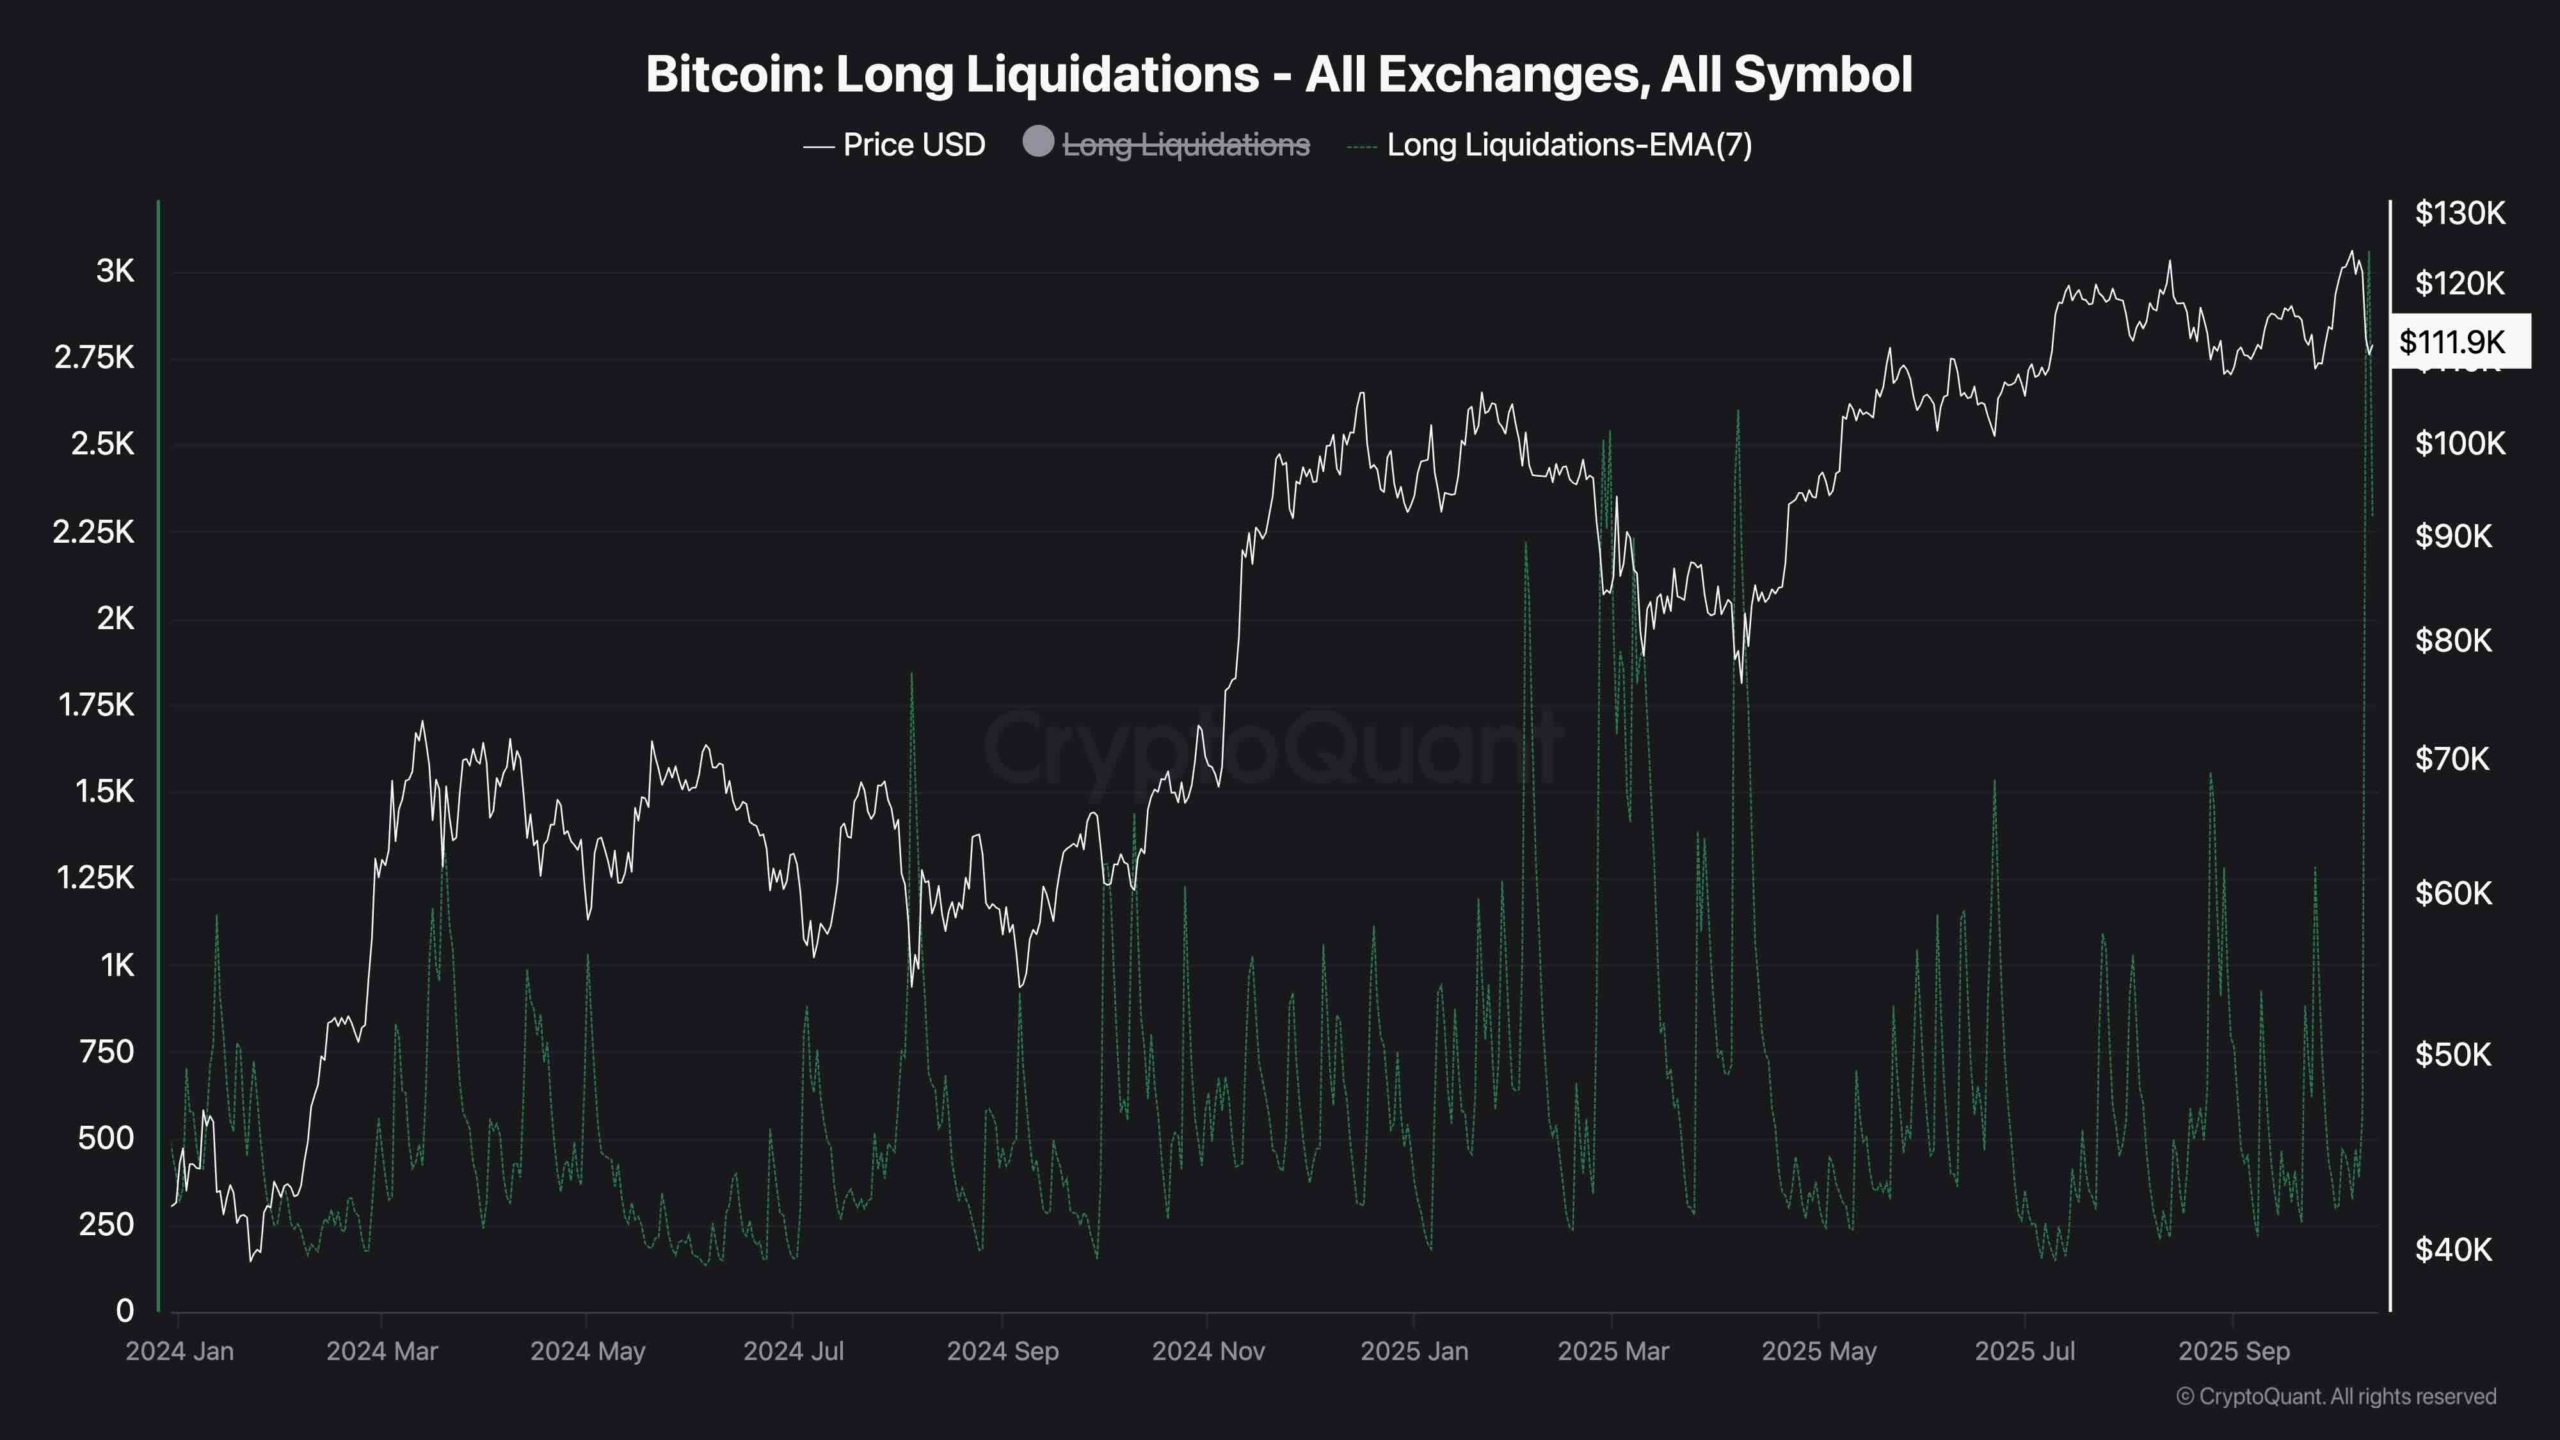
Long Liquidations (7-day MA)
The liquidation chart highlights a massive spike in long liquidations, the largest one ever, coinciding with Bitcoin’s failure to set a new high. This cascade has forced overleveraged traders out of the market and significantly reduced open interest.
Historically, such liquidation flushes often mark short-term bottoms, but given the fragile sentiment, investors remain hesitant to re-enter aggressively. The market’s fear-driven tone suggests that while a relief bounce is possible, confidence in the uptrend has clearly weakened. This could be the beginning of the end for this cycle’s bullish market, especially if the price closes below $100K.