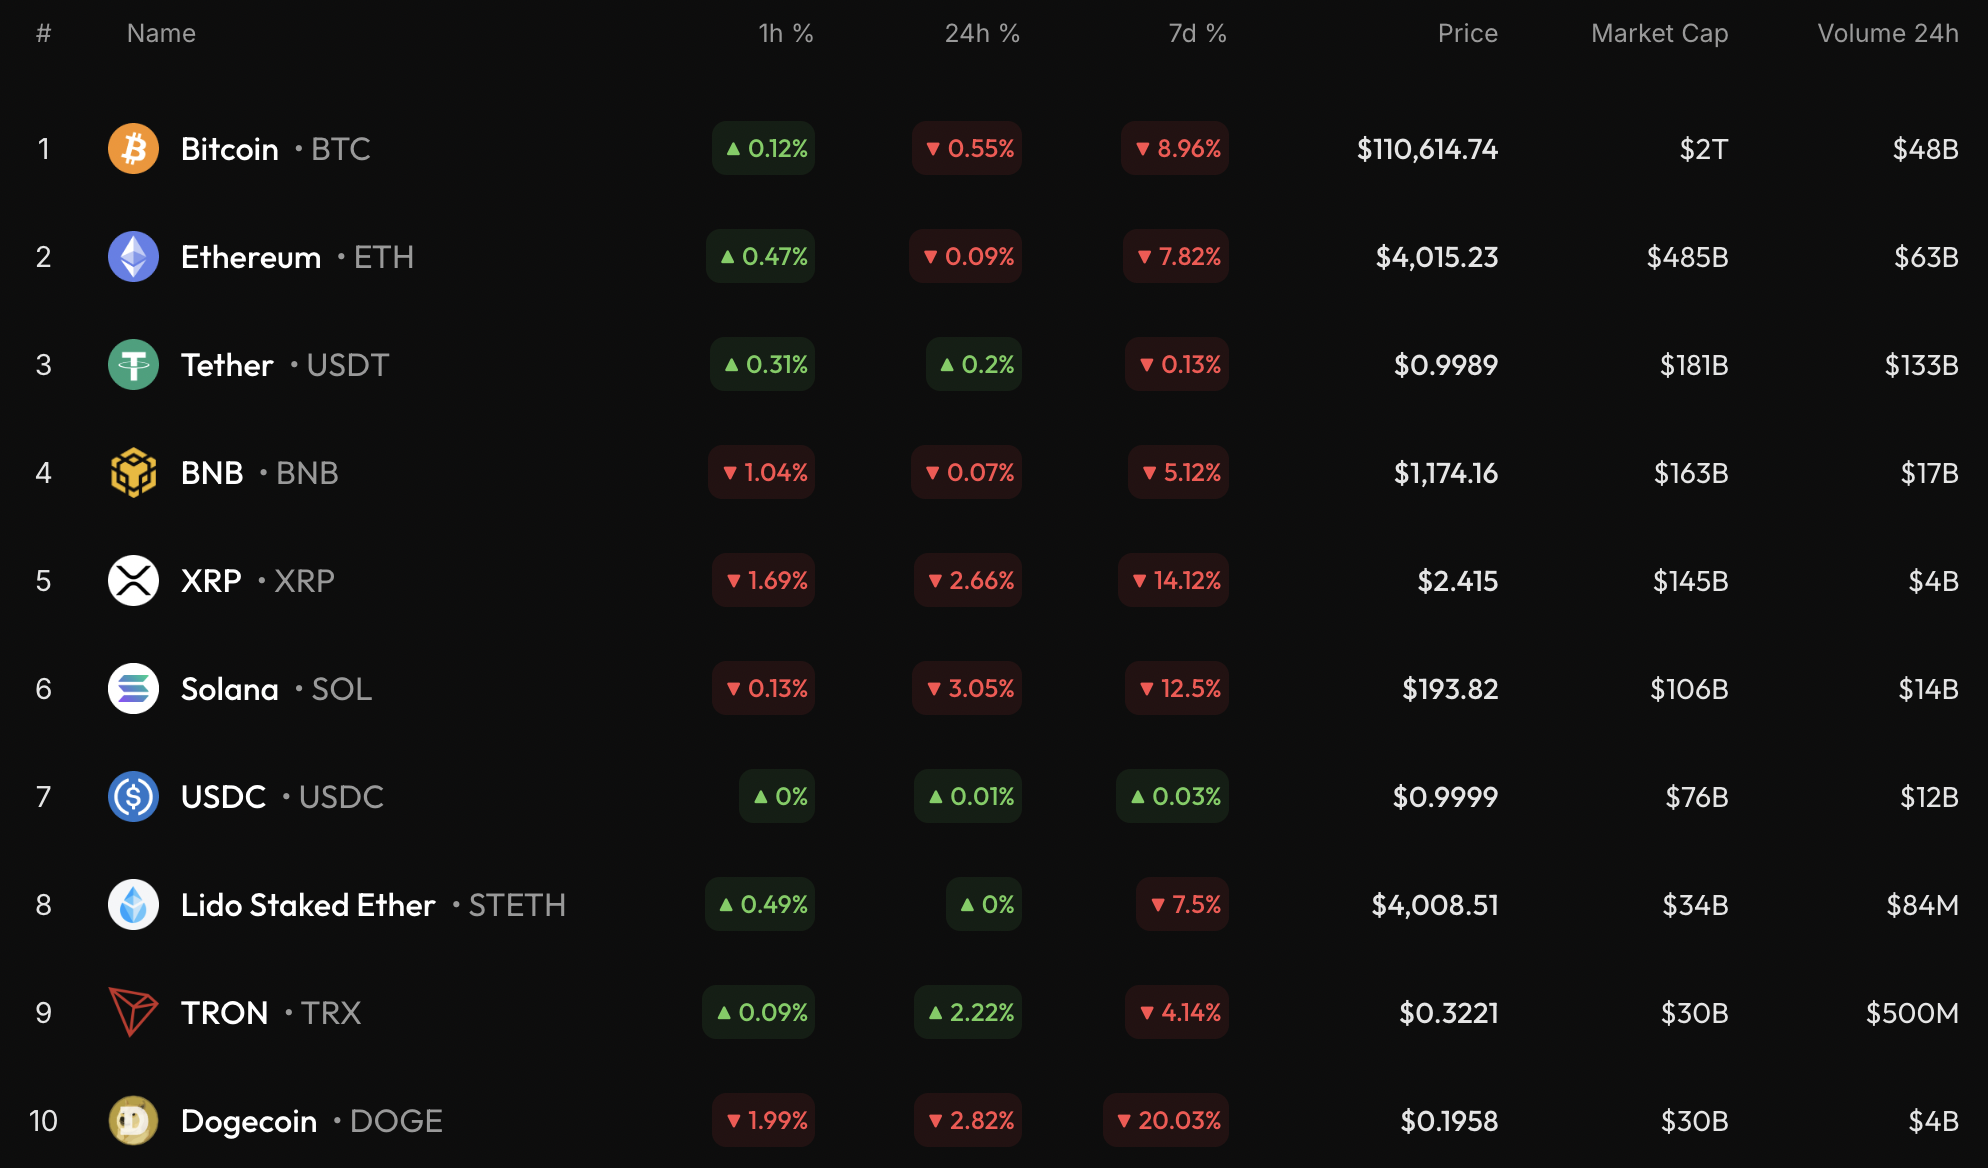
The prices of most of the coins are going down, however, there are some exceptions to the rule, according to CoinStats.
BTC/USD
The rate of Bitcoin (BTC) has fallen by 0.55% since yesterday.
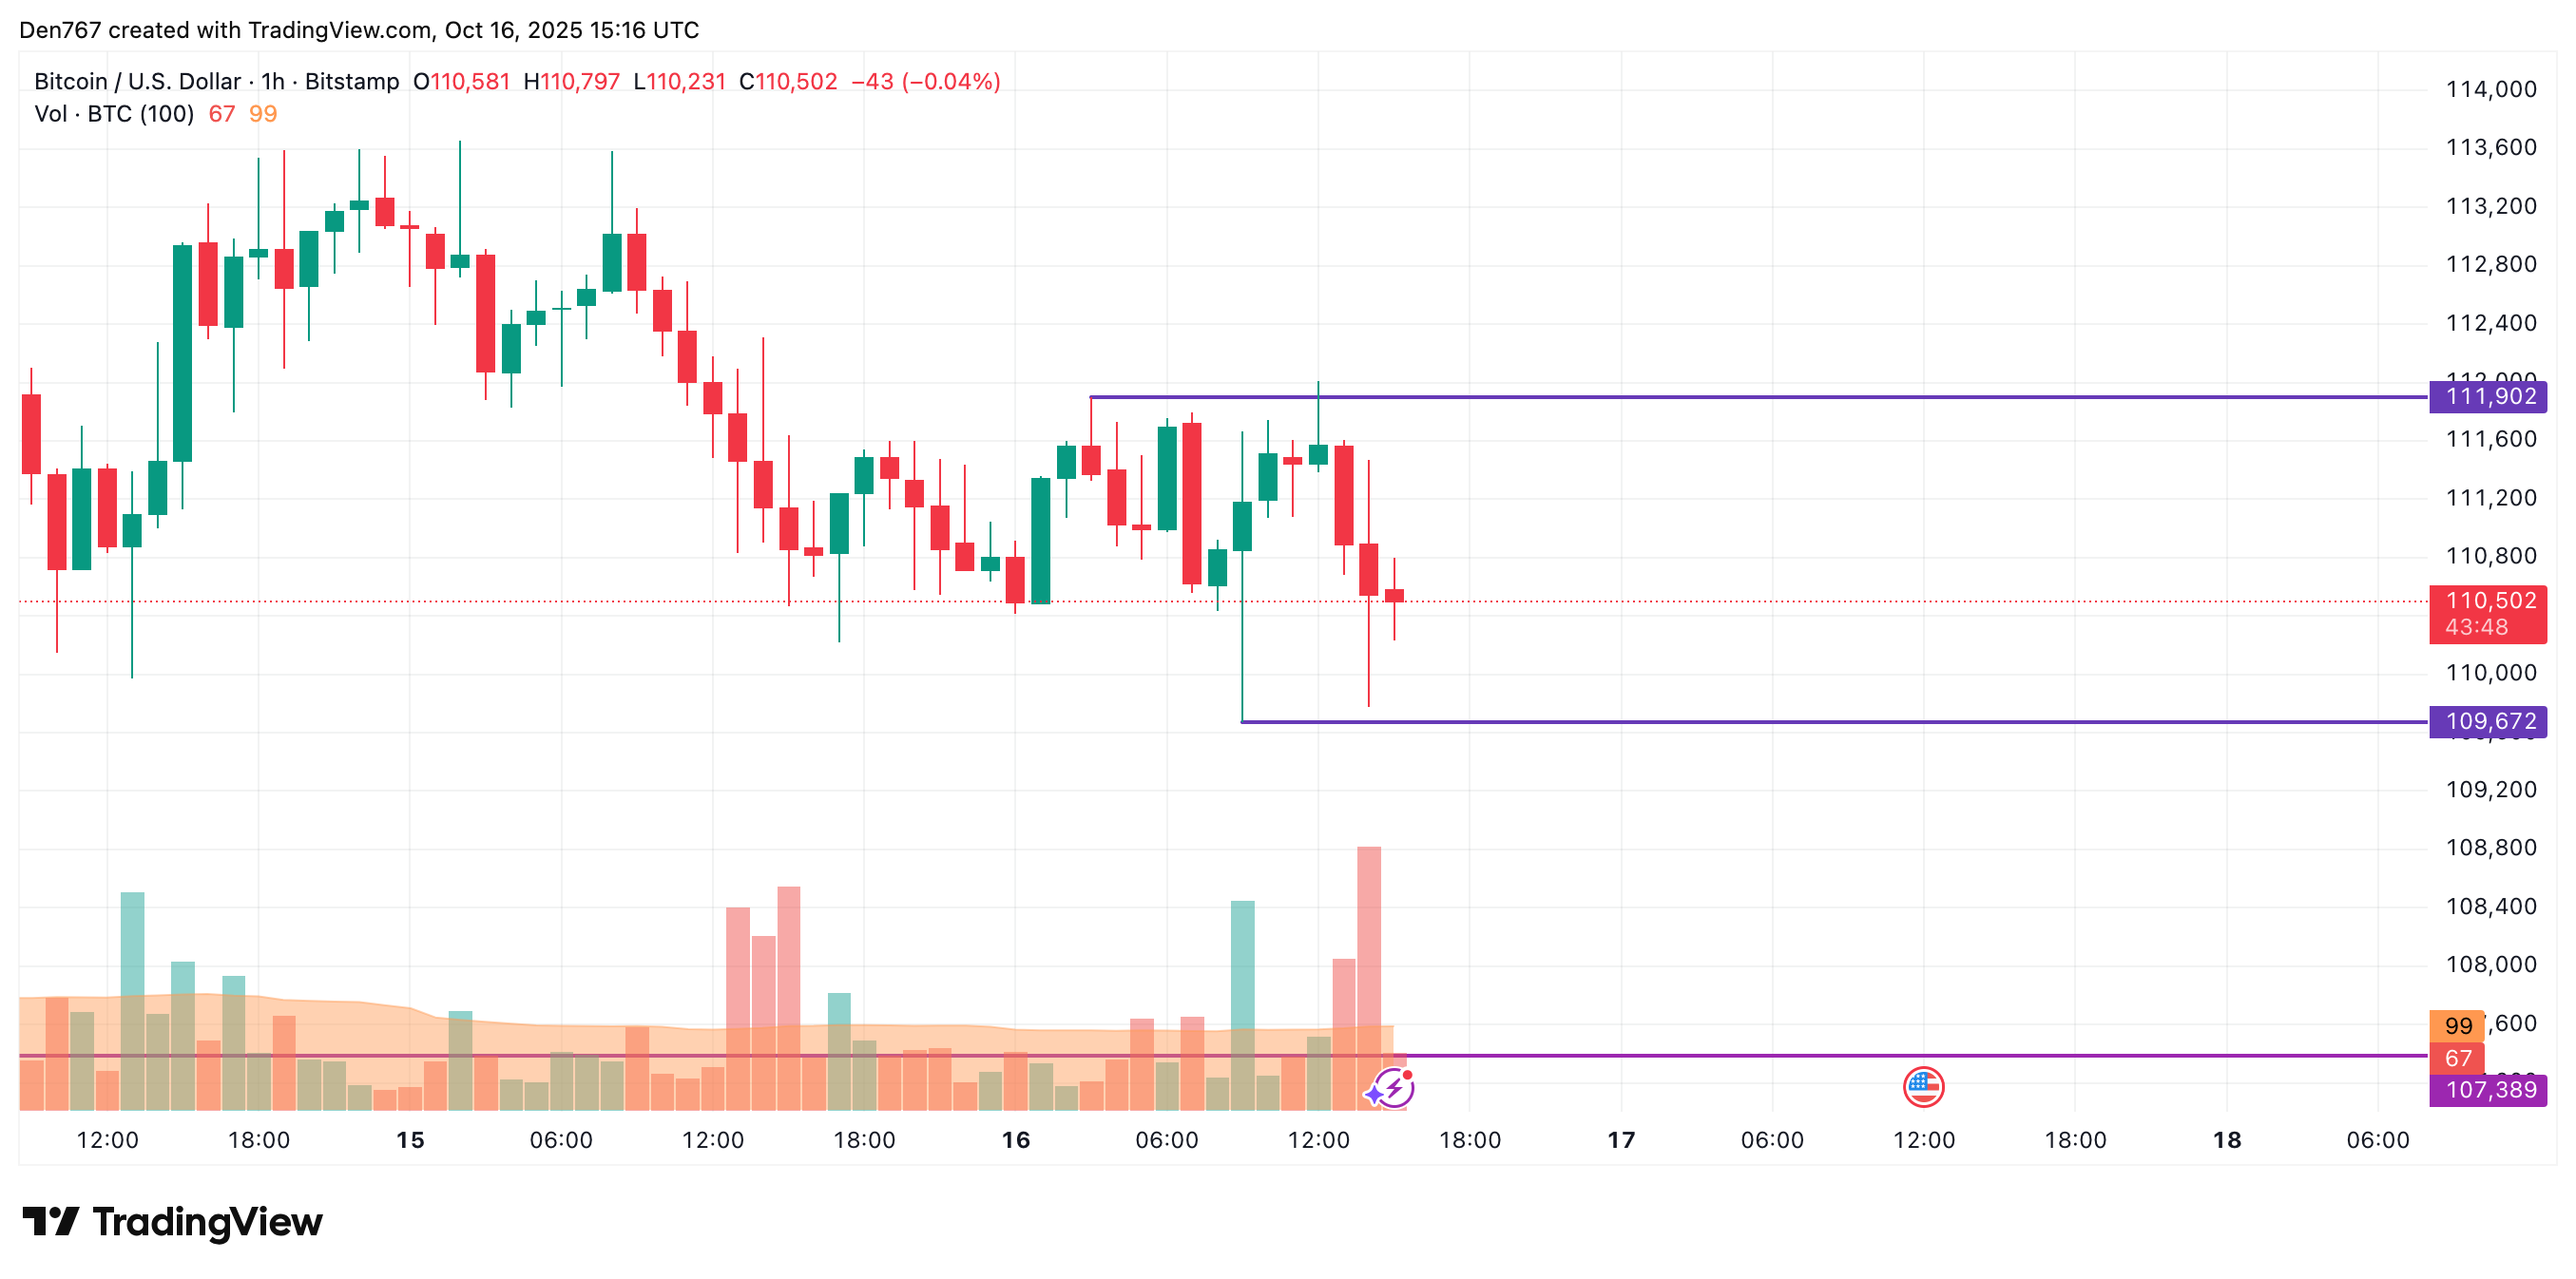
On the hourly chart, the price of BTC is going down after a false breakout of the local resistance of $111,902. If the situation does not change by the end of the day, one can expect a further correction to the $109,000 mark.
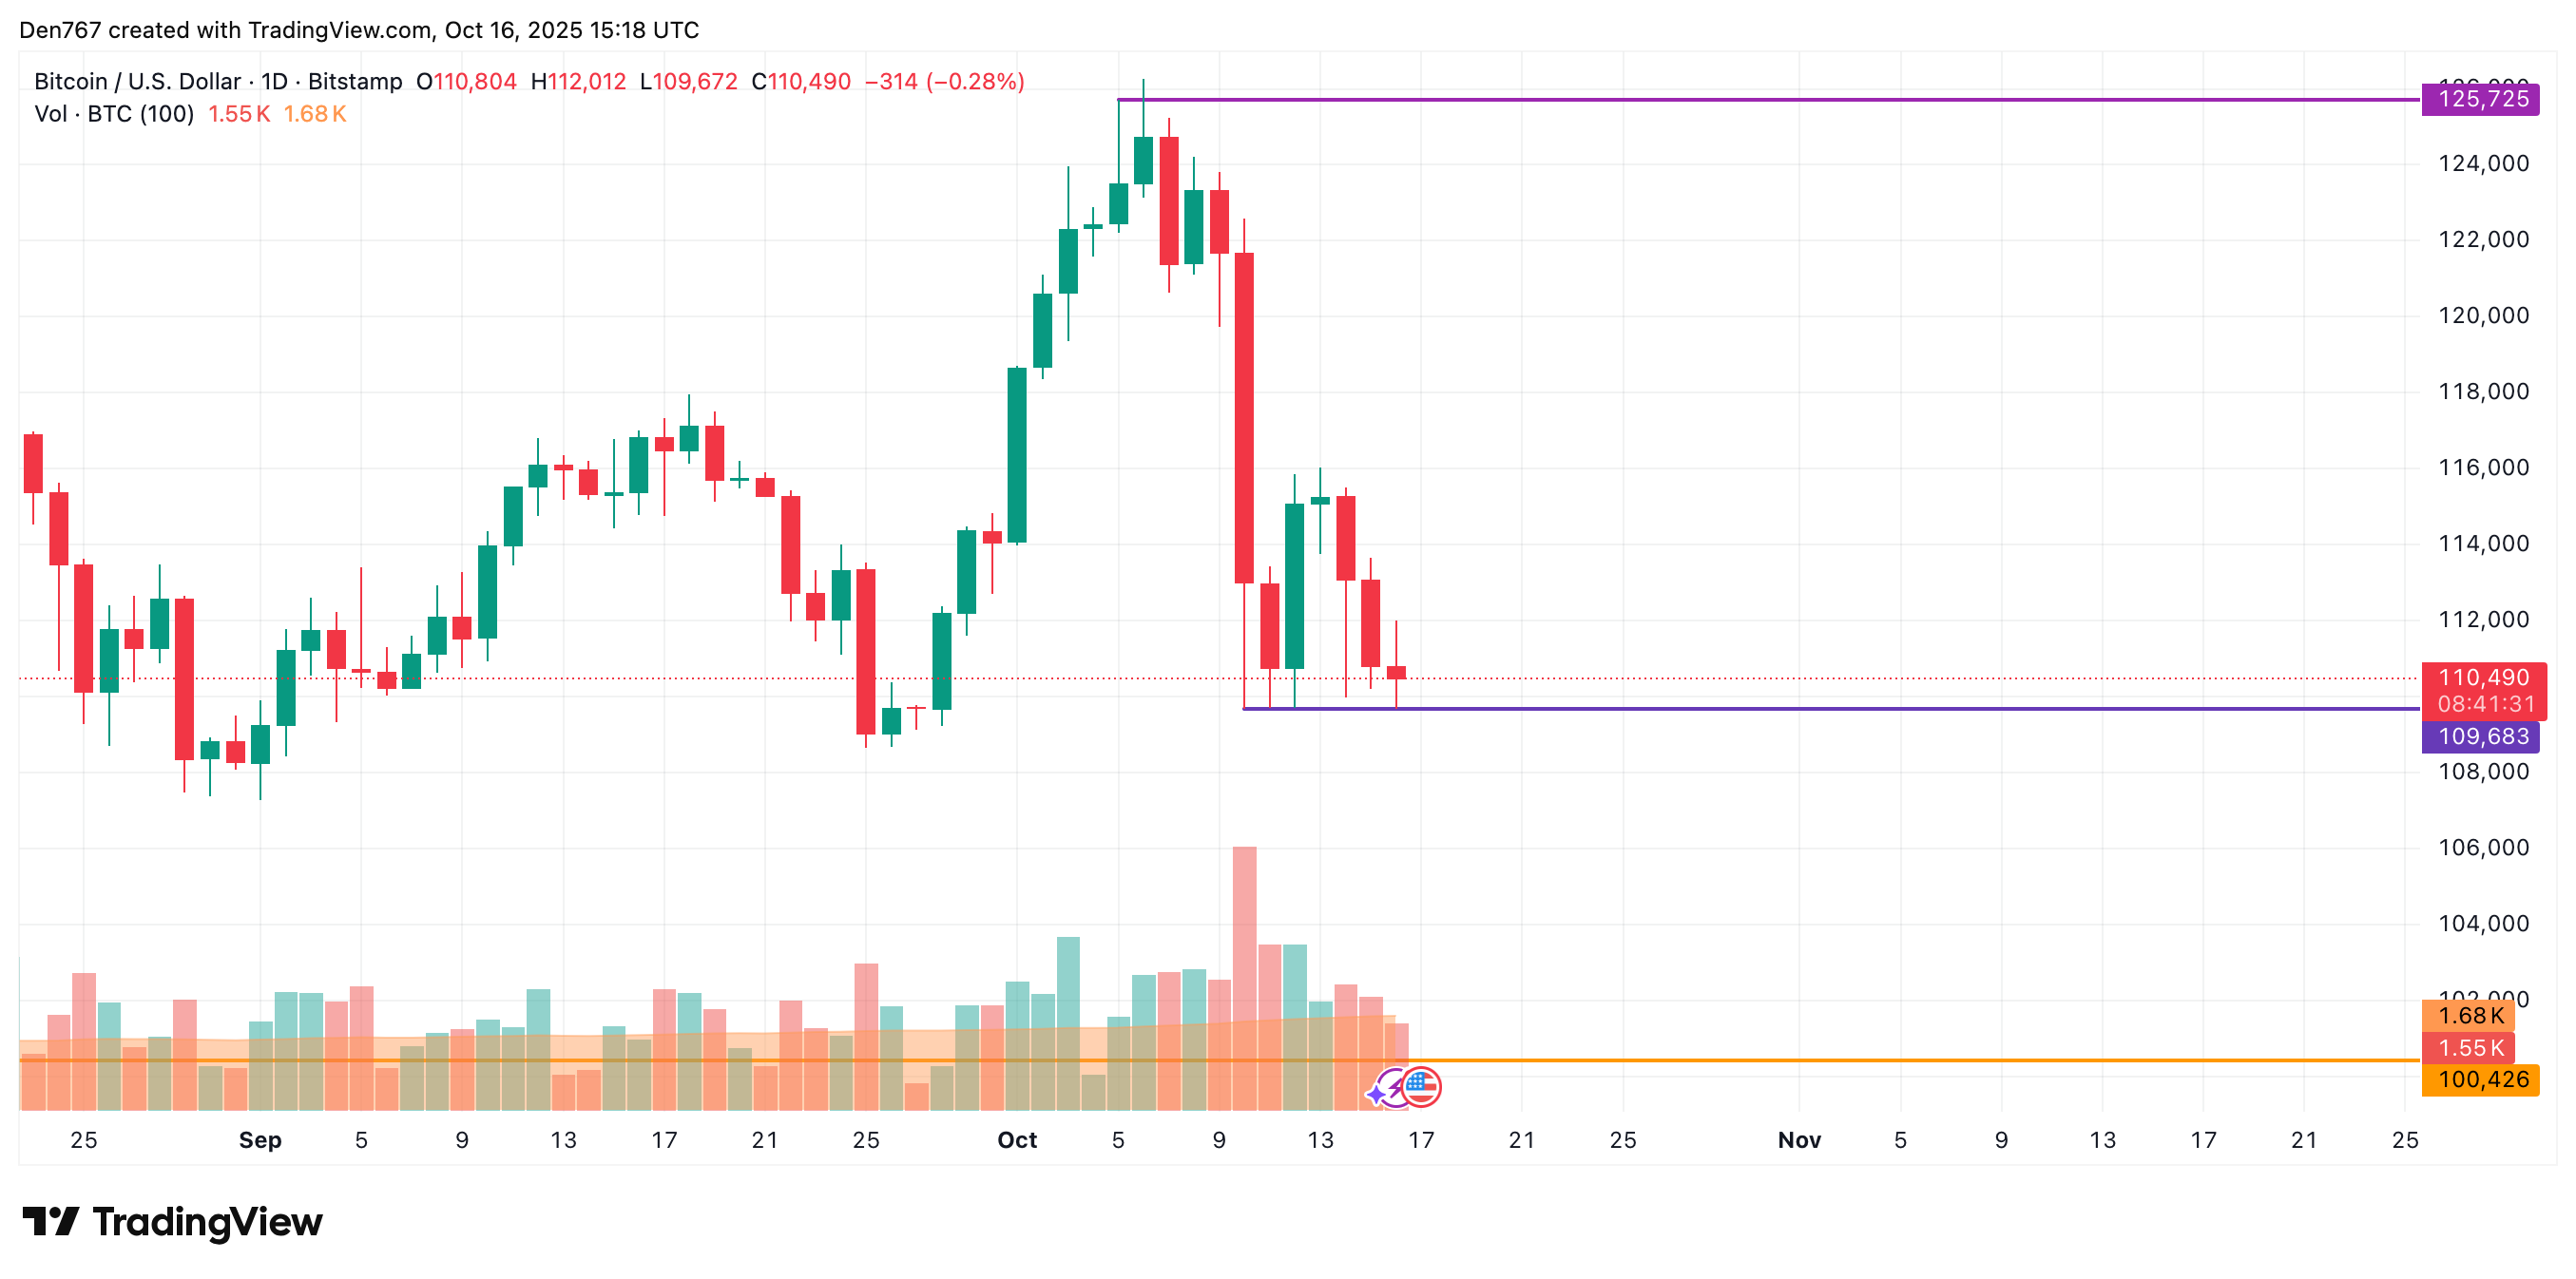
On the longer time frame, the rate of the chief crypto has tested the support of $109,683.
If the daily candle closes near that mark or below it, the accumulated energy might be enough for a test of the $108,000-$109,000 range.
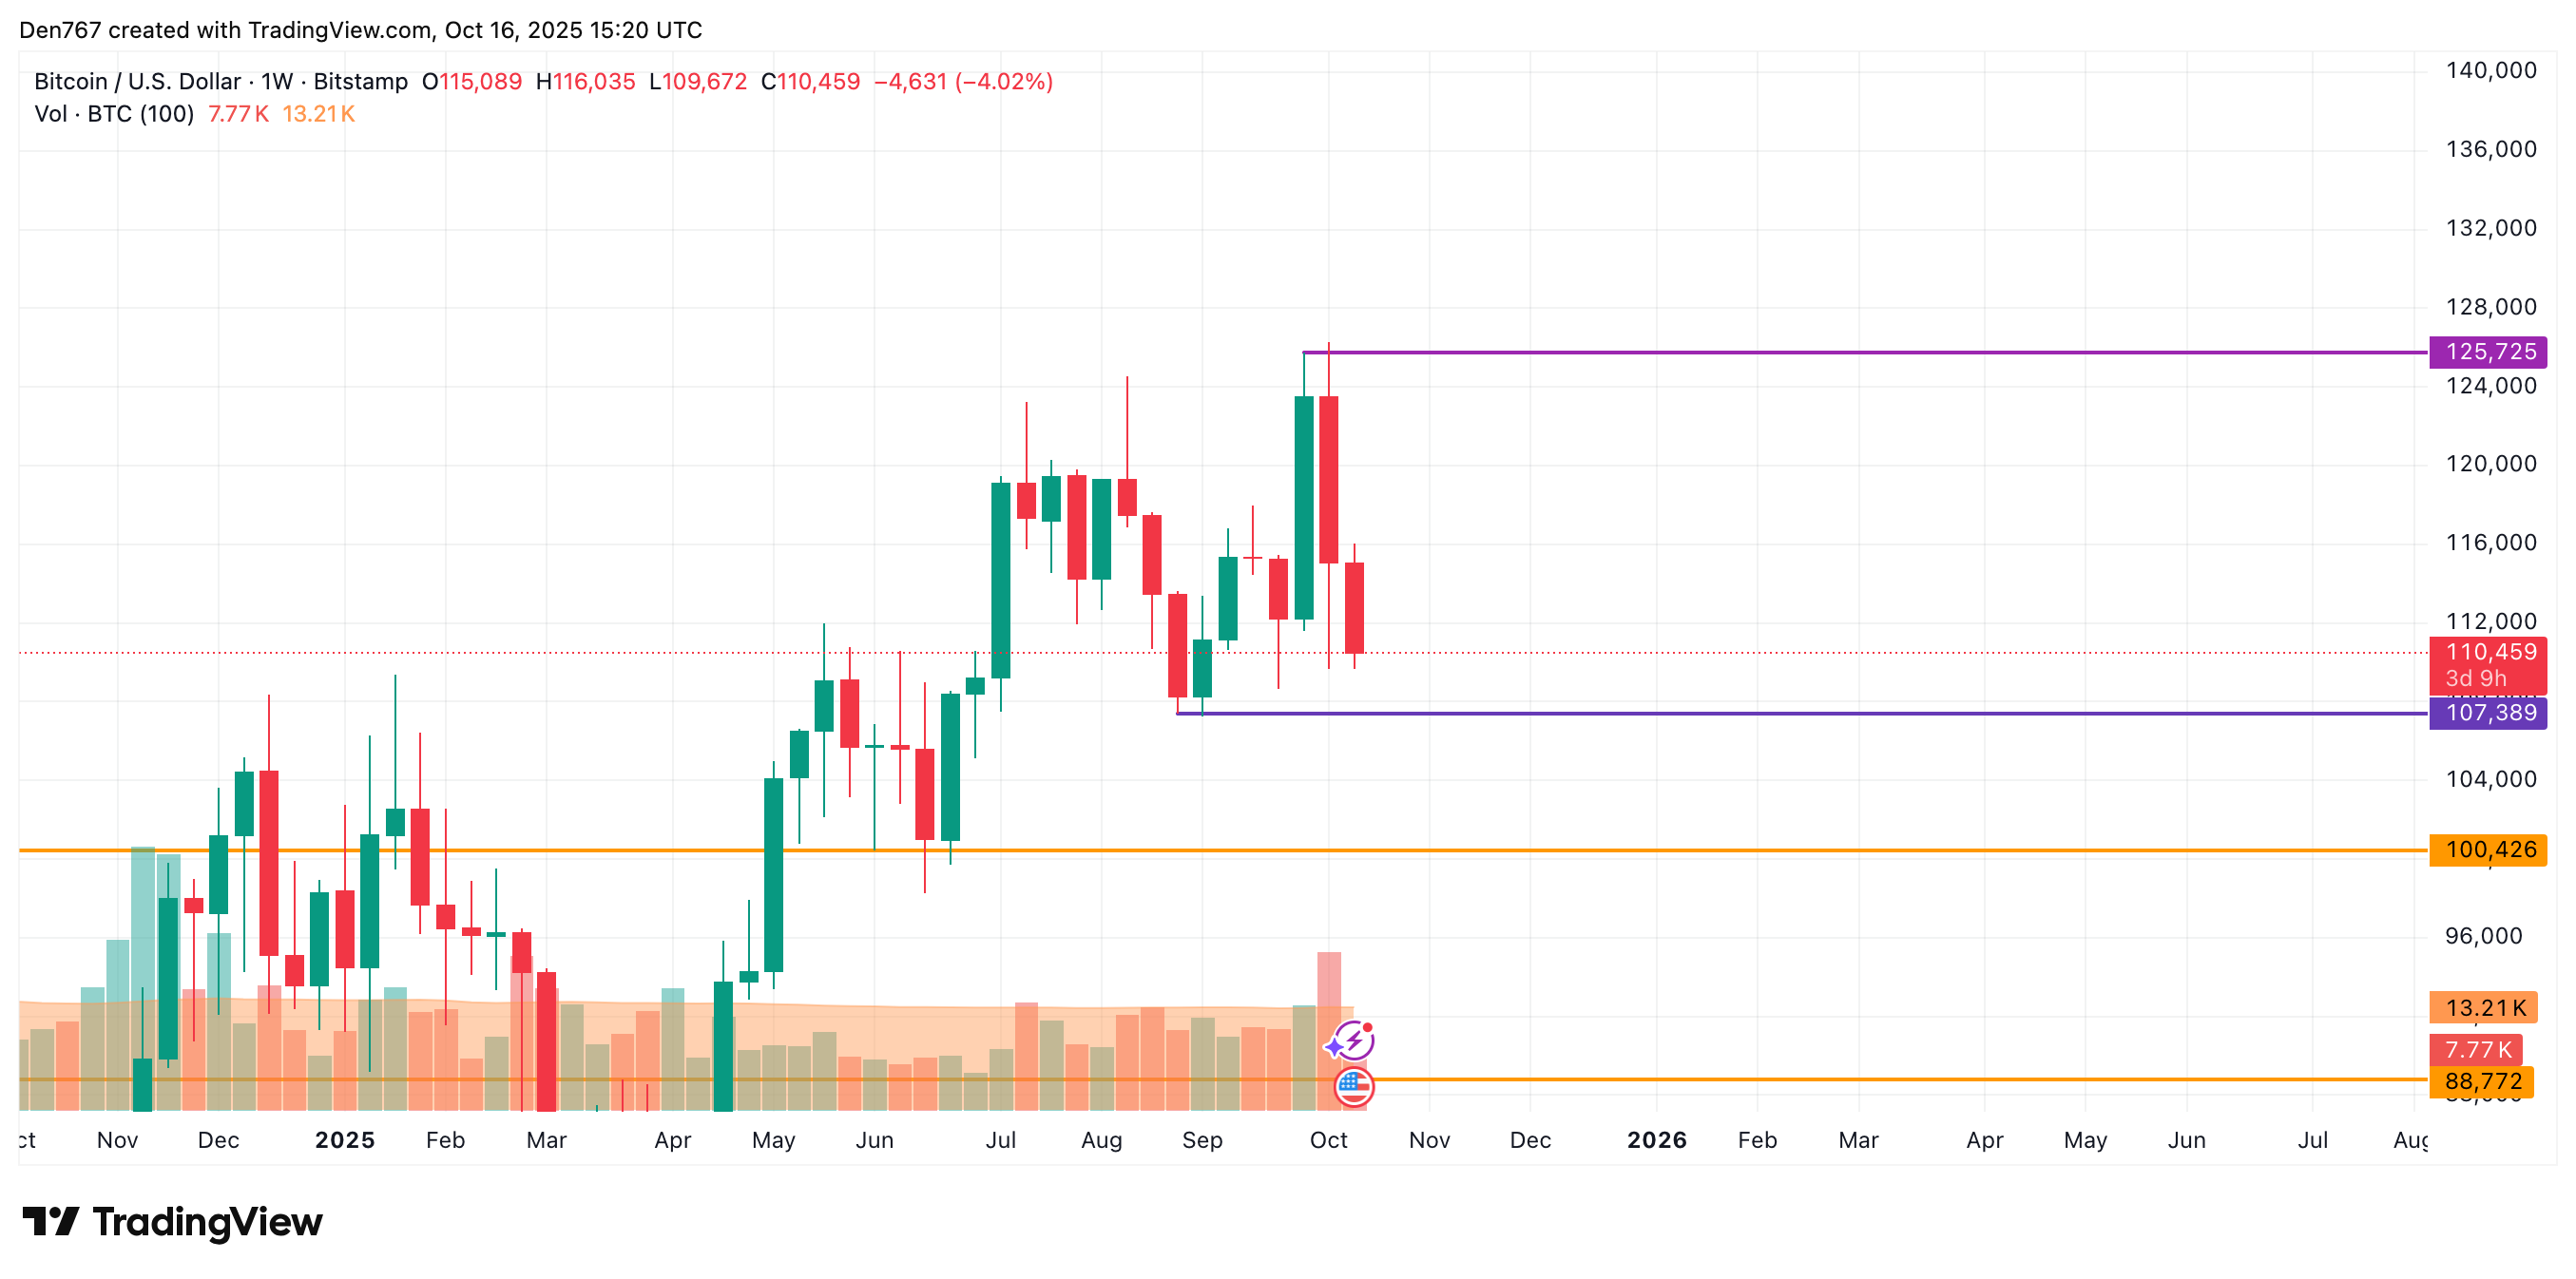
From the midterm point of view, there are no reversal signals yet. In this regard, one should pay attention to the weekly bar’s closure in terms of the $107,389 level. If its breakout happens, the decline may continue to the $100,000 area.
Bitcoin is trading at $110,459 at press time.