The Bitcoin price has crashed into a correction after plunging by 14% from its highest point this year, and the trend may continue as a risky pattern forms and exchange-traded fund (ETF) outflows persist.
- Bitcoin price has formed a double-top pattern on the daily chart.
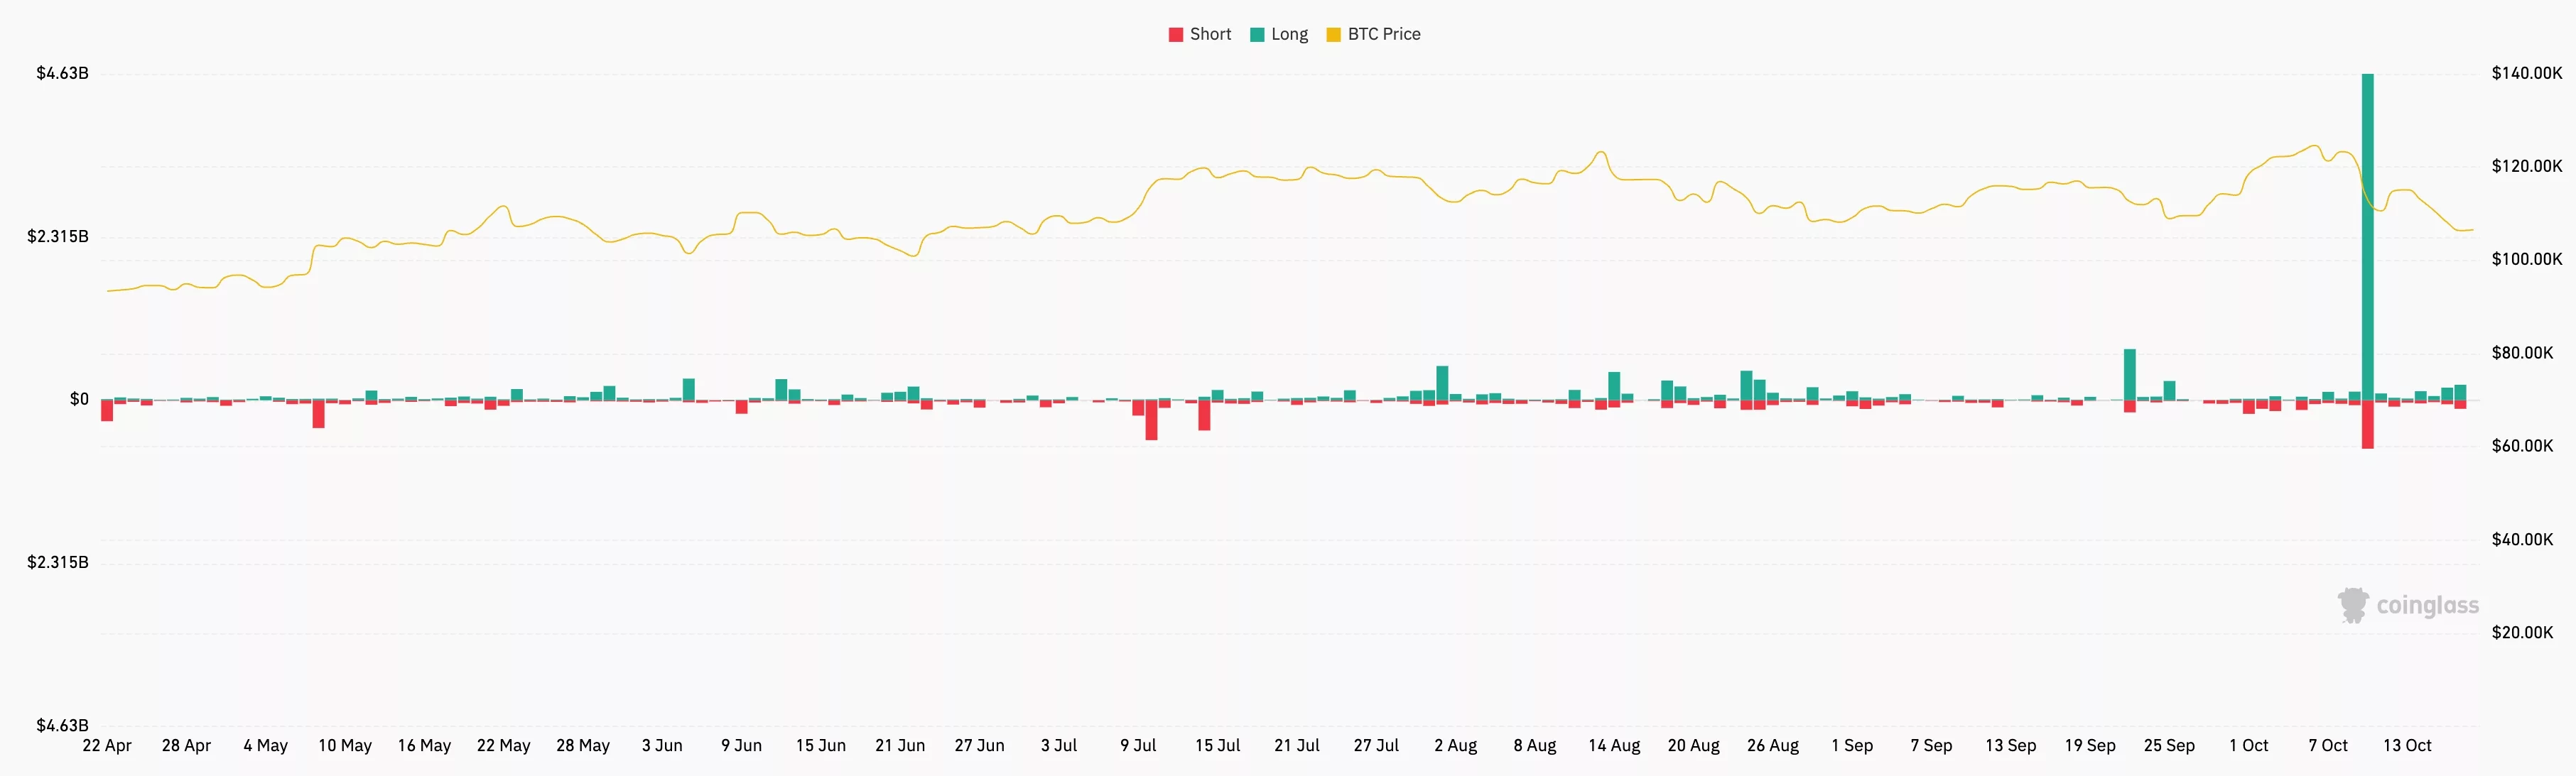
- Spot Bitcoin ETFs shed over $1.6 billion in assets this week.
- Investors are experiencing significant concerns following the recent liquidations.
American investors dumped their Bitcoin (BTC) holdings this week as the crypto Fear and Greed Indexplummeted into the fear zone and liquidations surged.
Data compiled by SoSoValue shows that spot Bitcoin ETFs shed over $1.23 billion in assets this week. BlackRock’s IBIT shed over $268 million, while Fidelity’s FBTC lost
These outflows brought the cumulative inflows since their inception in January last year to $61.54 billion.
The outflows represented a sharp reversal from the previous two weeks, during which they had added almost $6 billion in assets.
Investors dumped Bitcoin after it suffered over $4.65 billion in liquidations last Friday, as the crypto market crashed. It is common for investors to sell their coins or stay in the sidelines after such a big liquidation event.
They also sold Bitcoin as gold emerged as a better safe-haven asset amid rising risks. There are risks that the trade war between the US and China will escalate, leading to higher inflation, which may prevent the Fed from cutting interest rates.
The other notable risks include the ongoing U.S. government shutdown and credit quality. Credit issues emerged after three regional banks reported fraud-related losses.
Bitcoin price technical analysis
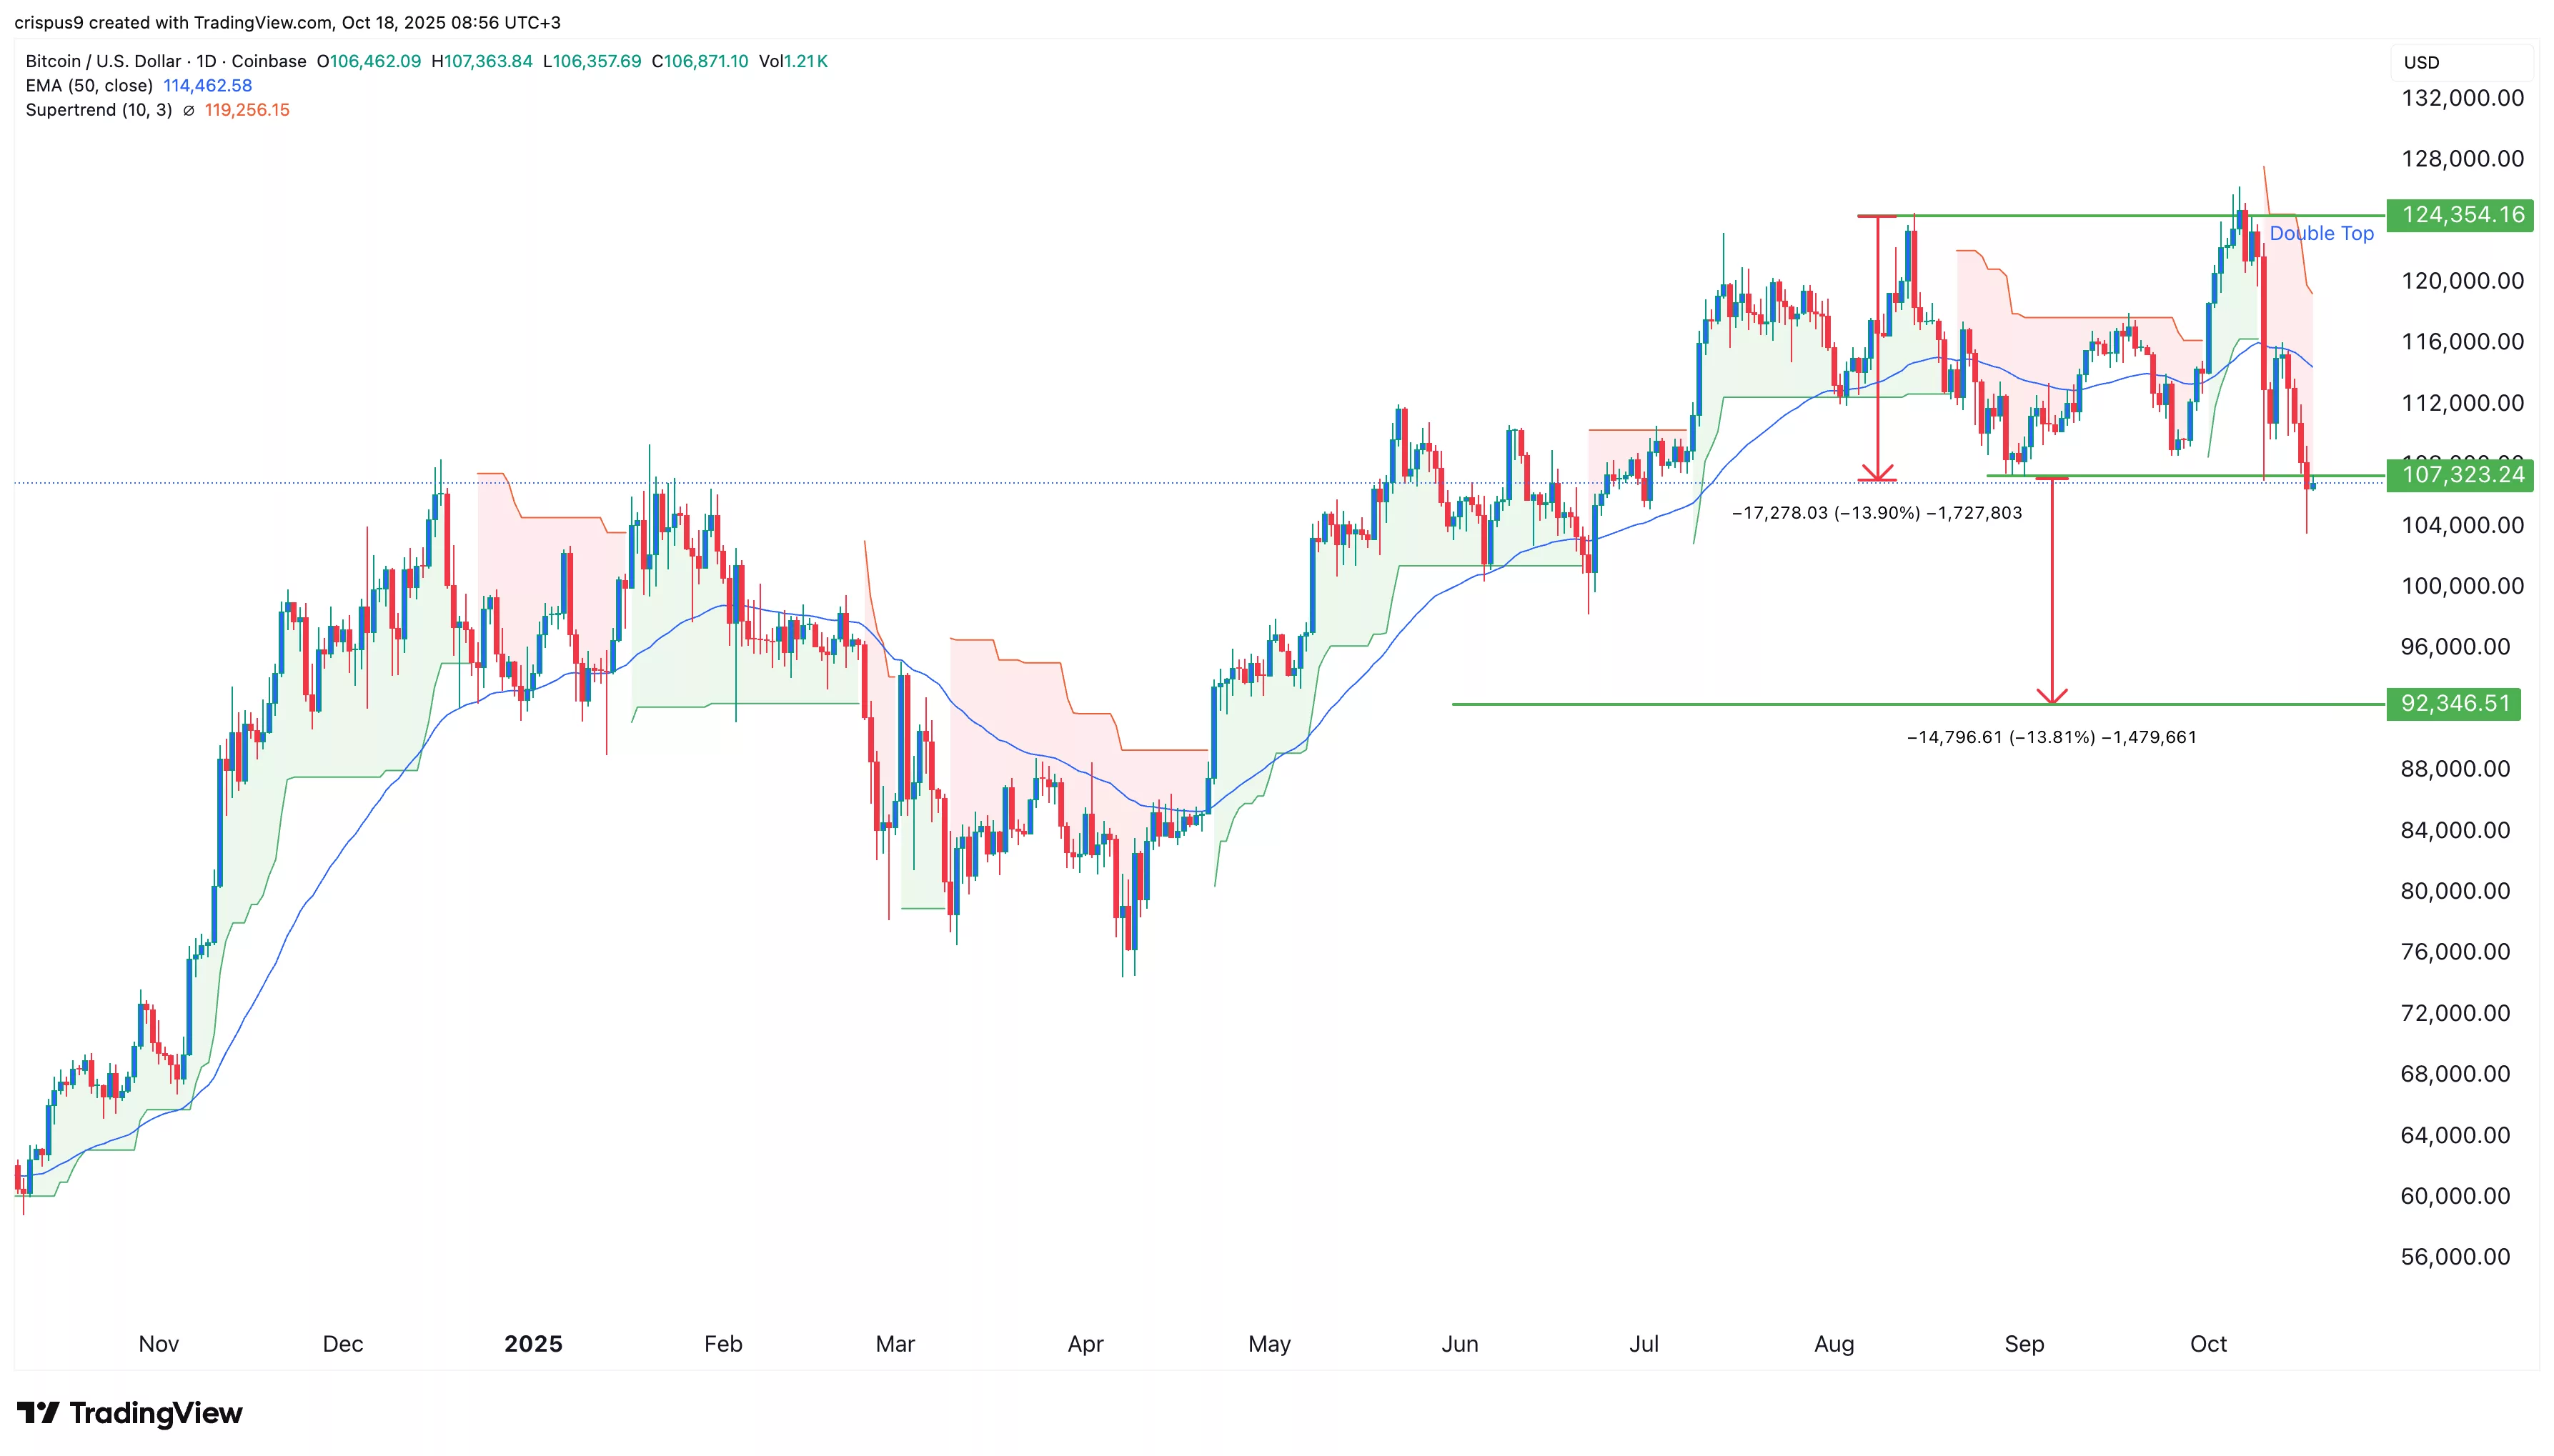
The daily timeframe chart shows that the BTC price remains under pressure after falling by 14% from its highest point this year.
It has crashed below the 50-day moving average, while the Supertrend indicator has turned red. Most notably, the coin has formed a double-top pattern at $124,355.
A double top is one of the most common bearish signs in technical analysis. Its profit target is estimated by measuring the distance between the head and the neckline, and then the same one from the neckline.
In this case, the profit target is about $92,345, its lowest point since April this year. A move above the resistance level at $113,000 will invalidate the bearish outlook.