The latest Bitcoin chart paints a concerning picture. $BTC is currently hovering around $110,000, but the momentum is clearly weakening.
The daily RSI has dropped below 46, showing fading buying strength, while the MACD lines are about to cross bearishly — a classic sign of trend exhaustion.
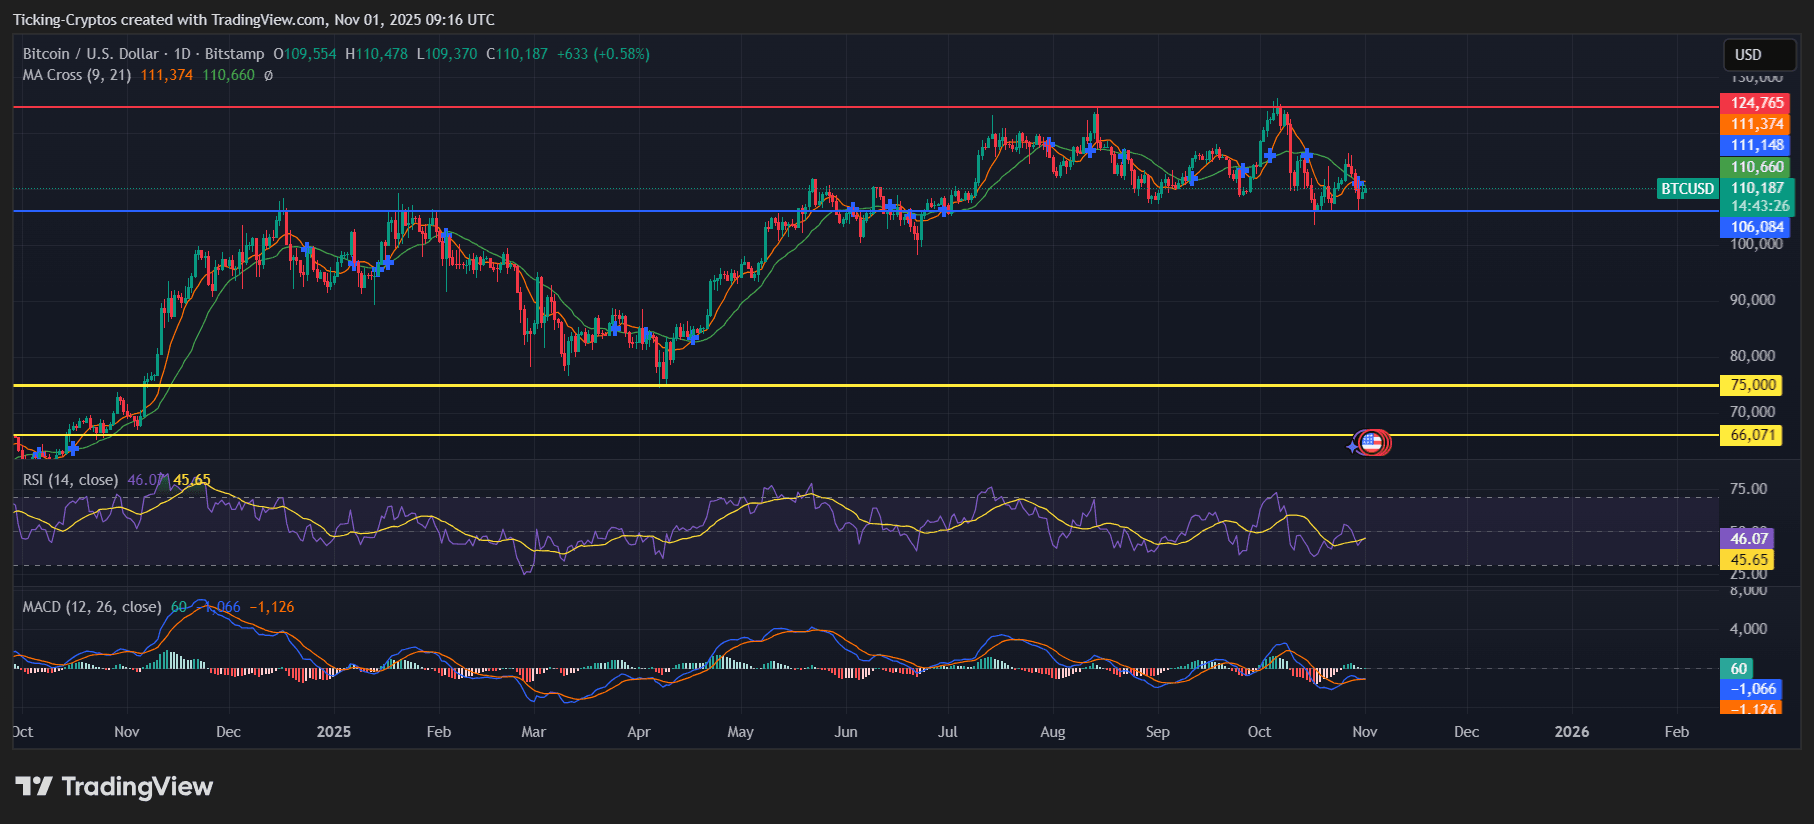
BTC/USD 1-day chart – TradingView
The 50-day moving average (around $111,000) is now acting as resistance, while key support levels sit at $106,000, $75,000, and finally $66,000 — levels that have historically served as major retracement zones.
If $Bitcoin closes below $106,000, this could confirm a deeper pullback targeting the $100,000 zone or even lower. The chart’s lower highs and weaker rebounds reflect a shift from accumulation to distribution — typical of post-peak behavior in long bull cycles.
BlackRock Sells $149.3 Million Worth of Bitcoin…Again
Institutional investors are starting to take profits. Reports confirm that BlackRock, the world’s largest asset manager, has sold $149.3 million worth of Bitcoin — signaling a cooling appetite for risk assets.
This sale doesn’t just reduce buying pressure; it also undermines retail confidence. When a player like BlackRock starts offloading BTC, smaller funds often follow suit. Historically, such sell-offs have marked the early stages of broader corrections, particularly when market sentiment remains overly bullish despite technical weakness.
The timing aligns almost perfectly with the RSI downturn and declining trading volumes — suggesting that smart money might already be exiting.
Analysts Warn: The Bull Market Could Be Over
A widely shared chart from Crypto Rover and BitboBTC compares Bitcoin’s current cycle to past four-year halving cycles. The data suggests that this bull market might already be over.
In previous eras (marked in blue, orange, and green), Bitcoin peaked roughly 500–550 days after the halving — right where the current cycle stands today.
Each prior cycle showed a similar structure: a strong mid-cycle rally, followed by distribution, and then a steep correction.
The highlighted red circles on the chart align perfectly with those historic peaks — implying that Bitcoin may already have hit its cycle top. If the pattern repeats, a gradual but persistent decline over the next few months could send Bitcoin back toward five-figure territory before stabilizing for the next accumulation phase.