
Bitcoin’s price holds steady at $118,000 as it continues to consolidate below key resistance levels. The asset commands a market capitalization of $2.34 trillion with strong 24-hour trading volume of around $24.52 billion and an intraday range of $117,502 to $118,483, indicating subdued volatility near a psychological inflection point.
Bitcoin
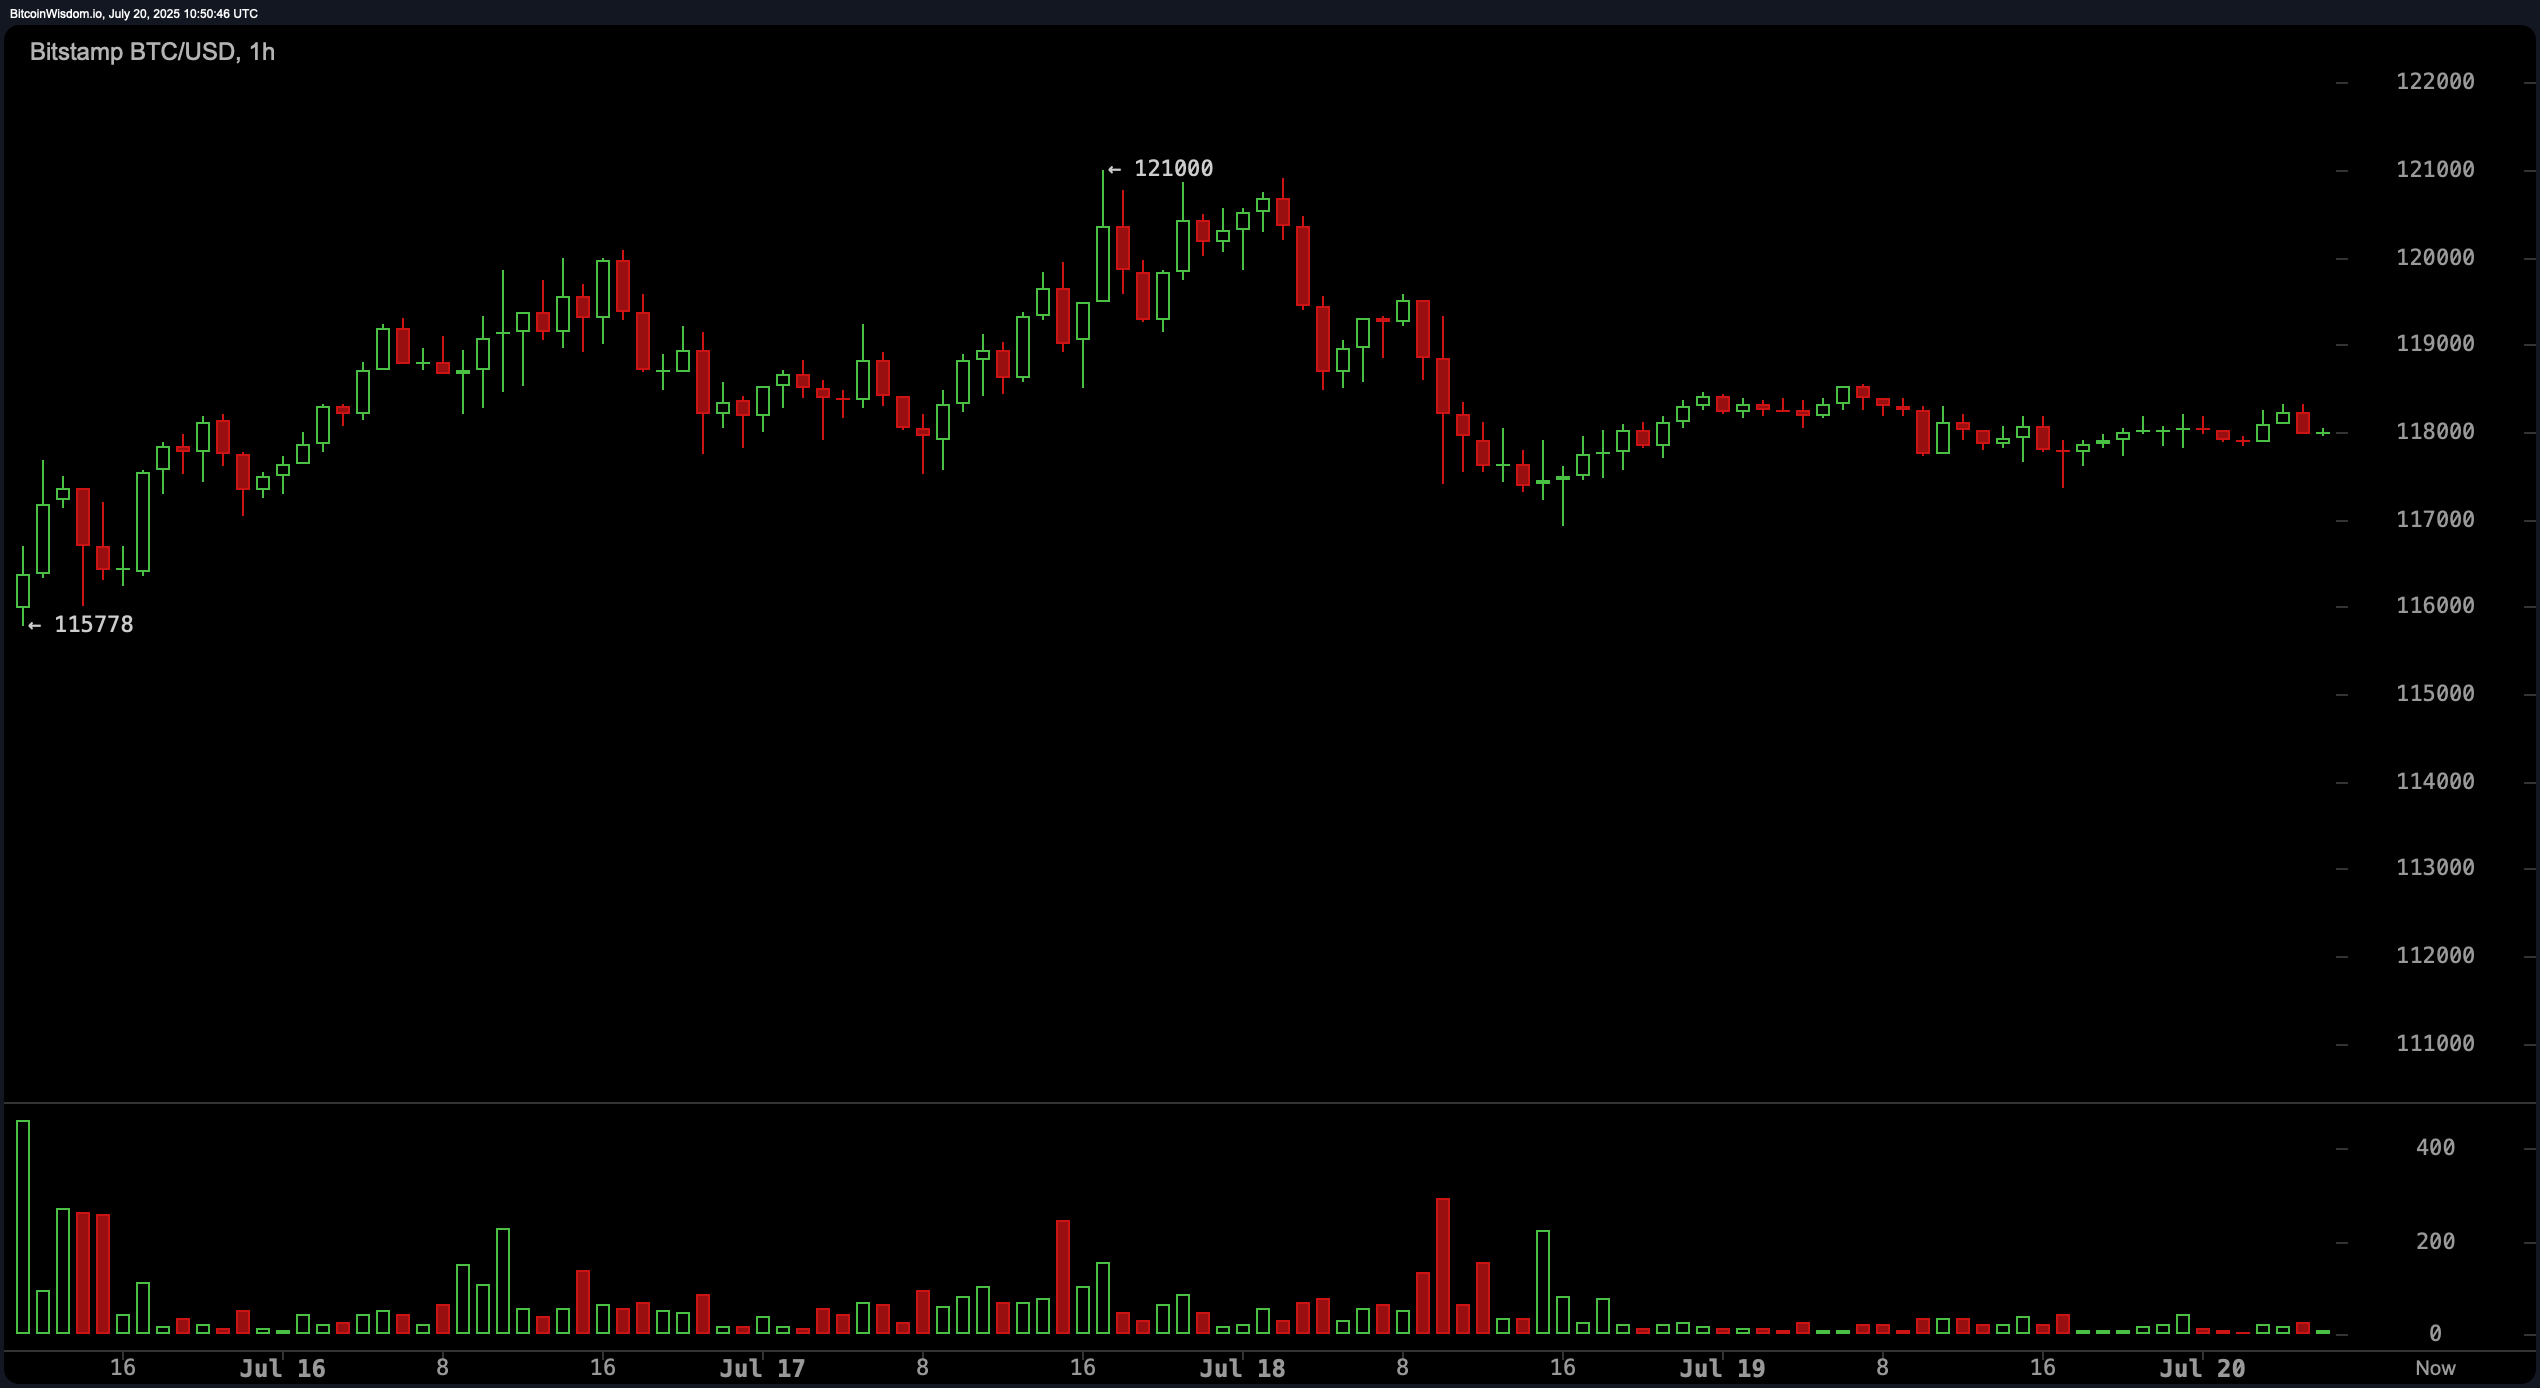
On the 1-hour chart, bitcoin has exhibited choppy consolidation, trading within a tight band between $117,500 and $118,500 after a recent rejection near $121,000. This range-bound structure, characterized by reduced directional conviction, suggests a potential breakout scenario is forming. Technical signals advise caution; the momentum oscillator is issuing a bearish signal while the moving average convergence divergence (MACD) at 3,134 indicates bullish momentum.
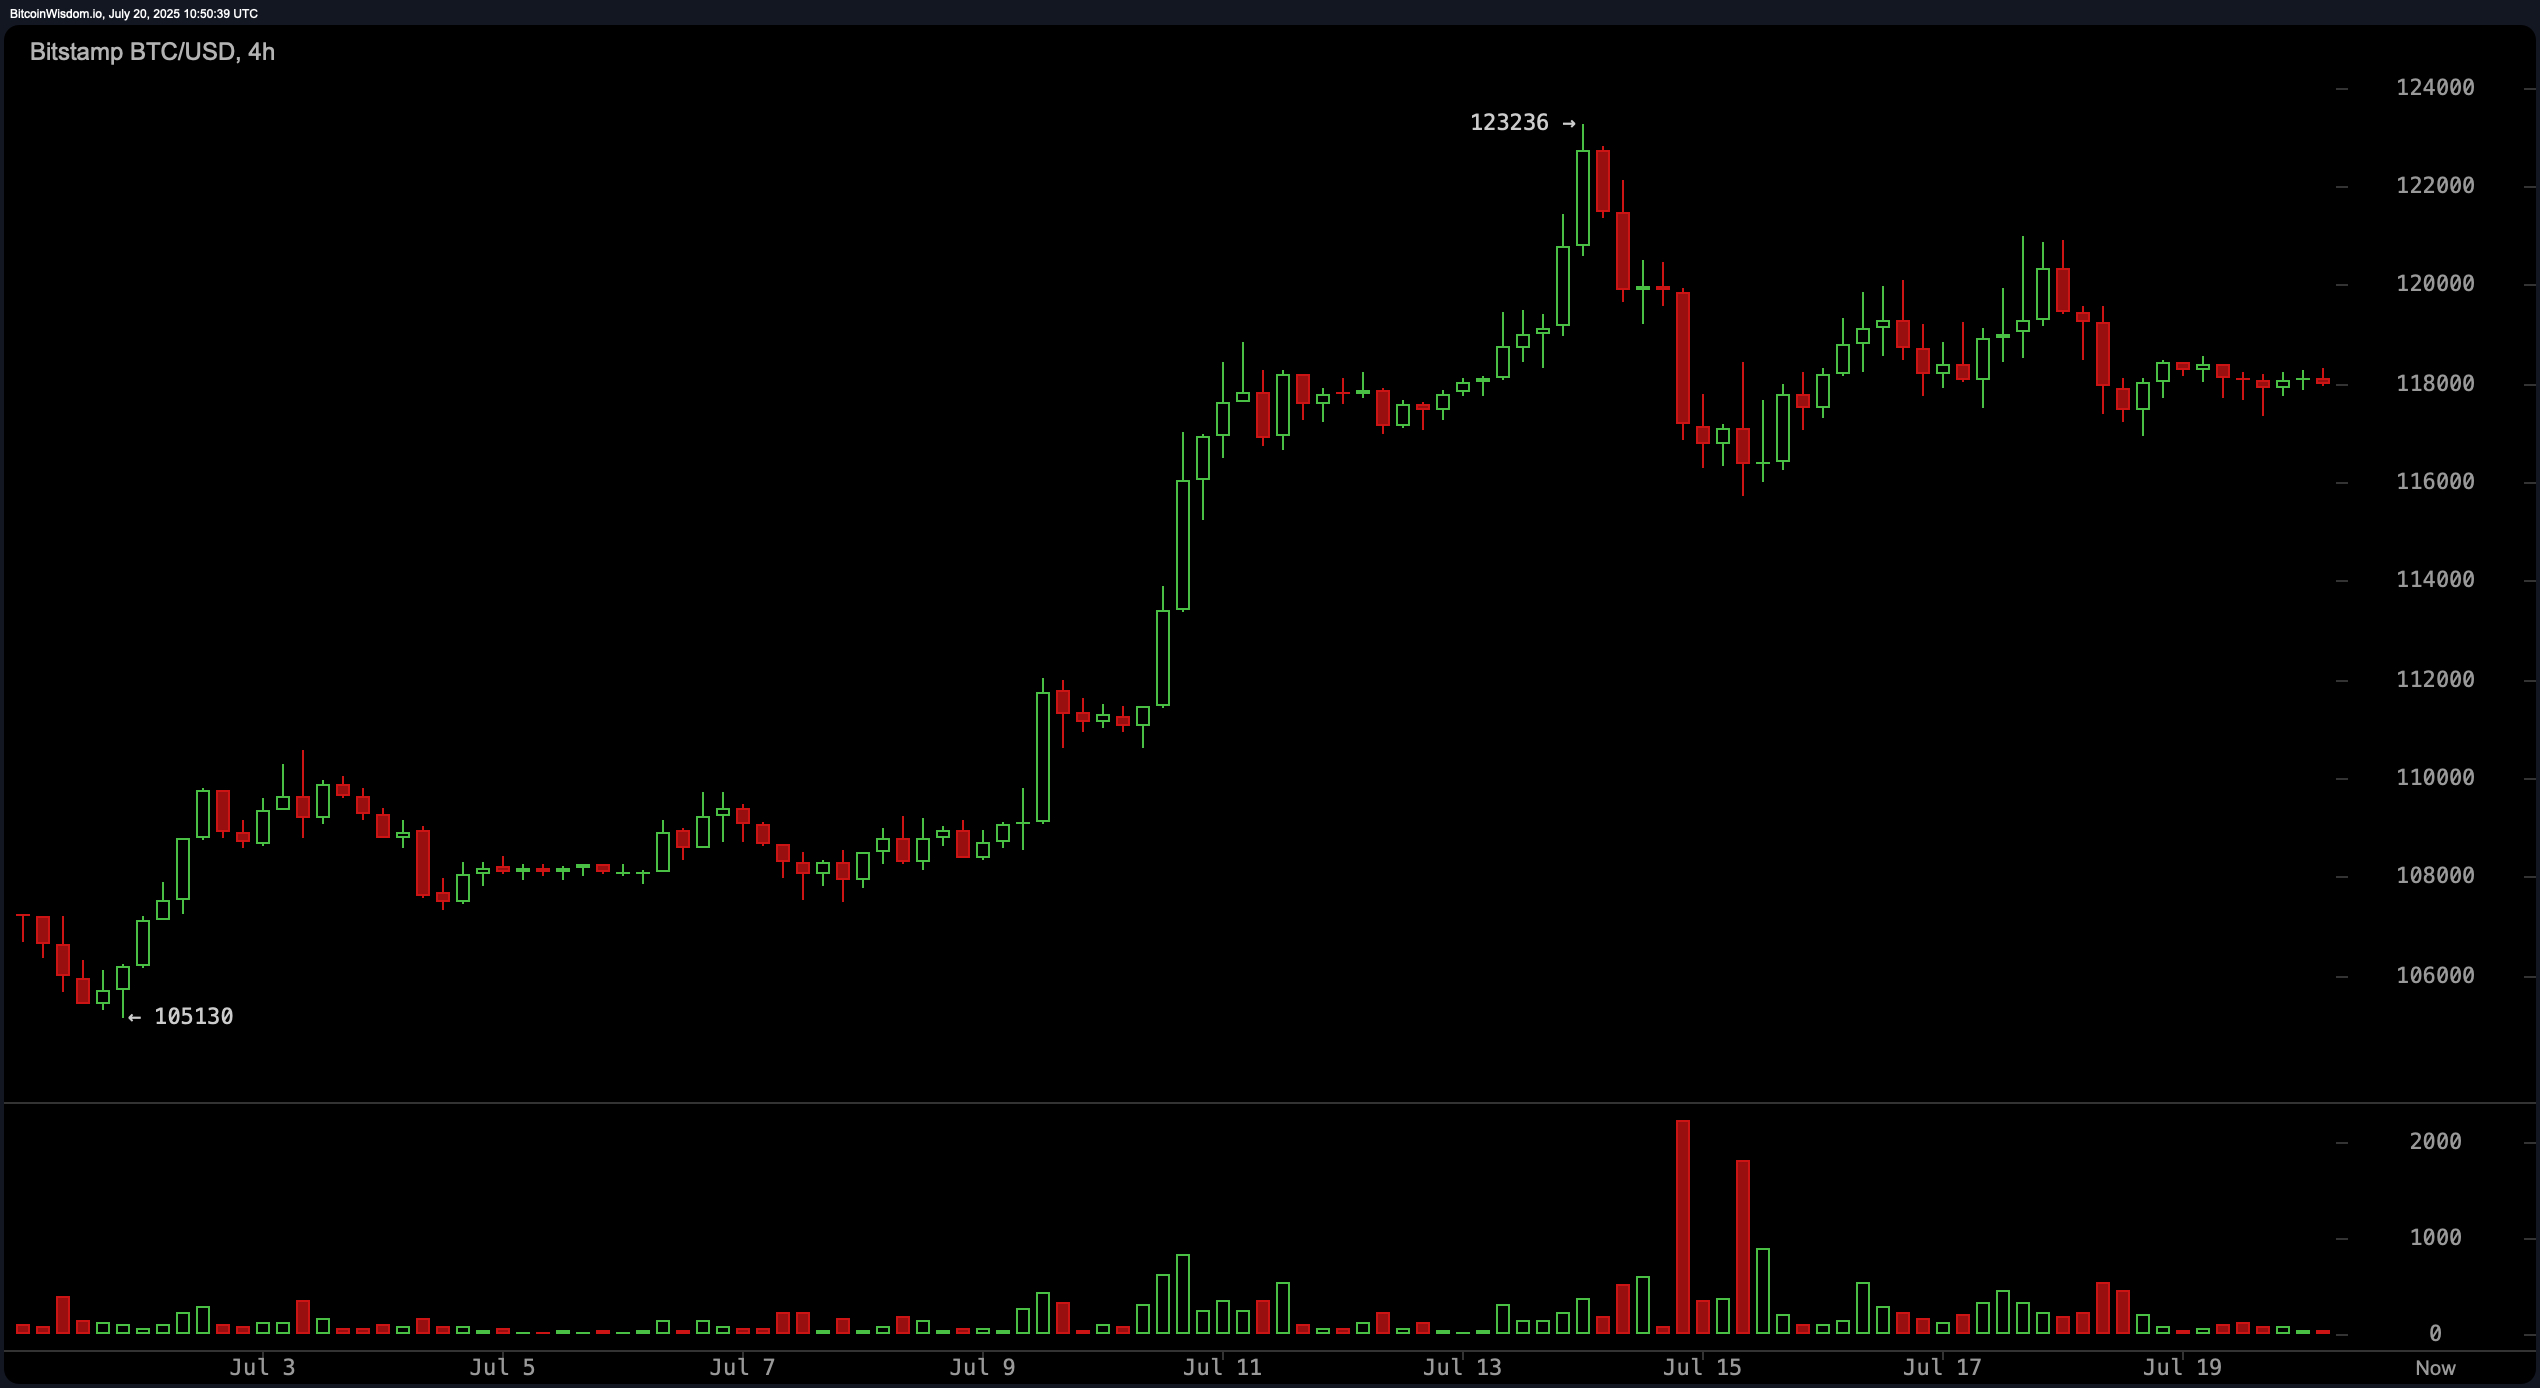
Zooming out to the 4-hour chart, bitcoin‘s post-peak retracement from $123,236 has transitioned into a phase of descending consolidation, marked by lower highs and declining volume—an indication of buyer fatigue or market indecision. Though the exponential moving averages (EMAs) across short- to mid-range intervals such as 10, 20, and 30 are signaling bullish, price action remains constrained beneath the $120,000 resistance. An upside breakout above $120,500 with meaningful volume would reinforce a bullish bias, while failure to hold the $117,000 support could expose the price to a decline toward the $114,000–$111,000 zone.
The daily BTC/USD chart highlights a strong longer-term uptrend from April, though recent candles reveal a red volume spike, hinting at profit-taking behavior. With bitcoin consolidating just under $120,000, this level now serves as the critical pivot for trend continuation. Support remains sturdy between $116,000 and $117,000, presenting a tactical re-entry opportunity. However, a sustained breakdown below $114,000 could shift the broader outlook, potentially targeting retracements to $108,000–$110,000.

Market oscillators present a mixed but balanced outlook. The relative strength index (RSI) at 65, Stochastic at 67, commodity channel index (CCI) at 60, and average directional index (ADX) at 28 all reflect neutral positioning, suggesting neither strong overbought nor oversold conditions. The Awesome oscillator sits at 8,251, also in neutral territory, while the divergence in the MACD and momentum indicators highlights the present market ambiguity—short-term weakness within a long-term uptrend.
Moving averages (MAs) paint a predominantly bullish landscape, particularly on the daily scale. All exponential and simple moving averages (EMAs and SMAs) from the 20-period to the 200-period, including the exponential moving average (200) at $98,146 and the simple moving average (200) at $97,857, are in a bullish mode. The only exception lies in the short-term 10-period simple moving average (SMA), currently at $118,374, which reflects a minor overextension in recent price behavior.
In sum, bitcoin maintains a cautiously bullish bias, contingent upon a decisive move above $120,000. Traders are advised to remain nimble, monitoring key levels and volume confirmation for entries, while exercising risk management near the lower bounds of support.
Bull Verdict:
If bitcoin breaks decisively above $120,000 with supporting volume, the prevailing uptrend is likely to resume. With broad support from both exponential and simple moving averages, and momentum aligning via the moving average convergence divergence (MACD), a bullish continuation toward the previous high of $123,236—or beyond—is feasible.
Bear Verdict:
Should bitcoin fail to reclaim the $120,000 resistance and lose support at $116,000–$117,000, the risk of a deeper retracement rises. A close below $114,000 would invalidate the current bullish structure and could initiate a decline toward the $108,000–$110,000 zone, signaling a shift to short-term bearish momentum.