
Strategy Inc., which trades under the ticker symbol MSTR, saw its stock price plunge to its lowest level since April.
- The MSTR stock price has crashed to its lowest level since April.
- It has plunged by over 45% from its year-high.
- There are signs that the Digital Asset Treasury (DAT) bubble has burst.
Strategy, previously known as MicroStrategy, is the biggest digital asset treasury company, crashed to $250, down by 45% from its highest level this year.
It has plunged by over 53% from its all-time high, bringing its market cap to $72 billion, down from a record high of $128 billion.
Digital Asset Treasury trouble
The MSTR stock price has plunged amid ongoing concerns about the digital asset treasury industry, as companies in the sector have seen their lofty valuation metrics erode.
Data shows that Strategy’s market net asset value (mNAV) multiple has crashed from 3.5 in November last year to 1.08 today. This metric looks at the spread between a company’s Bitcoin (BTC) balance and its valuation.
The enterprise value-based mNAV has dropped to 1.311, down from over 4 in 2024 as its stock jumped. A company’s enterprise value reflects the total cost of acquiring a company, including its debt and excluding its cash.
Therefore, there is a likelihood that the market cap and the enterprise value-based NAV multiples will move below 1. This will be in line with that of other top Bitcoin treasury companies like KindlyMD, Metaplanet, MicroCloud Hologram, and Semler Scientific.
The ongoing MSTR stock crash is a sign that the DAT bubble has burst as stocks of most companies in the industry have plunged. For example, Tom Lee’s BitMine stock has plunged by over 70% from its all-time high.
Other treasury companies like Alt Sigma, Tron Inc., and The Smarter Web Company have all plunged by double digits. Most of them have a NAV multiple below 1, meaning their Bitcoin holdings are worth more than their valuations.
For example, Japan’s Metaplanet has a market cap of $3 billion, while its Bitcoin holdings are valued at over $3.2 billion.
MSTR stock price technical analysis
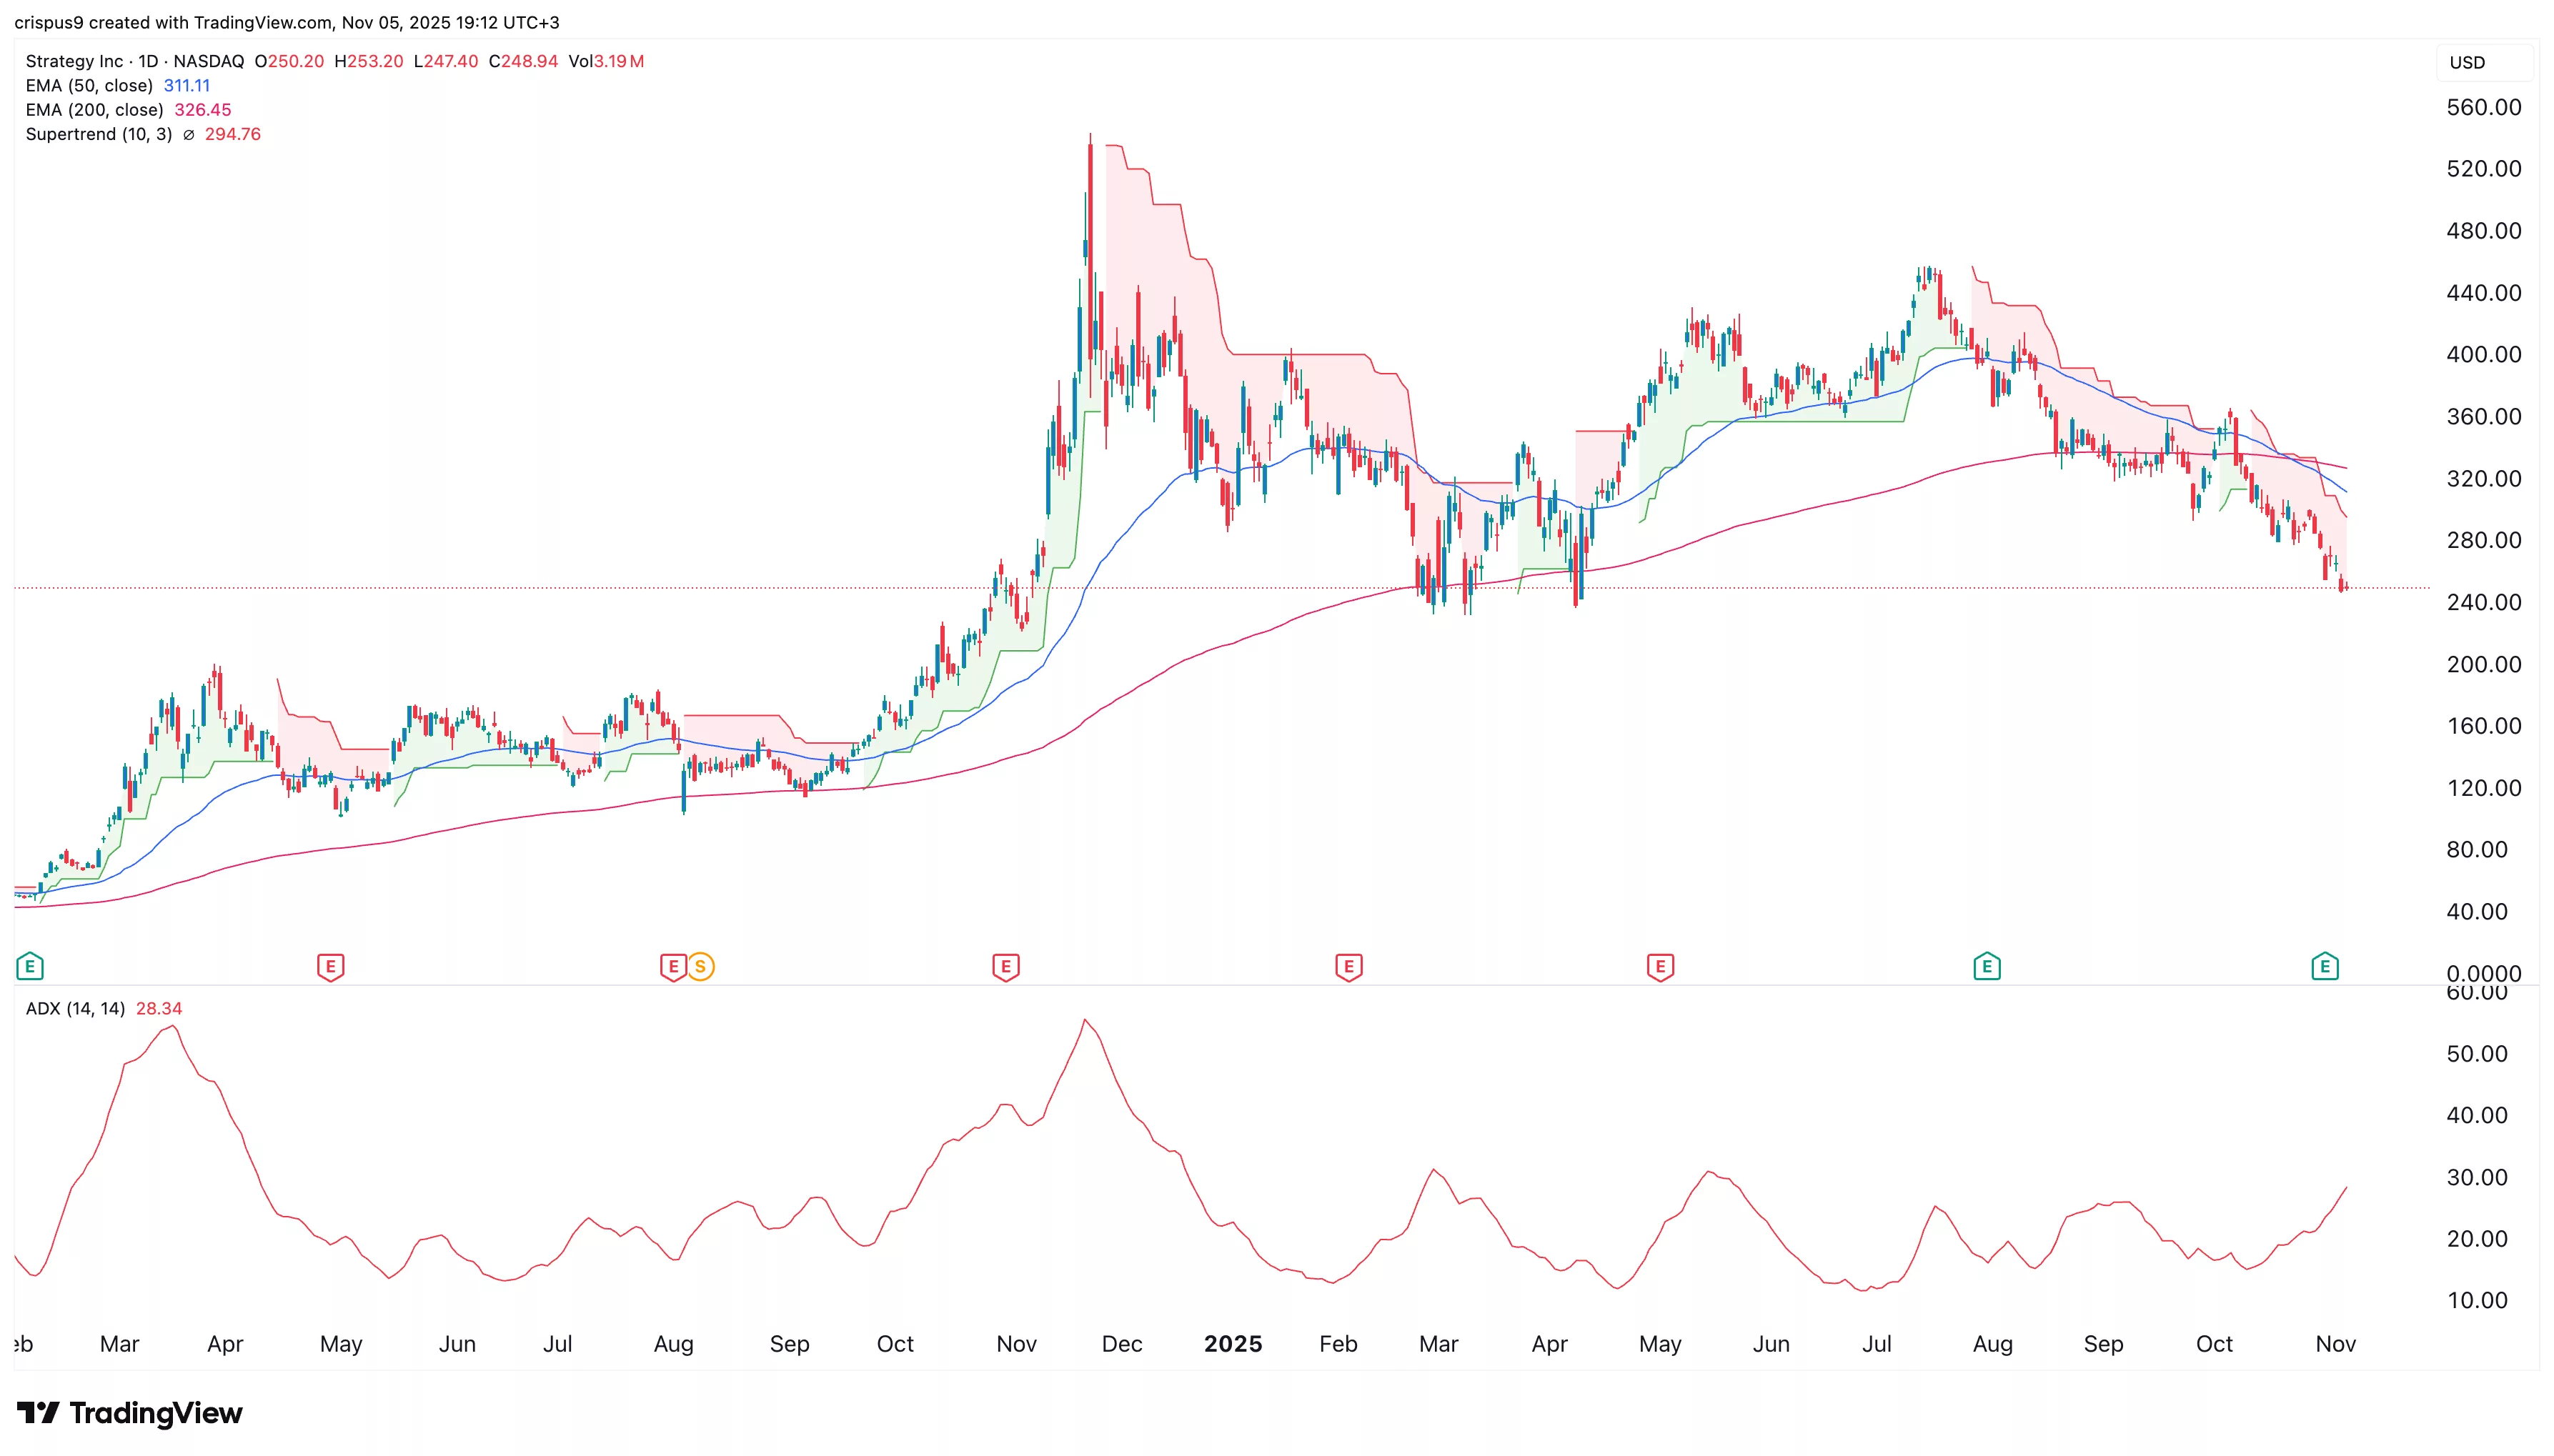
Technical analysis suggests that the Strategy stock price has more downside, which will drag its NAV below 1. It formed a death cross pattern on Oct. 22 as the 50-day moving average dropped below the 200-day one. This pattern points to more downside.
The Average Directional Index has jumped to 28, its highest level since May 20. A soaring ADX indicator is a sign that the downtrend is strengthening.
Also, the Relative Strength Index and the Stochastic have continued to fall. The Supertrend indicator remains above the stock, pointing to more downside, potentially to the psychological point at $200.