Bitcoin traded at $101,987 on Nov. 8, 2025, with a market capitalization of $2.03 trillion and a 24-hour trading volume of $77.43 billion. The price fluctuated within a daily range of $99,376.95 to $103,956, indicating a narrow consolidation phase following a recent downward move.
Bitcoin Chart Outlook
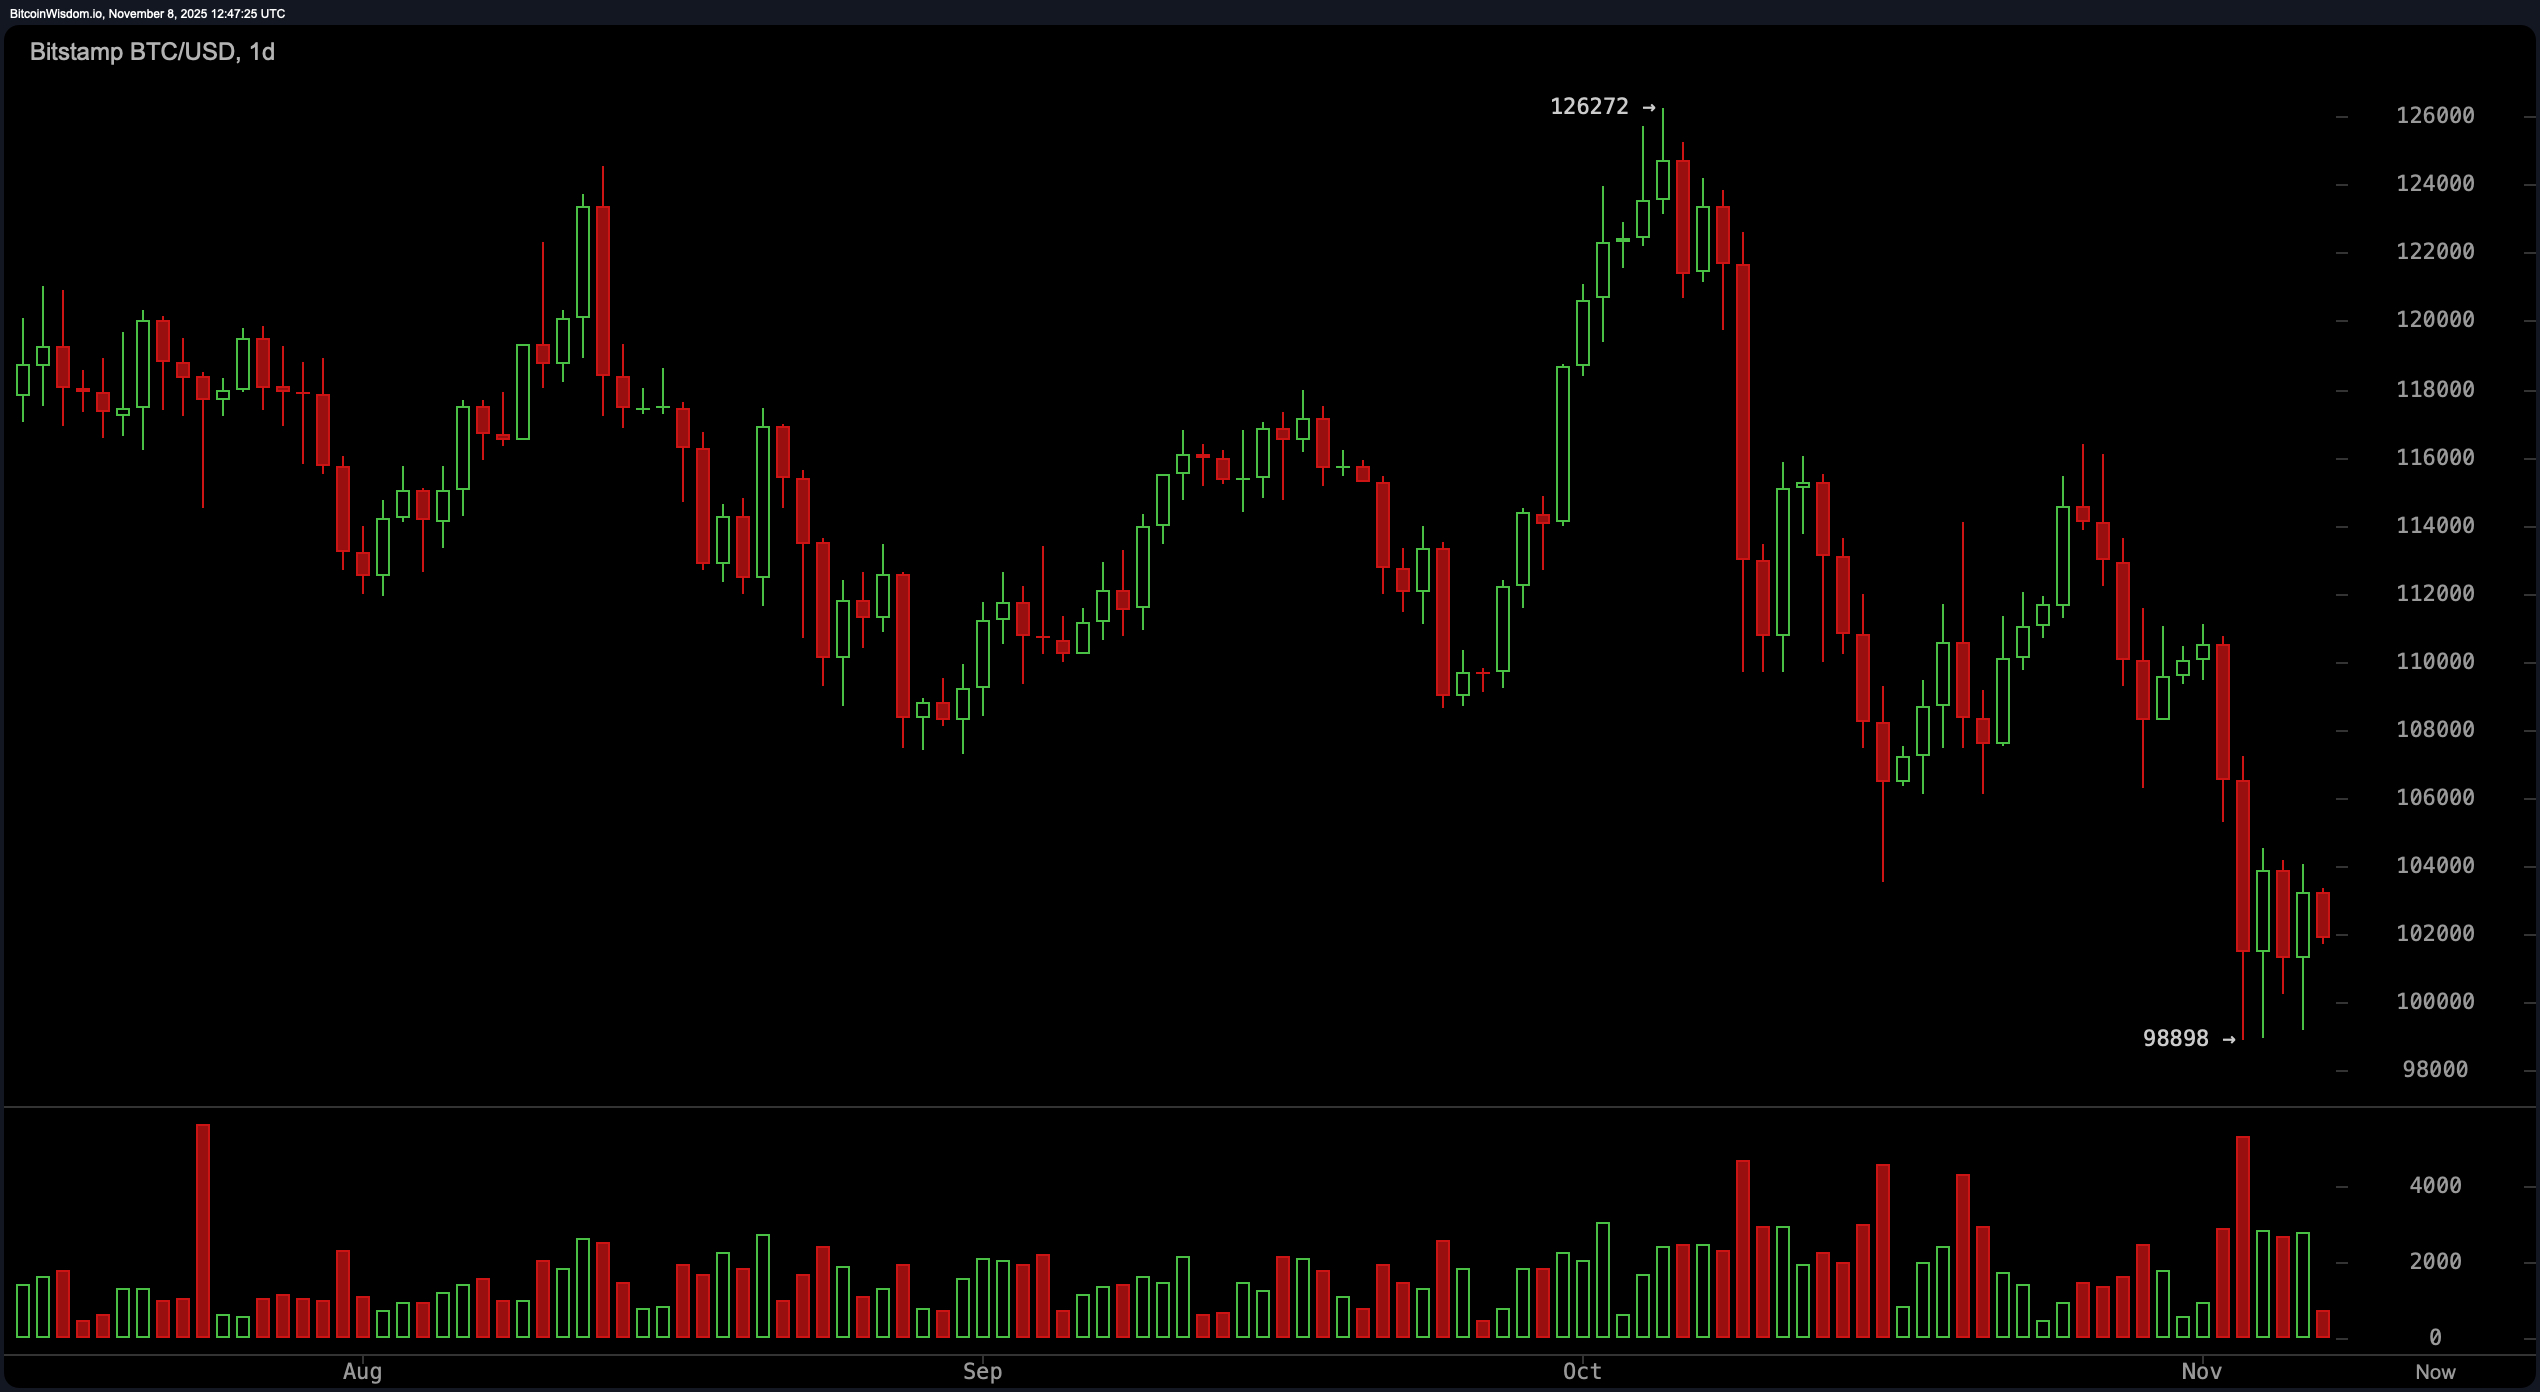
The daily chart reveals bitcoin in a persistent downtrend since its mid-October peak near $126,272, with recent price action consolidating between $98,900 and $104,000. The lower highs and lows indicate a bearish market structure, although the descent has stabilized in recent sessions.
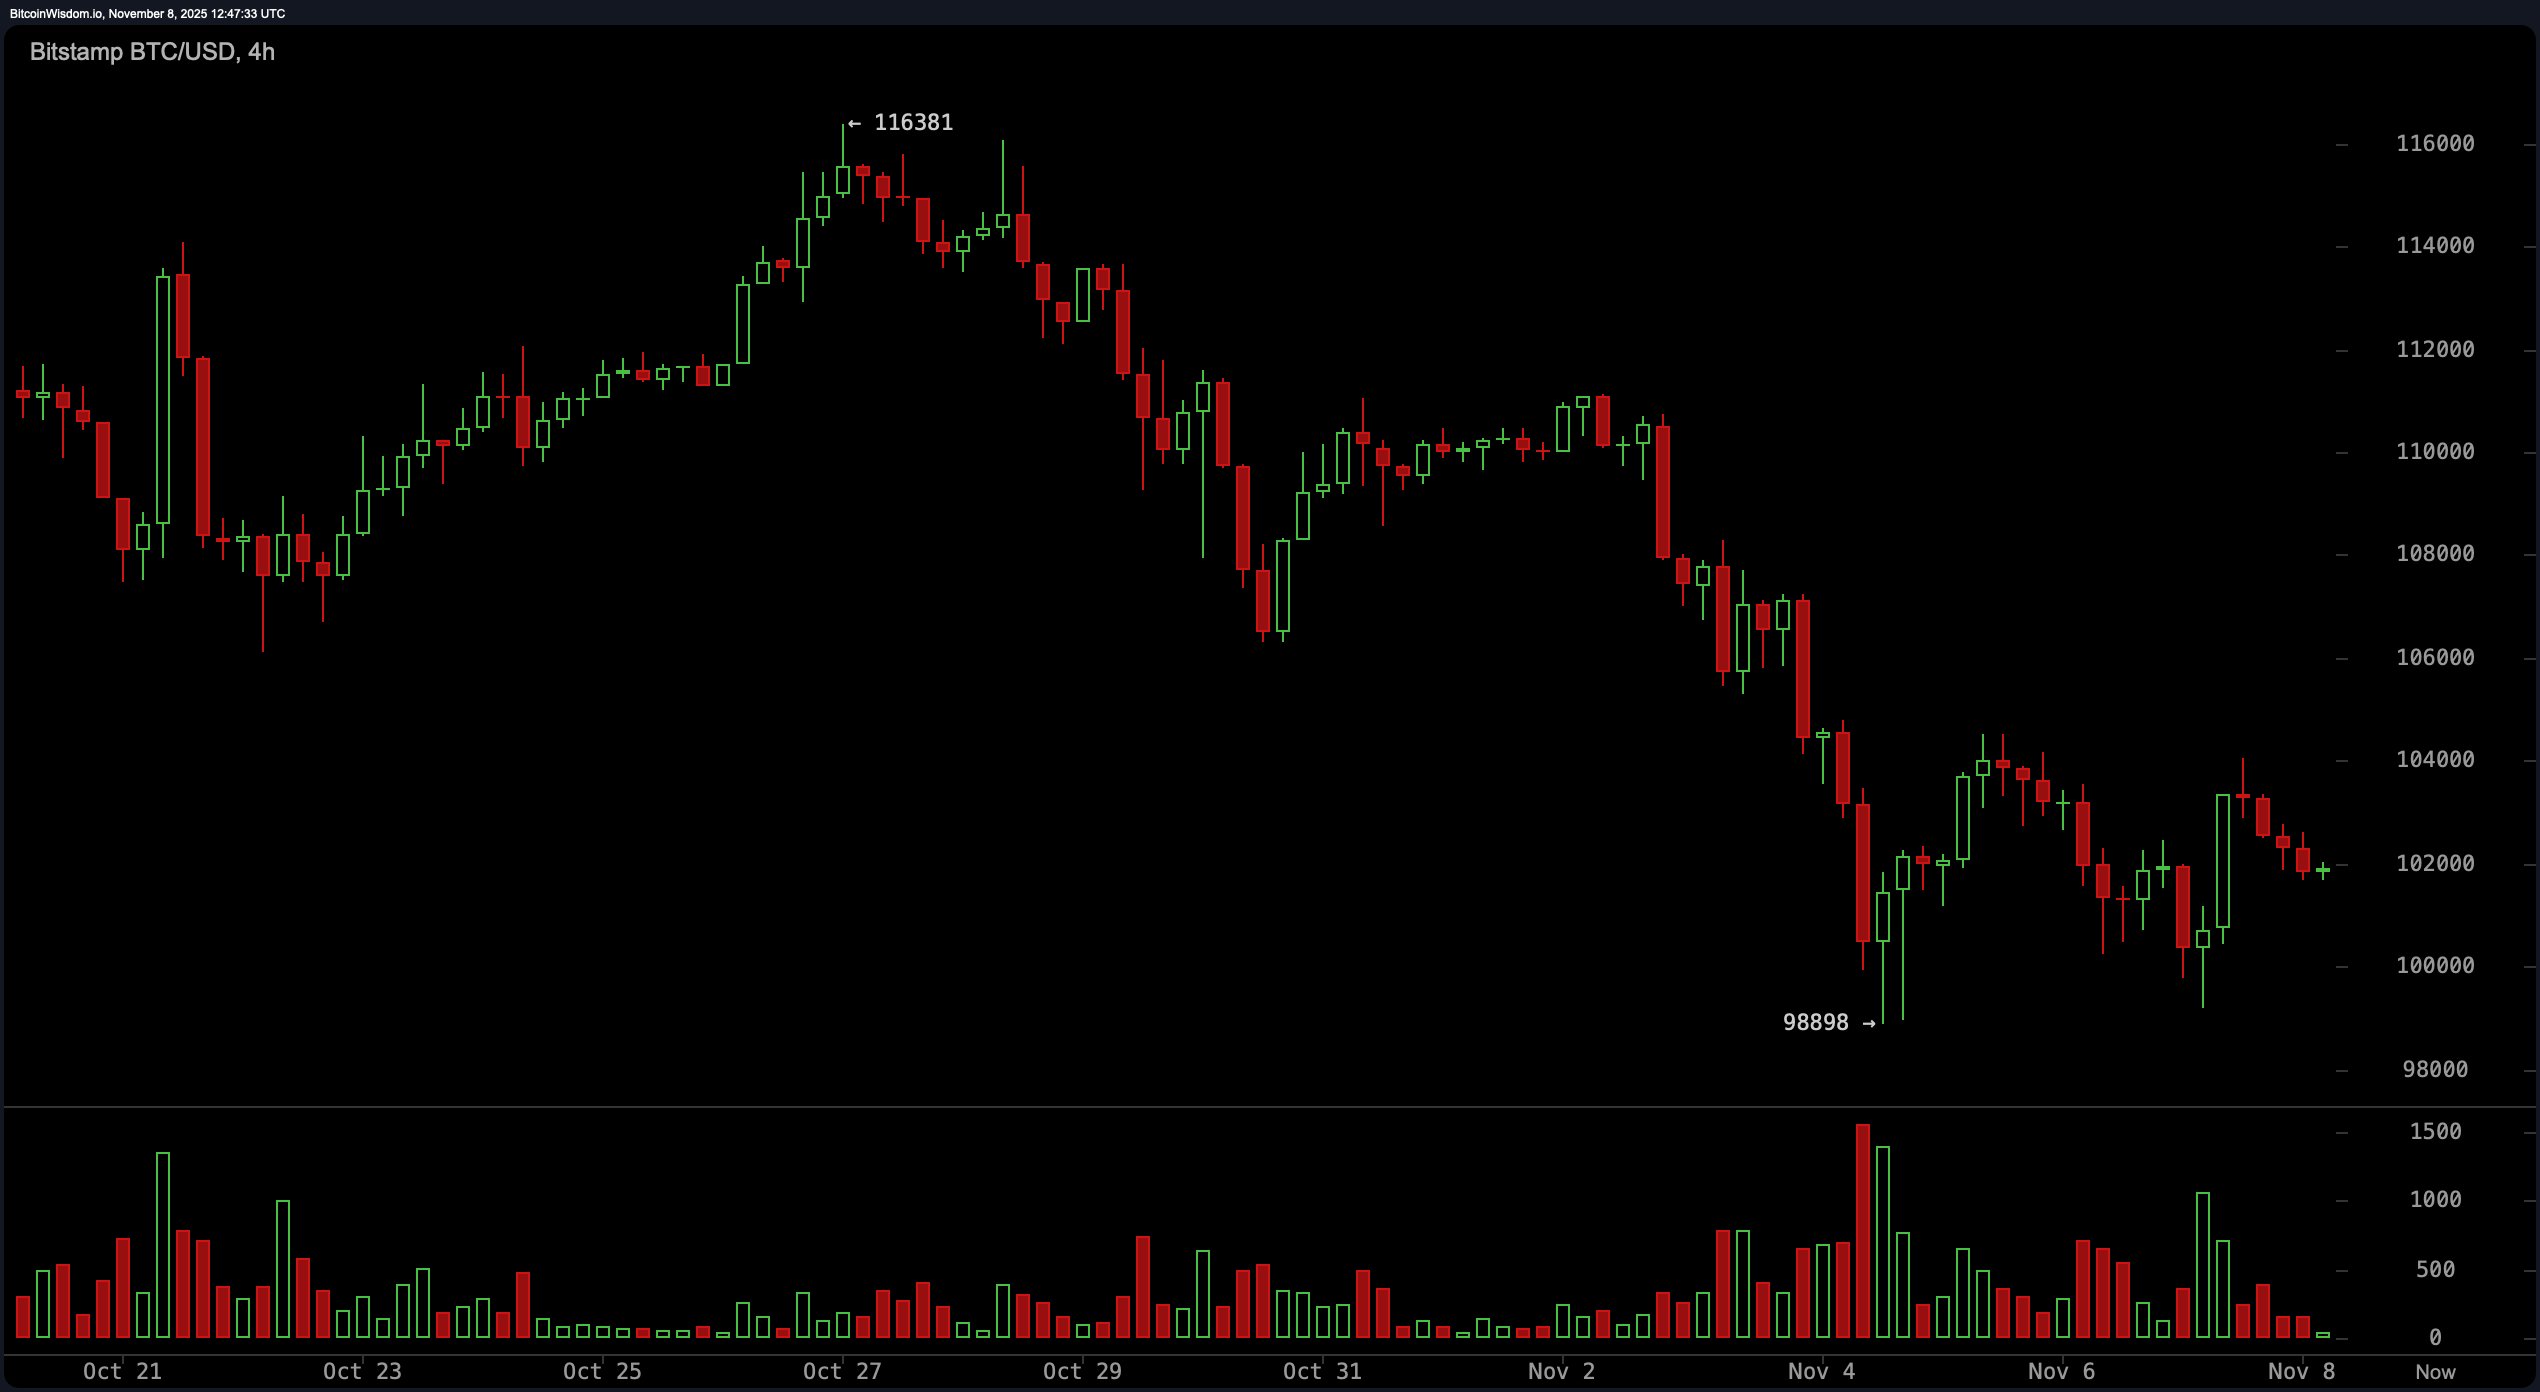
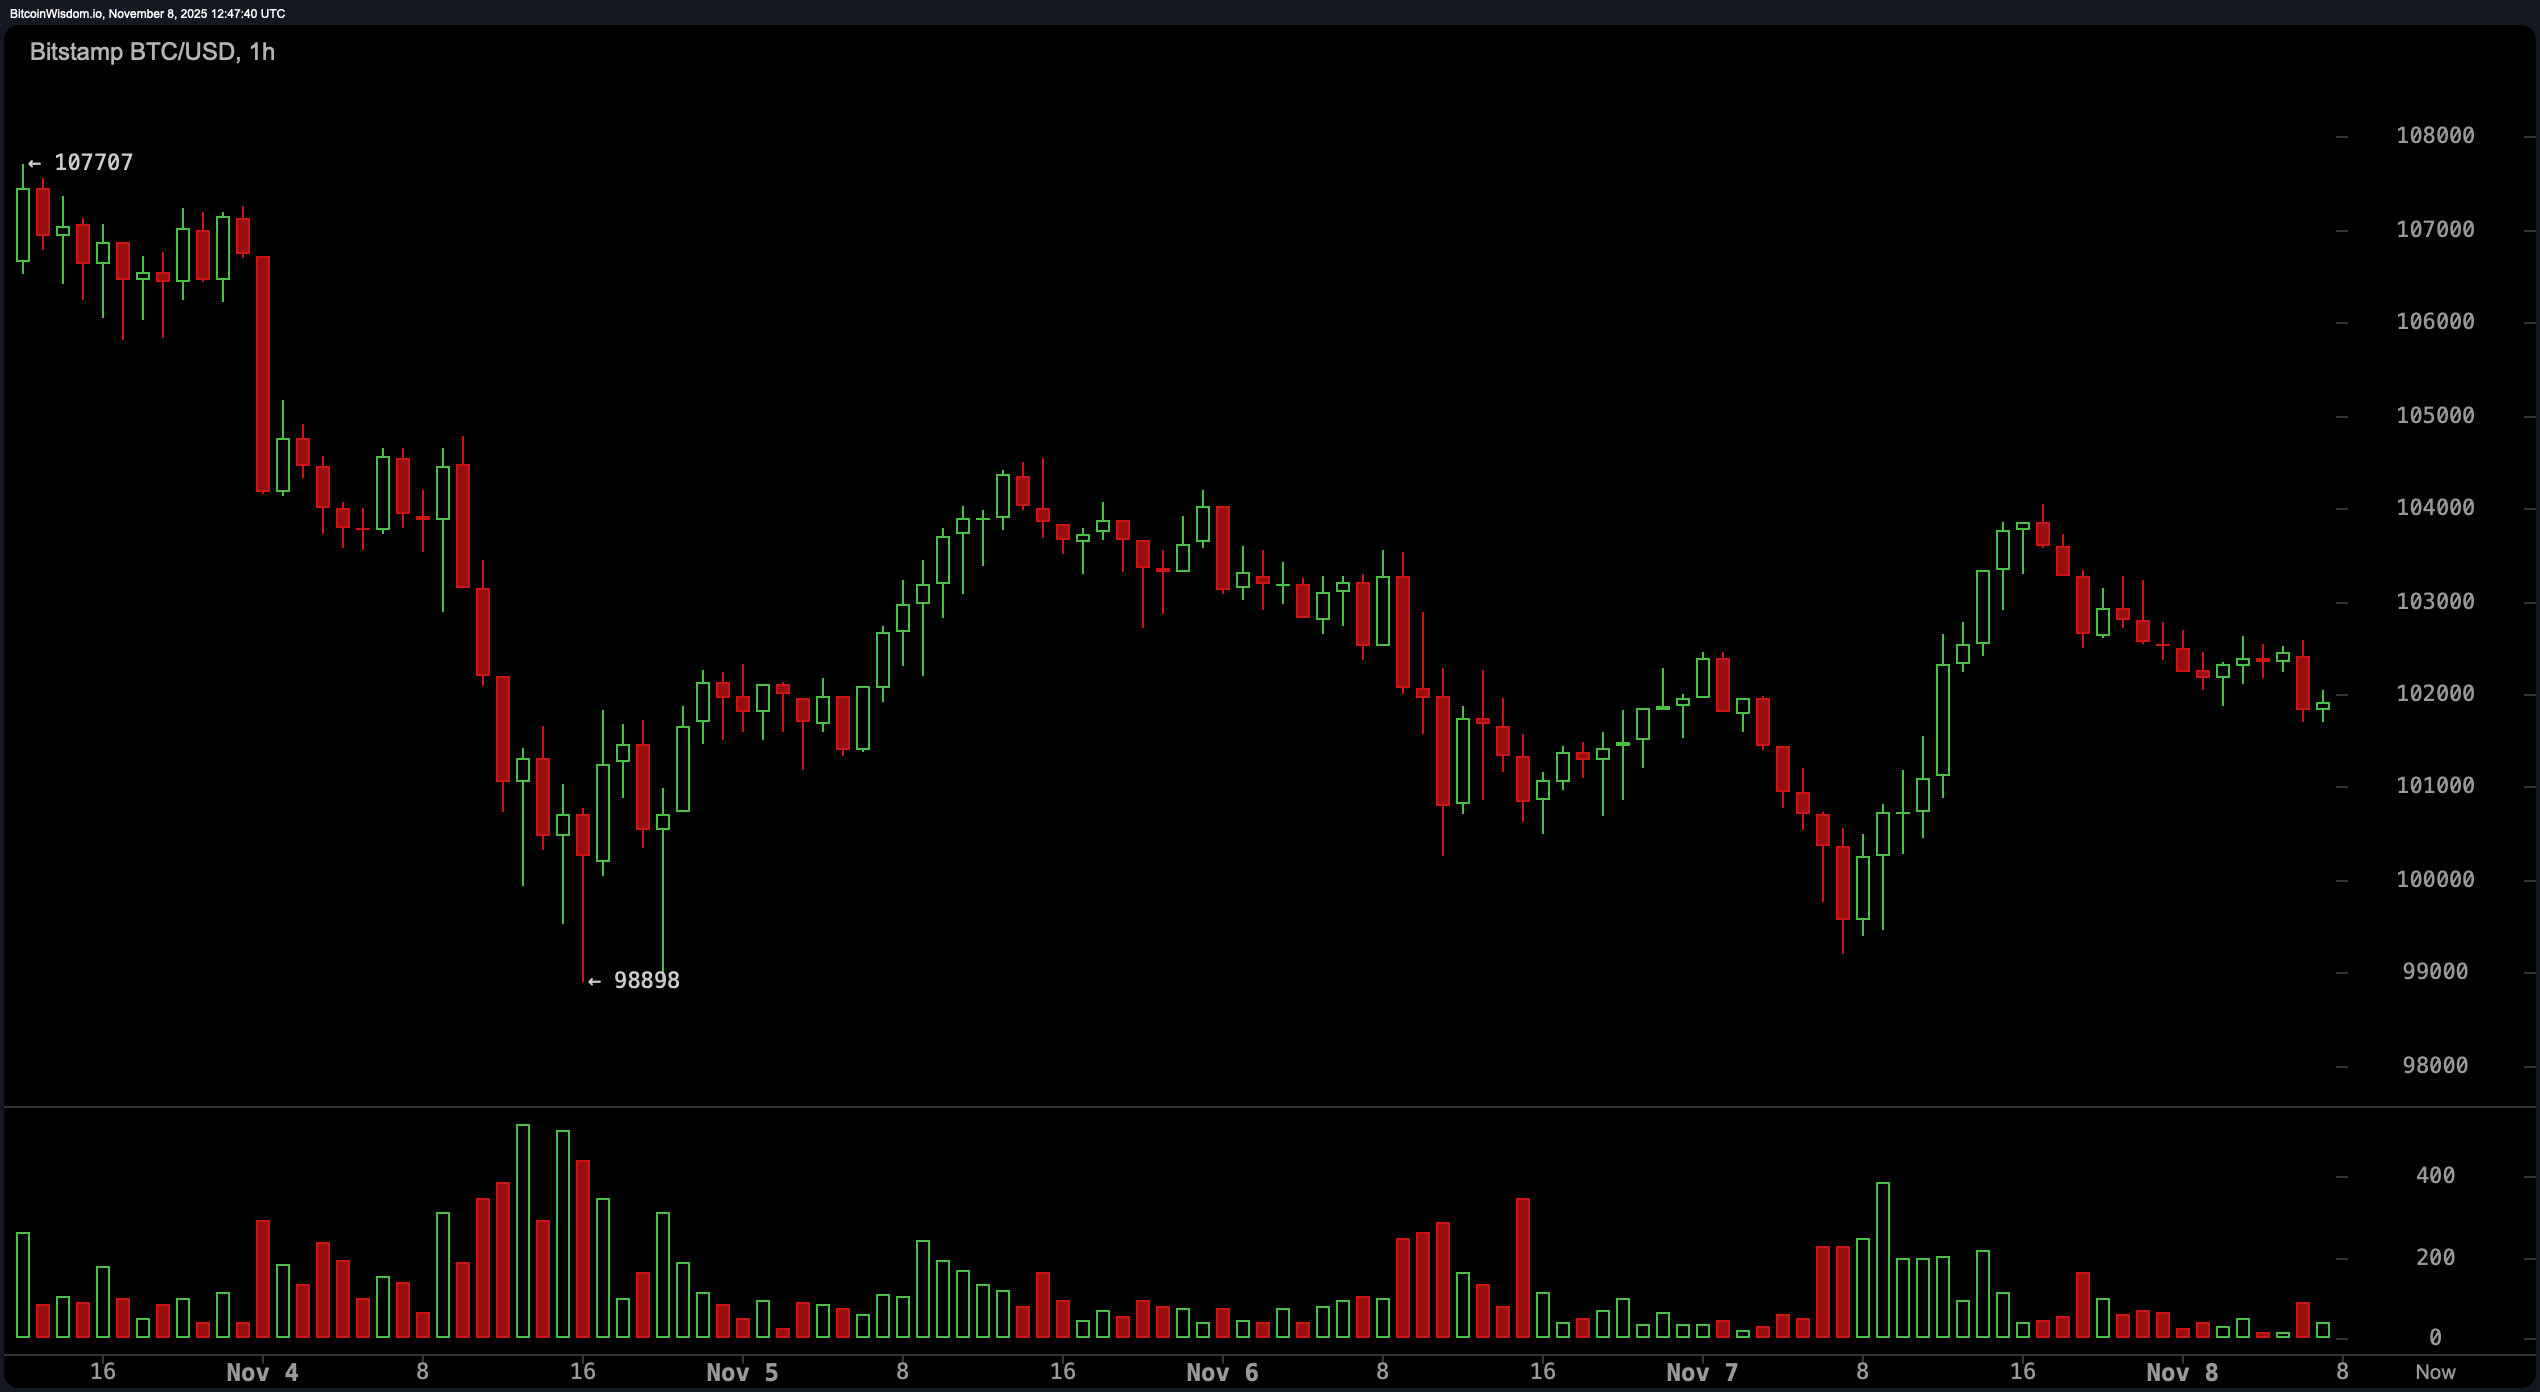
The four-hour chart echoes this pattern, with multiple rejections near $104,000 and consistent support around $98,900, forming a short-term base. On the one-hour chart, a micro uptrend is visible, characterized by higher volume near $100,000, suggesting possible accumulation.
Oscillators paint a mixed picture. The relative strength index (RSI) stands at 37, signaling neutral momentum. The stochastic oscillator reads 19, also neutral, while the commodity channel index (CCI) at −125 and momentum indicator at −8,178 both indicate emerging positive sentiment. In contrast, the moving average convergence divergence (MACD) level of −2,775 suggests downward momentum, aligning with the awesome oscillator, which shows a value of −8,789. The average directional index (ADX) at 25 underscores the ongoing consolidation by indicating a non-trending environment.
All key exponential moving averages (EMAs) and simple moving averages (SMAs) across 10 to 200 periods are positioned above the current price and continue to slope downward. The 10-period EMA and SMA are at $105,102 and $105,674, respectively, while the 200-period EMA and SMA stand at $108,101 and $110,249. This alignment strongly confirms the bearish trend over both short and long timeframes.
Volume analysis highlights a surge near the $98,900 low, possibly marking capitulation or strong support accumulation. Subsequent lower volume during the ongoing consolidation suggests market participants are waiting for a decisive breakout.
Critical support remains at $98,900, while resistance at $104,000 must be overcome for a bullish structural shift. A confirmed break of either level on the four-hour chart will likely dictate the next significant price direction.
Bull Verdict:
A sustained close above $104,000 on rising volume could mark a structural reversal in the short term. If bitcoin can hold above that level and push toward $108,000, the current consolidation may transition into a renewed upward trend.
Bear Verdict:
Failure to hold $98,900 support would reinforce the broader downtrend, with a likely extension toward $95,000 or lower. With all major moving averages aligned against the price, downside pressure remains dominant unless a breakout occurs.
FAQ ❓
-
Where is bitcoin trading now?
Bitcoin is trading around $101,987, consolidating between $98,900 and $104,000. -
What is bitcoin’s current market cap?
Bitcoin’s market capitalization stands at approximately $2.03 trillion. -
What price levels should traders watch?
Key levels include support at $98,900 and resistance at $104,000. -
Is the bitcoin trend bullish or bearish?
Current chart patterns and moving averages indicate a bearish trend.