
In what has been described as the largest daily movement of coins aged ten years or more in Bitcoin’s history, a long-dormant whale wallet transferred 80,000 BTC on Friday.
This historic transaction marks the largest movement of old coins in eight years. It sent ripples through the crypto market and has reignited concerns over selling pressure from long-term holders.
Bitcoin Market Stunned as Early Miner Moves $8.6 Billion in BTC
A long-dormant BTC whale, believed to be an early miner, shook the crypto market on Friday. The entity moved 80,000 BTC—worth approximately $8.6 billion—across four separate transactions of 10,000 BTC each.
According to Arkham Intelligence, the coins, which had been untouched for over 14 years, began moving early Friday morning and were fully sent to new addresses by 15:00 UTC. This has been dubbed one of the largest single-day movements of decade-old coins in BTC history.
This entity controlled 161,326 BTC, currently valued at over $17.4 billion. With 80,000 BTC moved, 120,326 BTC still remain untouched in the whale’s wallet.
$110,000 Liquidity Signals Possible Rebound
The movement of long-held coins like this is generally viewed as a bearish signal. The transfers triggered a wave of sell-offs across the BTC market, pushing the king coin to close around the $107,000 price region on Friday.
Trying to recover from the bearish impact, the coin trades at $108,196, still down a modest 1% over the past 24 hours.
However, despite the short-term bearish pressure, on-chain data suggests bullish strength remains intact. According to Coinglass, BTC’s liquidation heatmap shows a dense liquidity cluster around the $110,567 price mark.
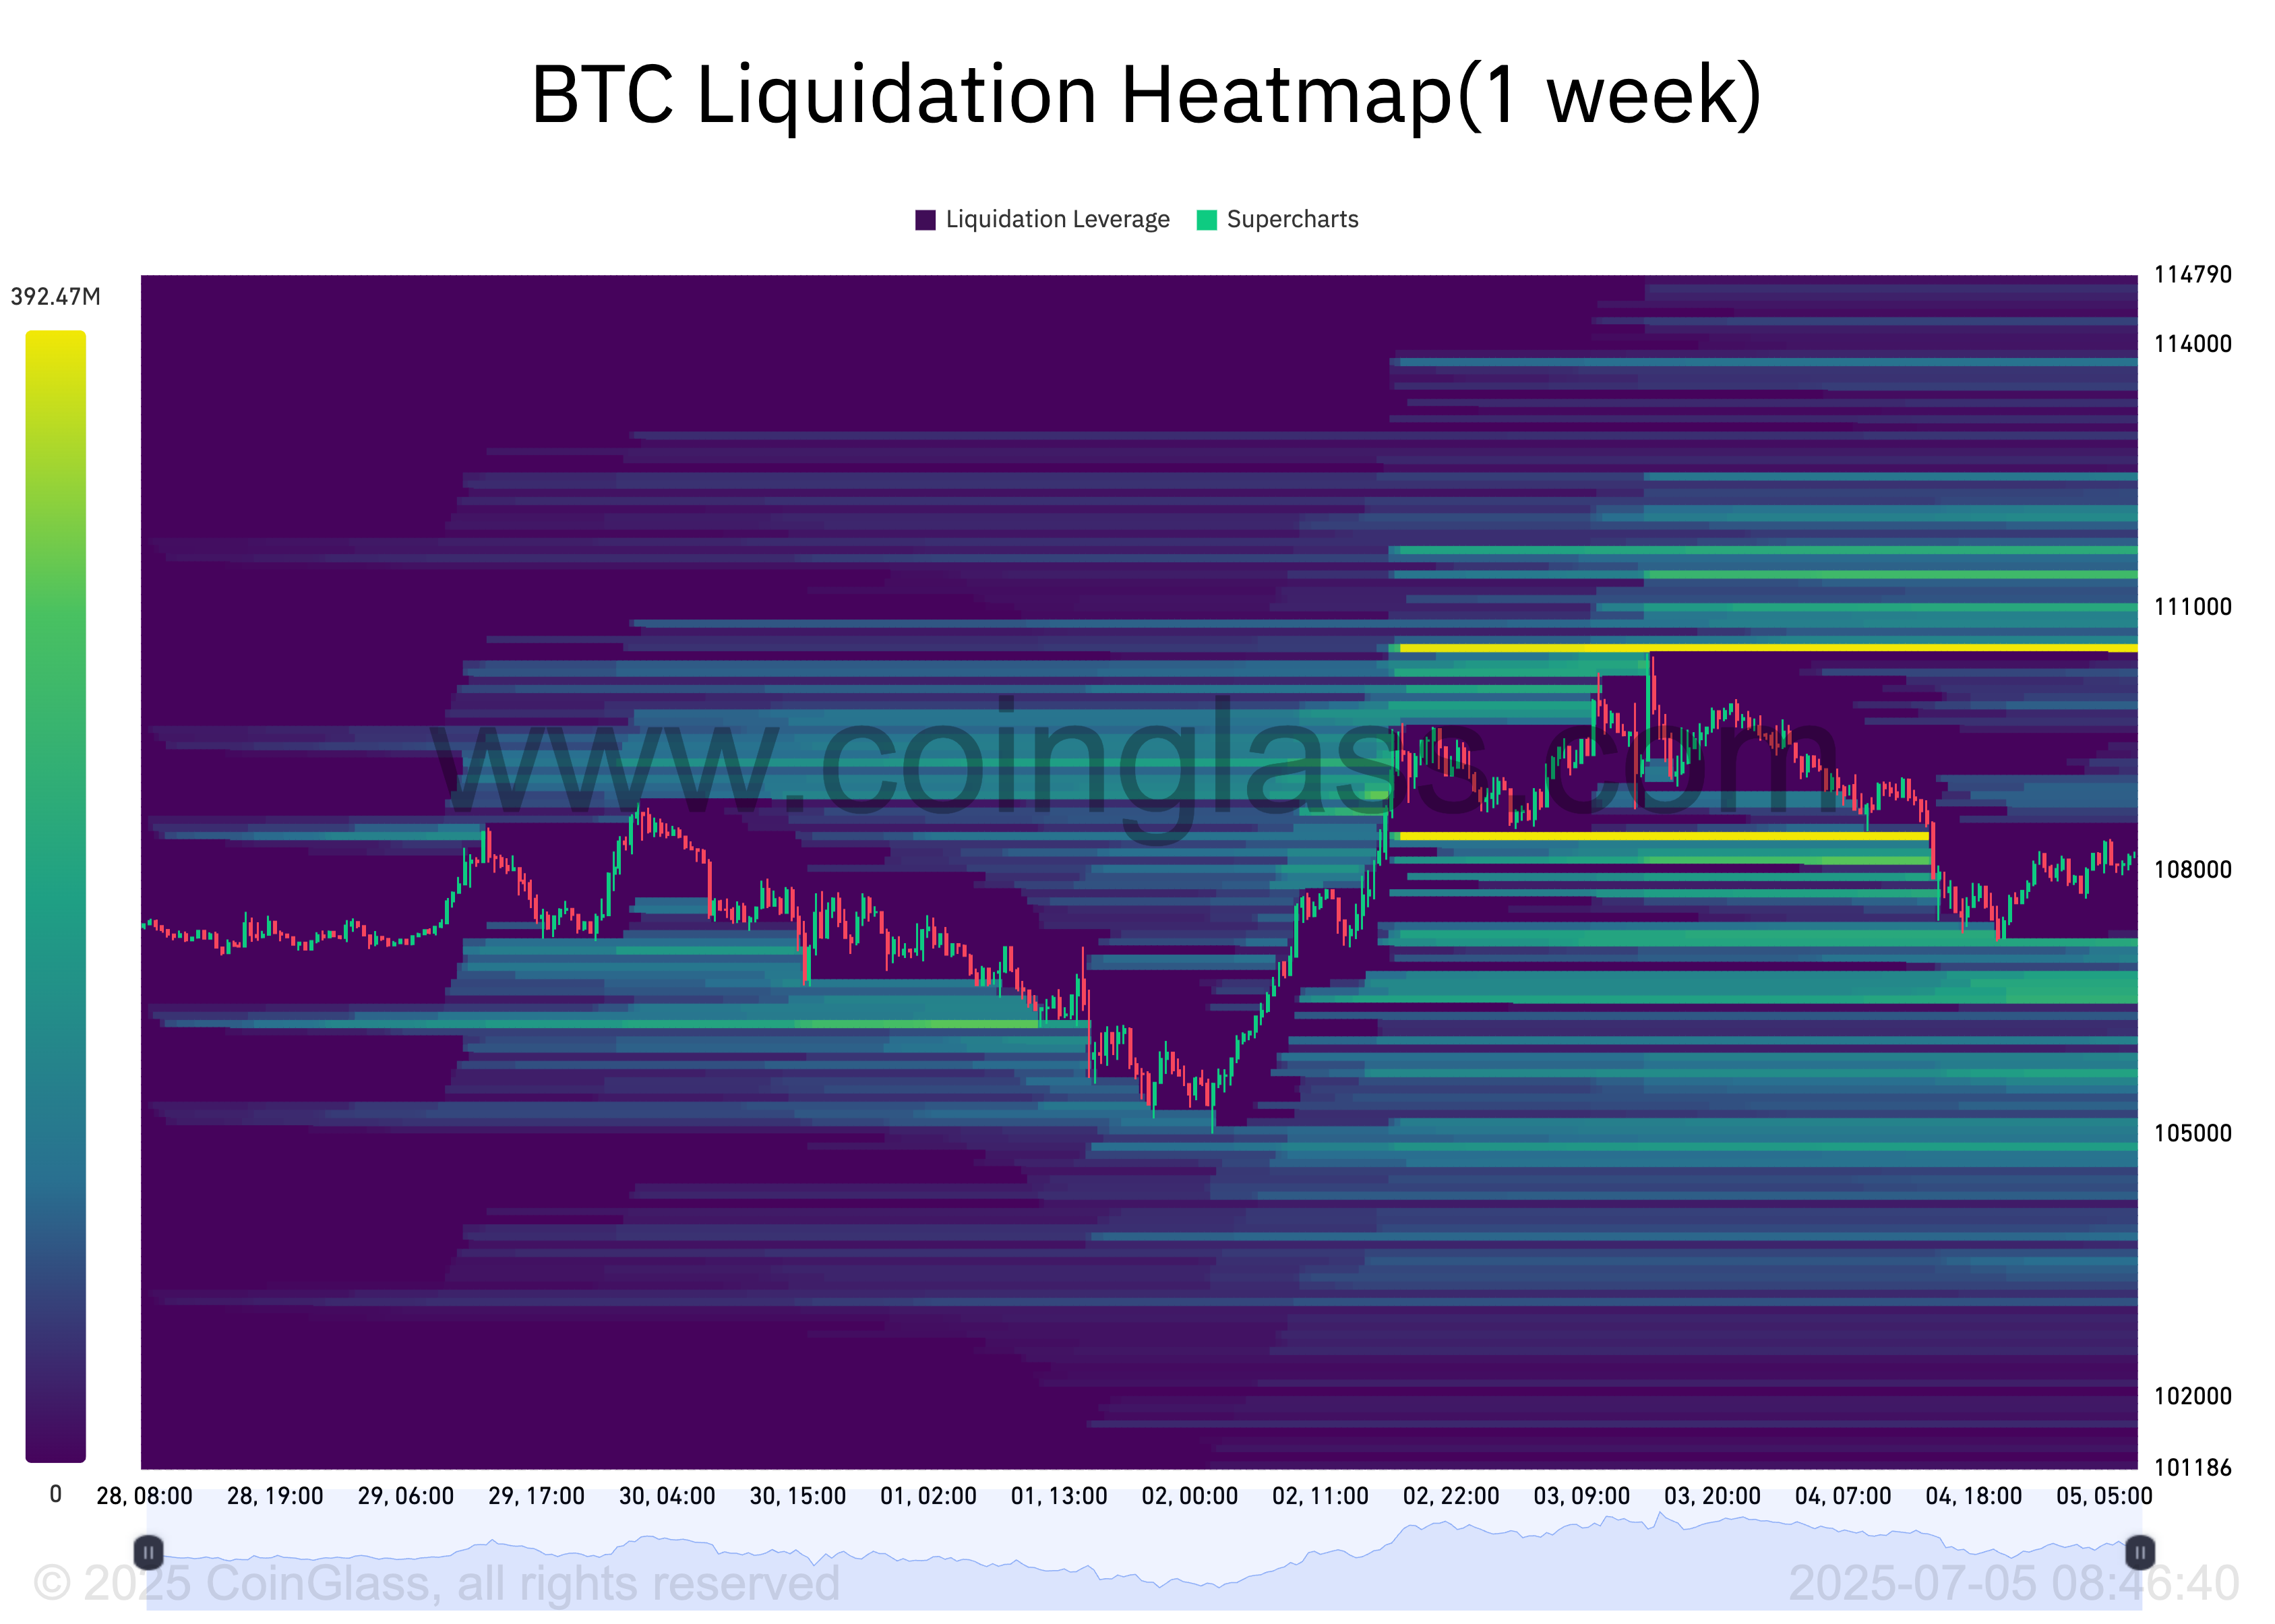
Liquidation heatmaps are tools for identifying price levels at which large clusters of leveraged positions are likely to be liquidated. These maps highlight areas of high liquidity, often color-coded to show intensity, with brighter zones representing larger liquidation potential.
These liquidity zones act like magnets for price action, as markets naturally move toward them to trigger stop orders and open new positions.
In BTC’s case, the liquidity cluster around the $110,567 level signals strong trader interest in buying or covering short positions at that price. This setup could propel a near-term rally if bullish momentum overpowers the sell-side pressure in the BTC spot markets.
Futures Traders Remain Resilient
BTC’s funding rate has remained positive despite the recent whale activity. As of press time, it is 0.006%, indicating that futures traders are still bullish and maintaining long positions on the leading coin.
A funding rate is a periodic payment exchanged between traders in perpetual futures markets, designed to keep contract prices aligned with the spot market. When the funding rate is positive, traders holding long positions pay those holding short positions, signaling a bullish sentiment in the market.
Conversely, a negative funding rate means short positions are paying longs, reflecting increased bearish sentiment and expectations of a price decline.
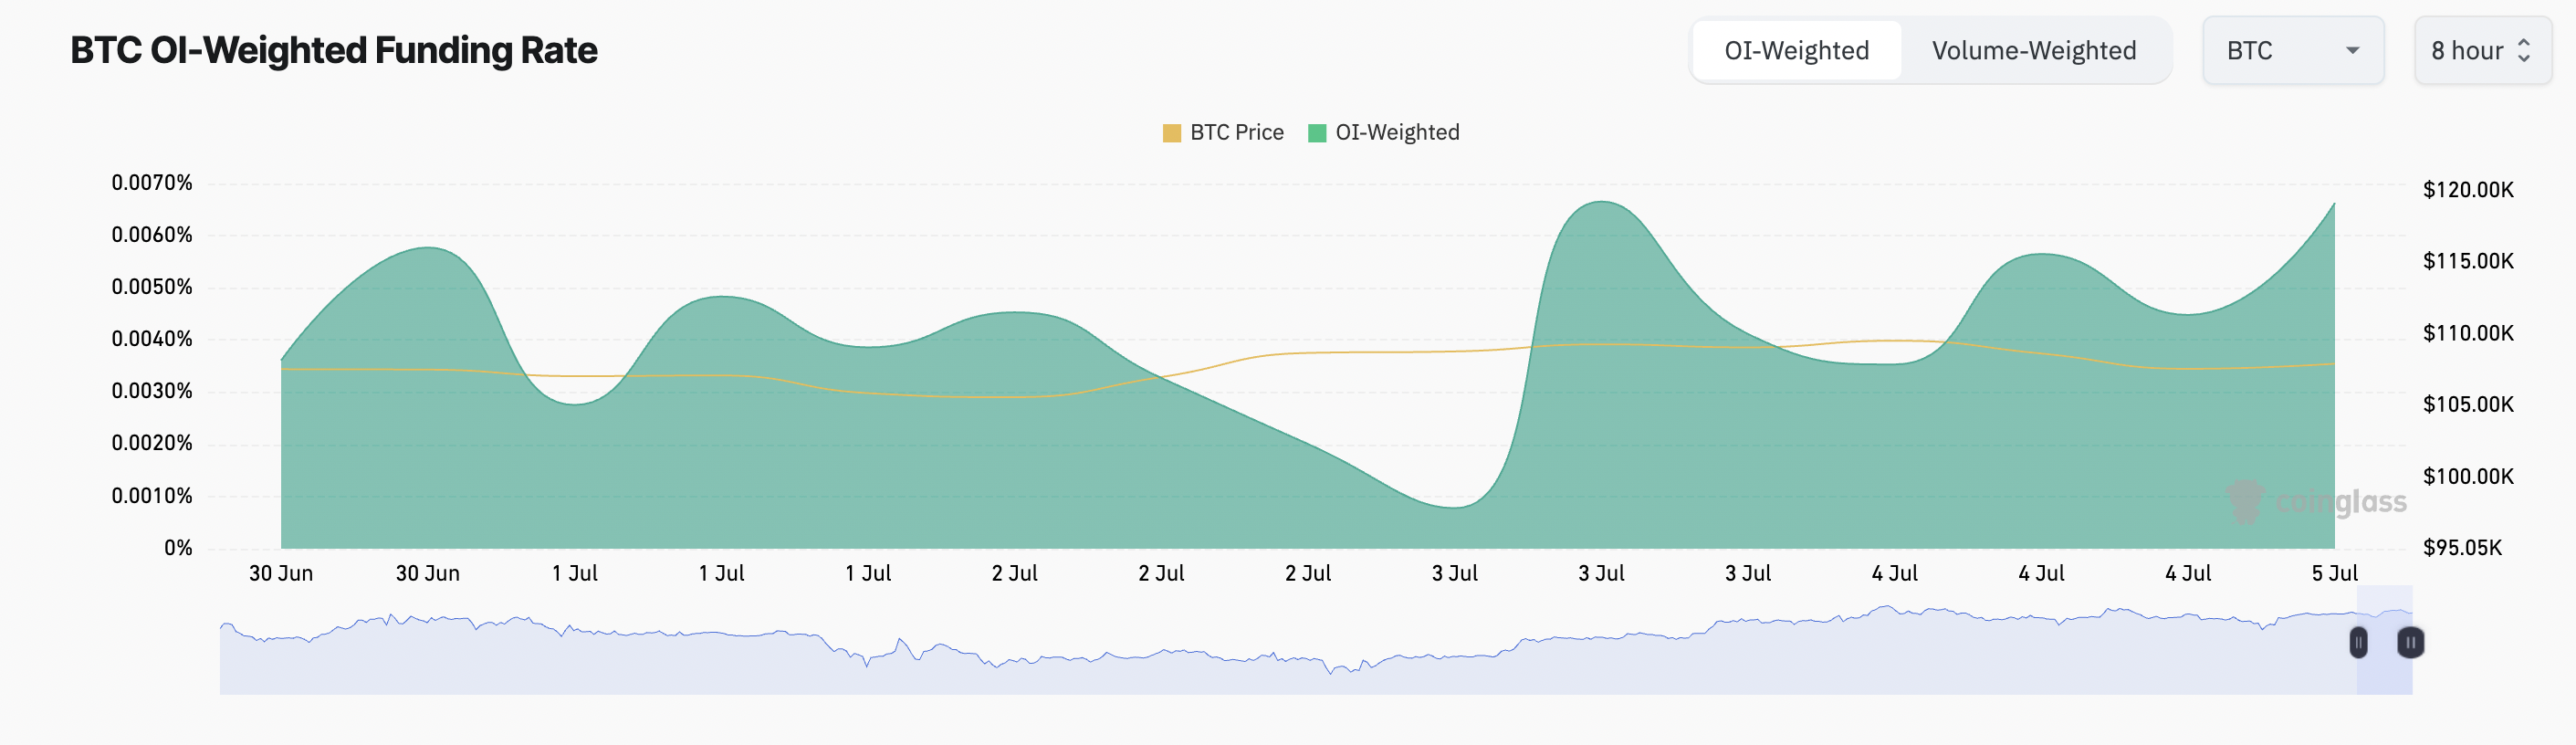
In BTC’s case, the steady positive funding rate—even after the massive movement of long-dormant coins—suggests that traders remain confident in the asset’s long-term strength.
BTC Holds Ground After Whale Moves: Is $110,000 the Next Target?
Although the awakening of the dormant market spooked some traders and prompted them to sell, the metrics assessed above still show that the BTC market is absorbing the bearish pressure from the supply spike without a full sentiment shift. There has been no full sentiment shift, as many traders are still positioning for further upside.
If this bullish sentiment holds, the coin could regain strength and rally toward $109,267. A break above this level could prompt a run toward $110,442.
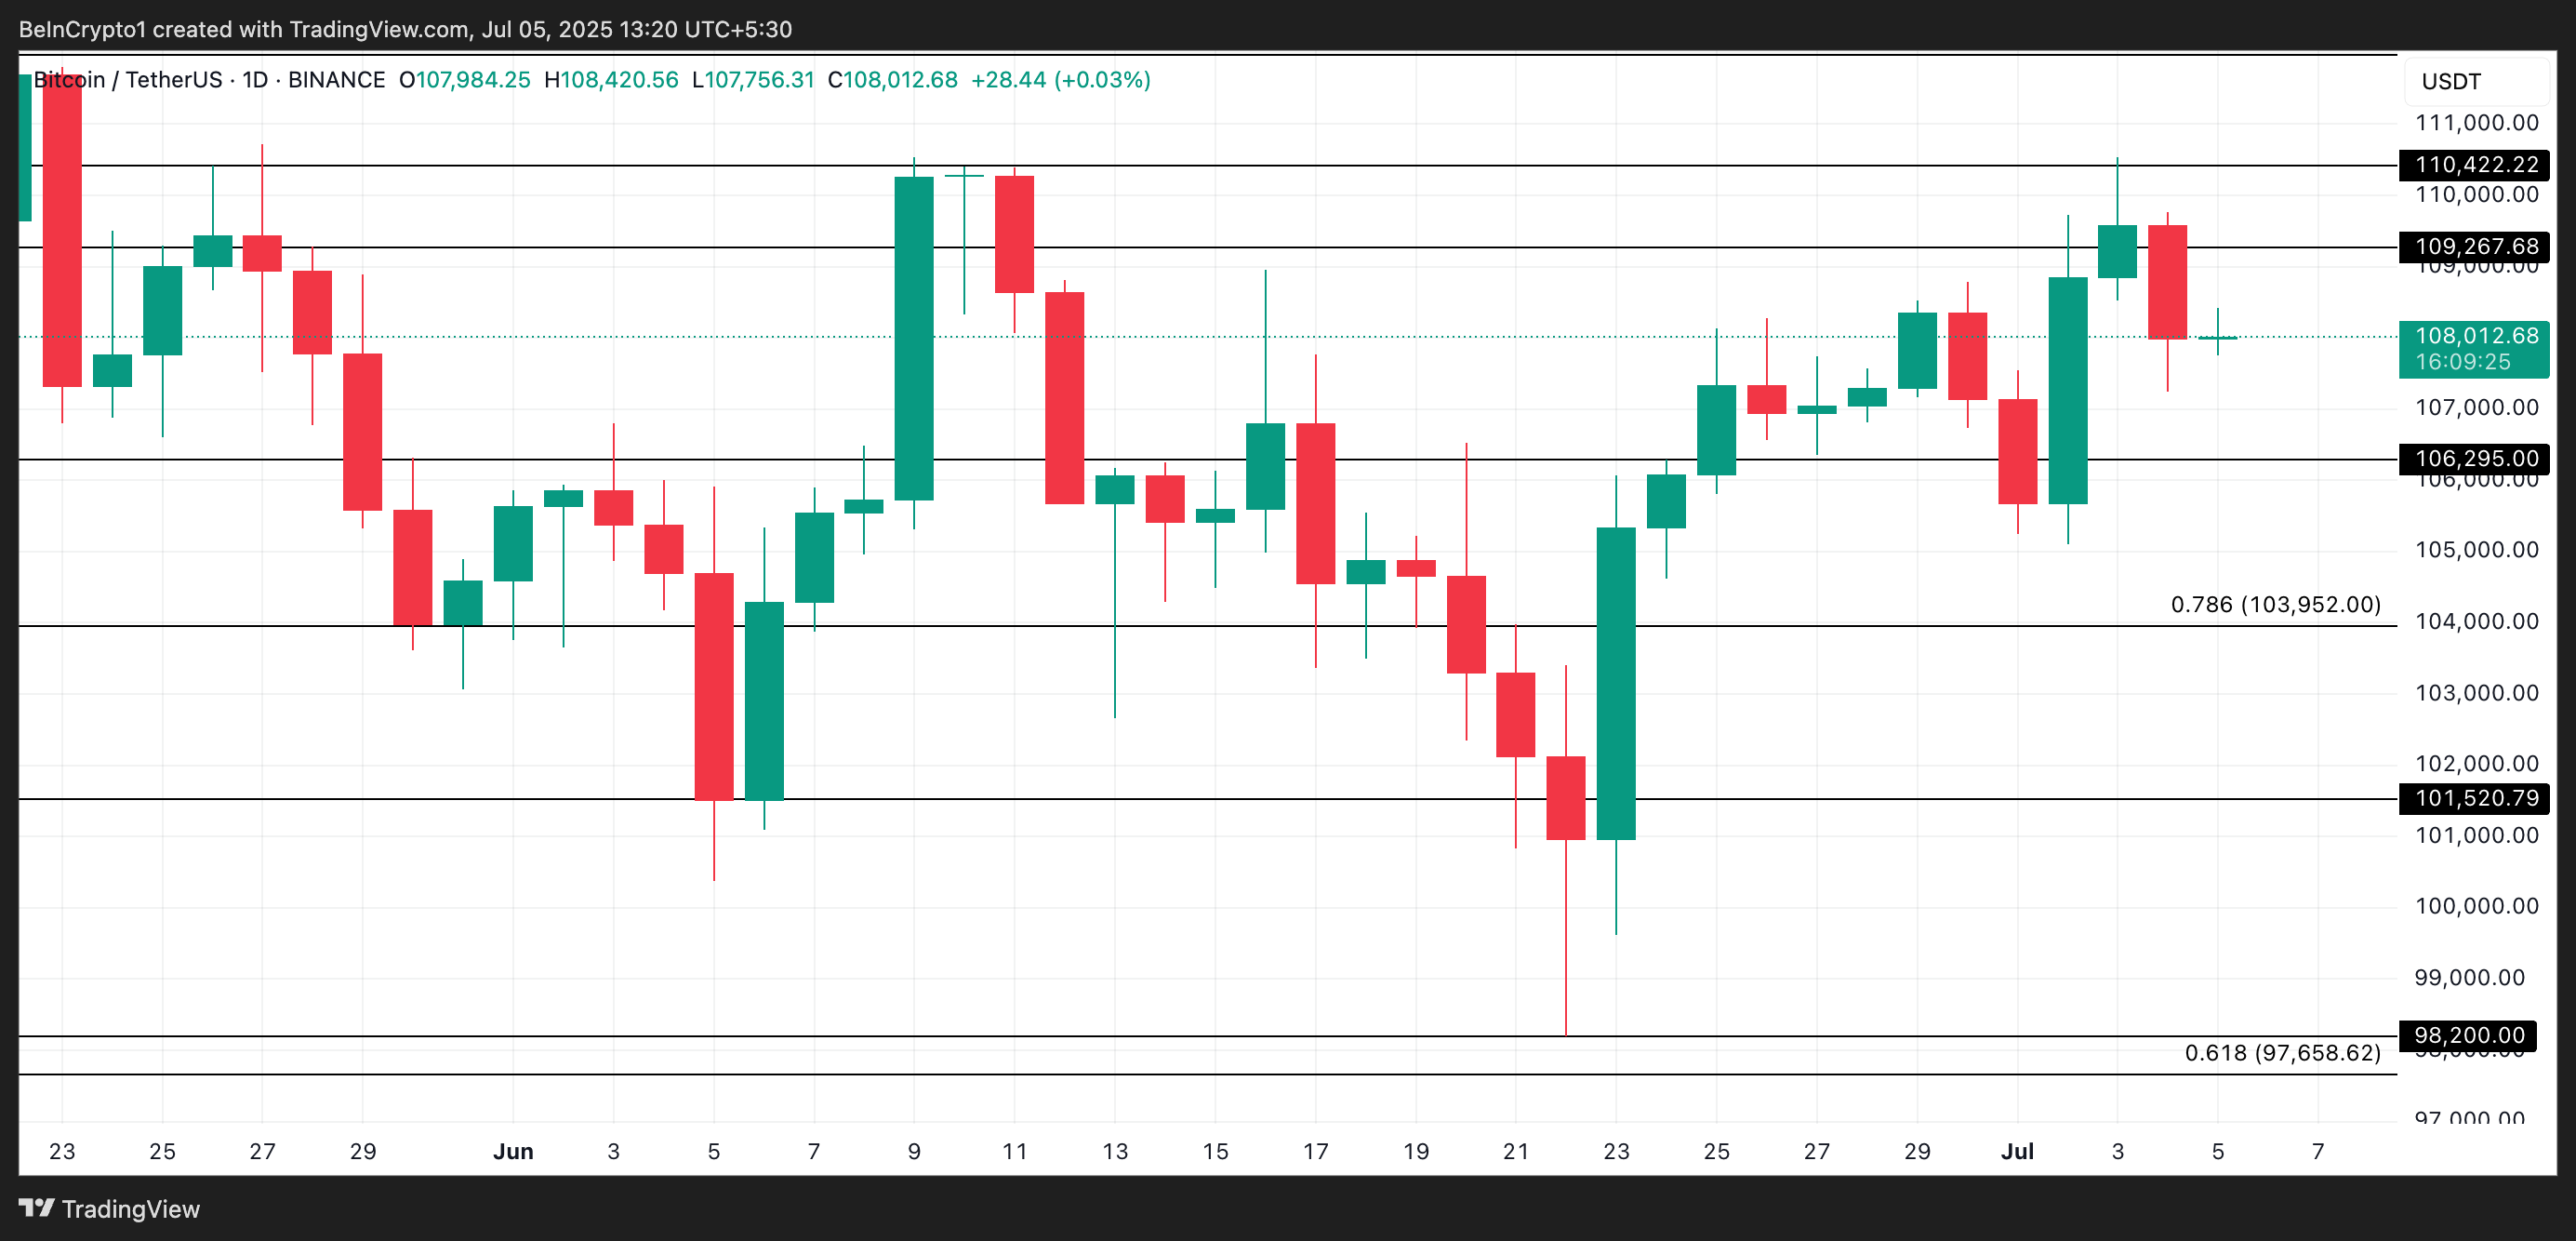
However, if selloffs spike, Bitcoin’s price could slip to $106,259. If there is a stronger bearish momentum, the price could further drop towards $103,952.