Key takeaways
- BTC is down 7% in the last 24 hours and is now trading around $81k per coin.
- The leading cryptocurrency could drop towards the $80k level if the bearish trend continues.
BTC continues to underperform
The cryptocurrency market has continued its poor performance in November. Bitcoin has lost 9.6% of its value in the last 24 hours and temporarily dropped below the $82k level.
The bearish performance comes amid a massive selloff in the market. JPMorgan analysts led by managing director Nikolaos Panigirtzoglou stated in a report earlier this week that the ongoing selloff is driven mainly by retail selling of spot bitcoin and ether ETFs rather than crypto-native traders. The analysts added that,
“While crypto native investors were responsible for the crypto market correction in October via heavy deleveraging in perpetual futures, this previous deleveraging in perpetual futures appears to have stabilised in November. Instead, it has been non-crypto investors, mostly retail investors who typically use spot bitcoin and Ethereum ETFs to invest in the crypto market, that appear to have been mostly responsible for the continuation of the crypto market correction in November.”
The selloff has also affected altcoins, with Ether, XRP, and other leading cryptocurrencies in the red.
Bitcoin slips below $82,000
The BTC/USD daily chart is bearish and inefficient as Bitcoin has lost 10% of its value in the last 24 hours. BTC began the week bearish, extending its decline by 2% and closing below the 61.8% Fibonacci retracement level at $94,253.
The $90k support level on Wednesday failed to hold, and Bitcoin has now dumped another 10% since then.. At the time of writing on Friday, BTC is trading down around 83,400.
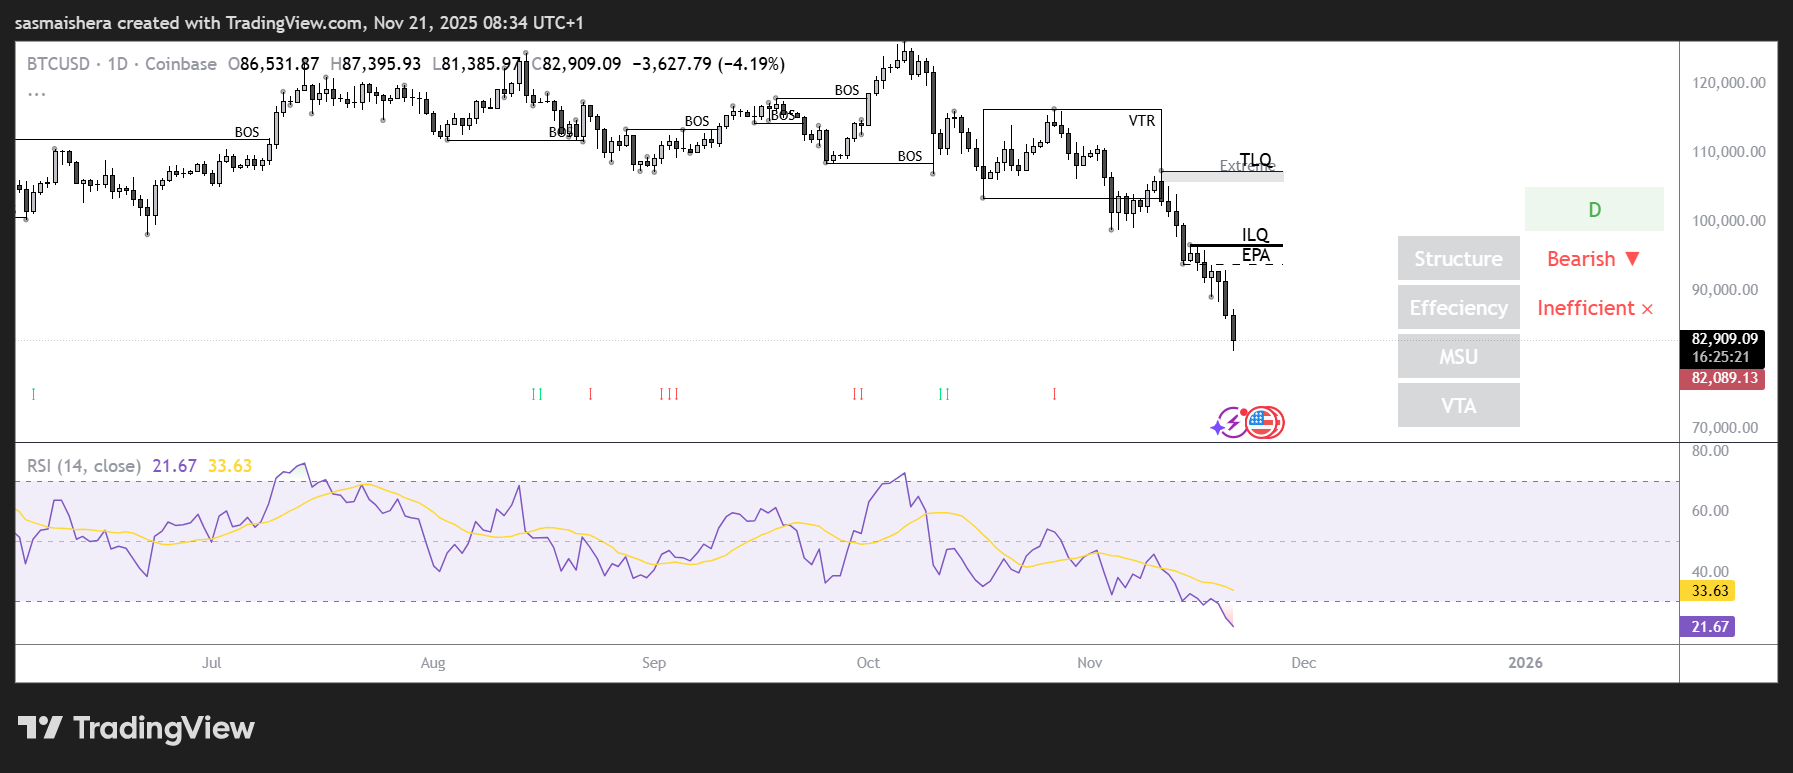
The Relative Strength Index (RSI) on the daily chart stands at 22, indicating strong bearish momentum and oversold conditions for the leading cryptocurrency. The MACD lines are also extremely bearish at the moment.
If the selloff continues and Bitcoin closes the daily candle below the $85k support, it could extend the decline toward the key psychological level at $80,000.
However, if the $85k support level holds in the near term, BTC could rally and hit the next key resistance at $90,000.