Bitcoin’s price held at $91,453, backed by a market capitalization of $1.82 trillion and a 24-hour trading volume of $39.43 billion. Within the last day, its price danced between $90,278 and $91,510, never straying far from its newfound groove.
Bitcoin Chart Outlook
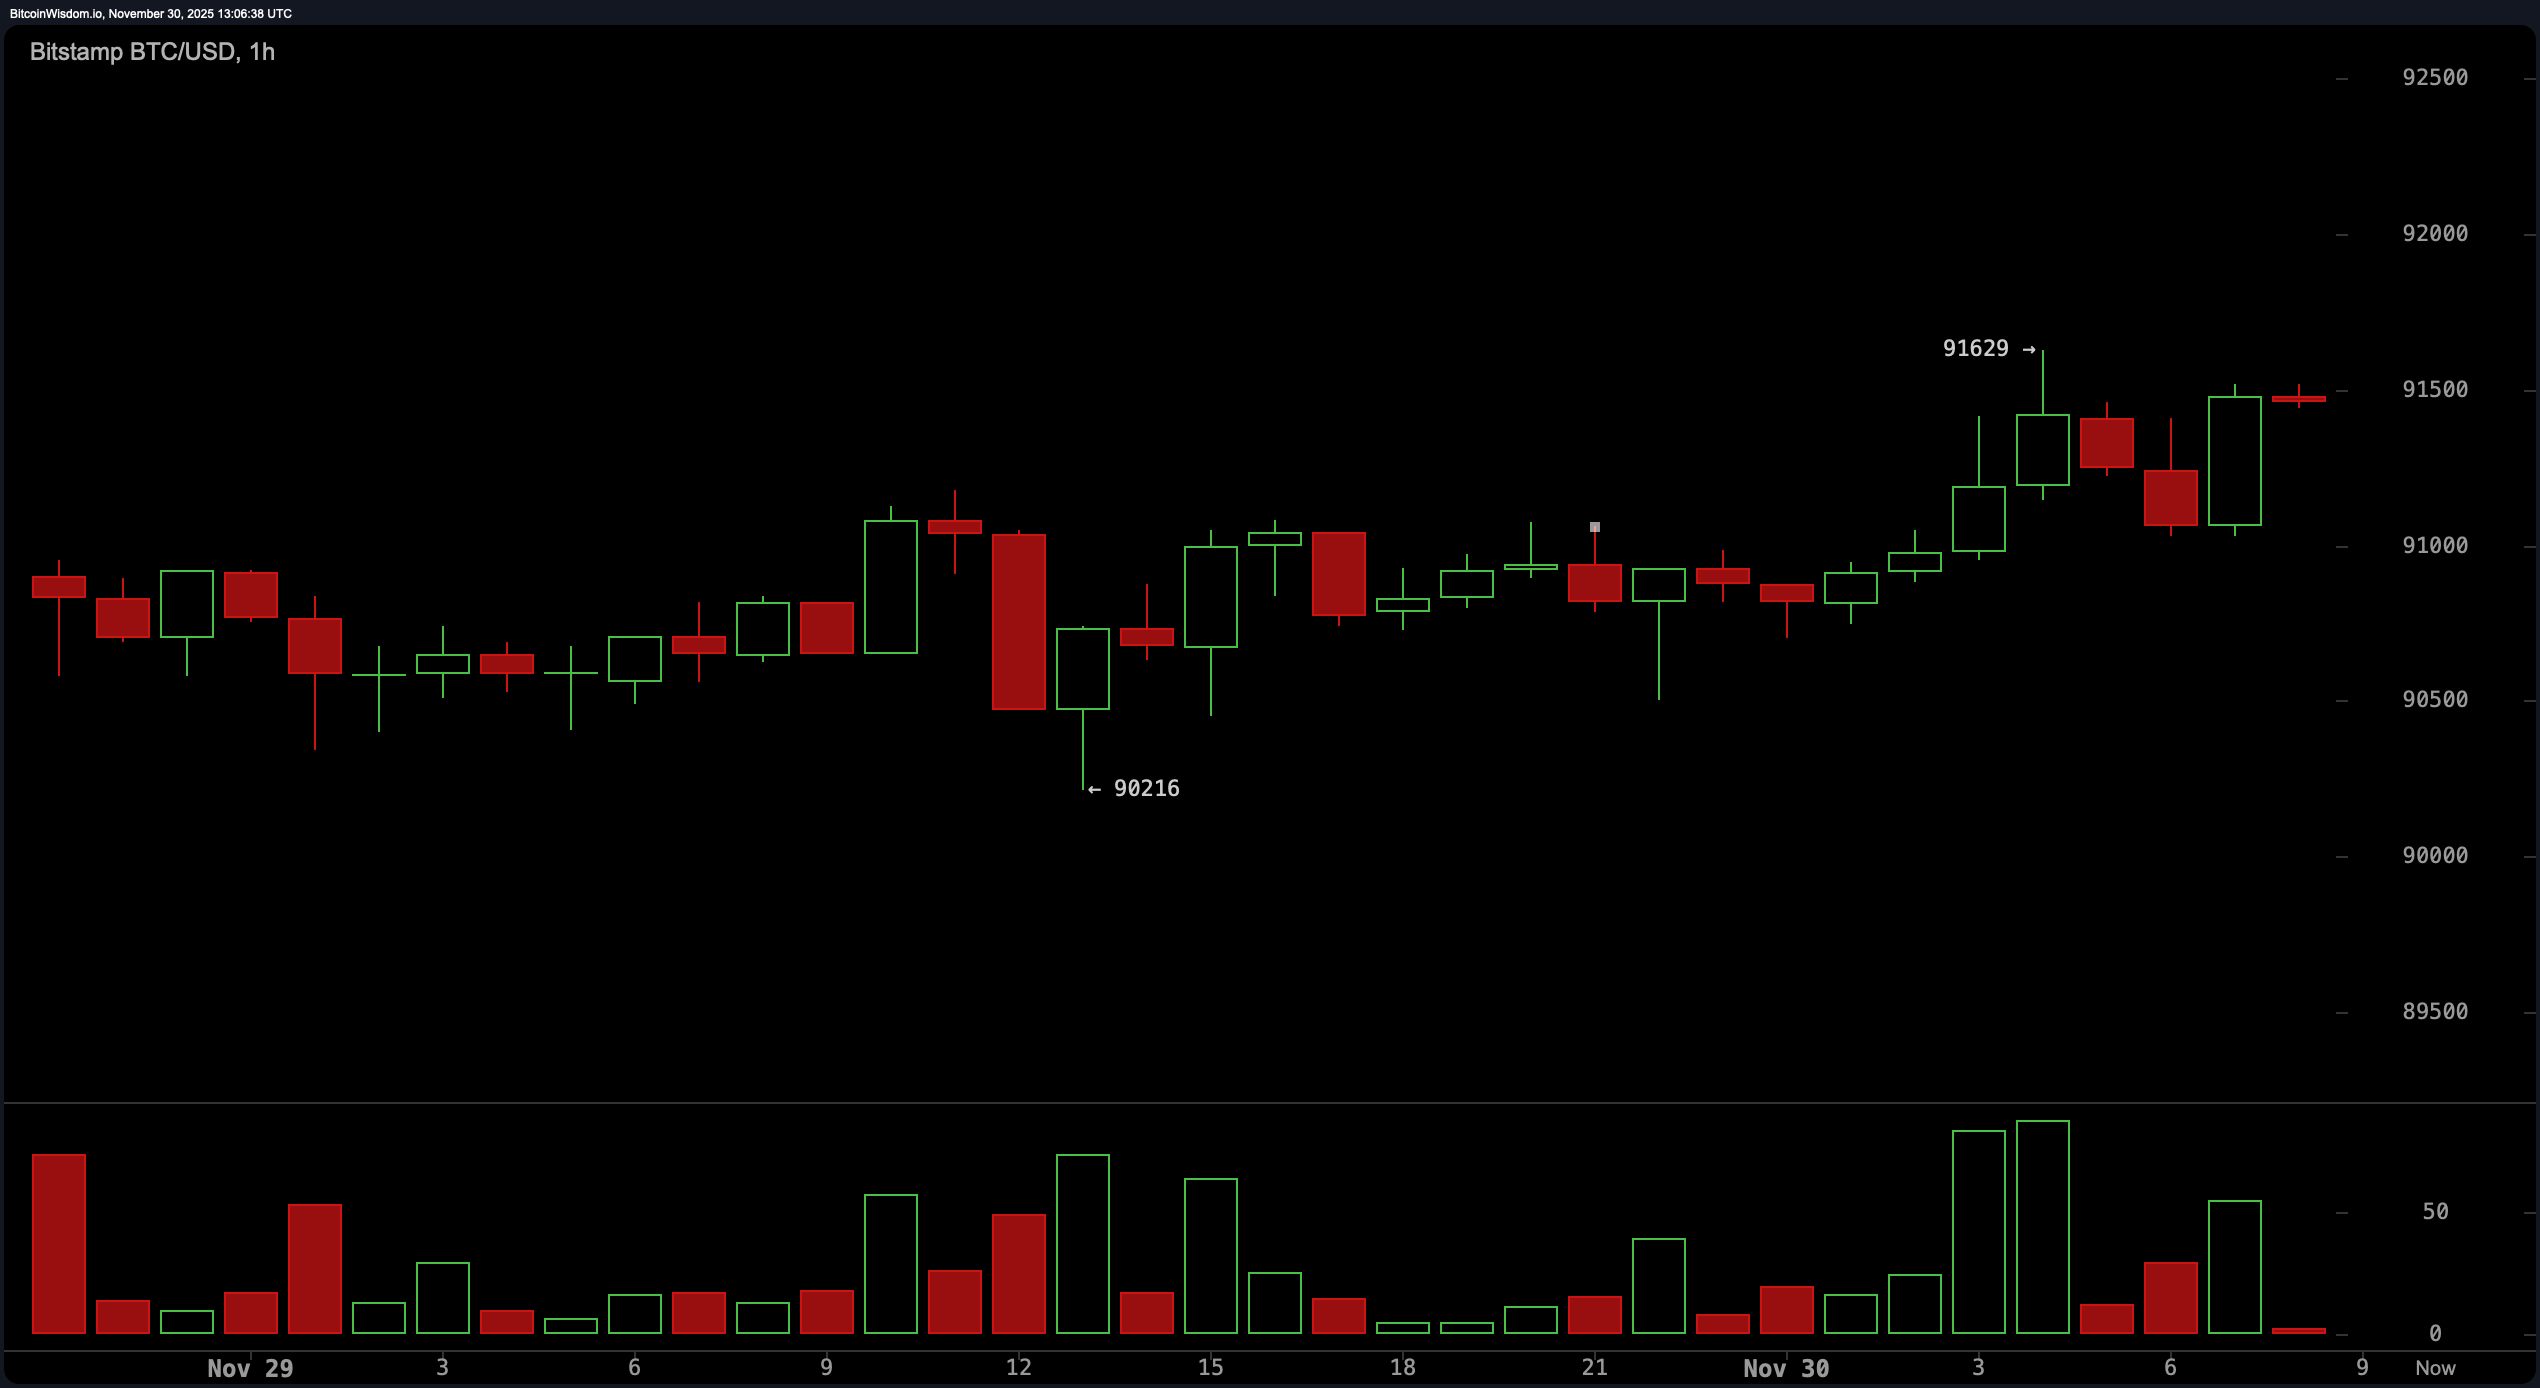
On the 1-hour chart, bitcoin’s rhythm reveals a modestly bullish heartbeat—think cautious optimism rather than euphoric surge. A key pivot formed around $90,800 to $91,200 after a higher low stamped itself at $90,216. Buyers nudged the price upward to $91,629, only to face a wall of hesitation just shy of $92,000. This zone now acts as a soft ceiling with volume tapering—proof that traders are keeping one eye on the exits and the other on momentum’s mood swings.
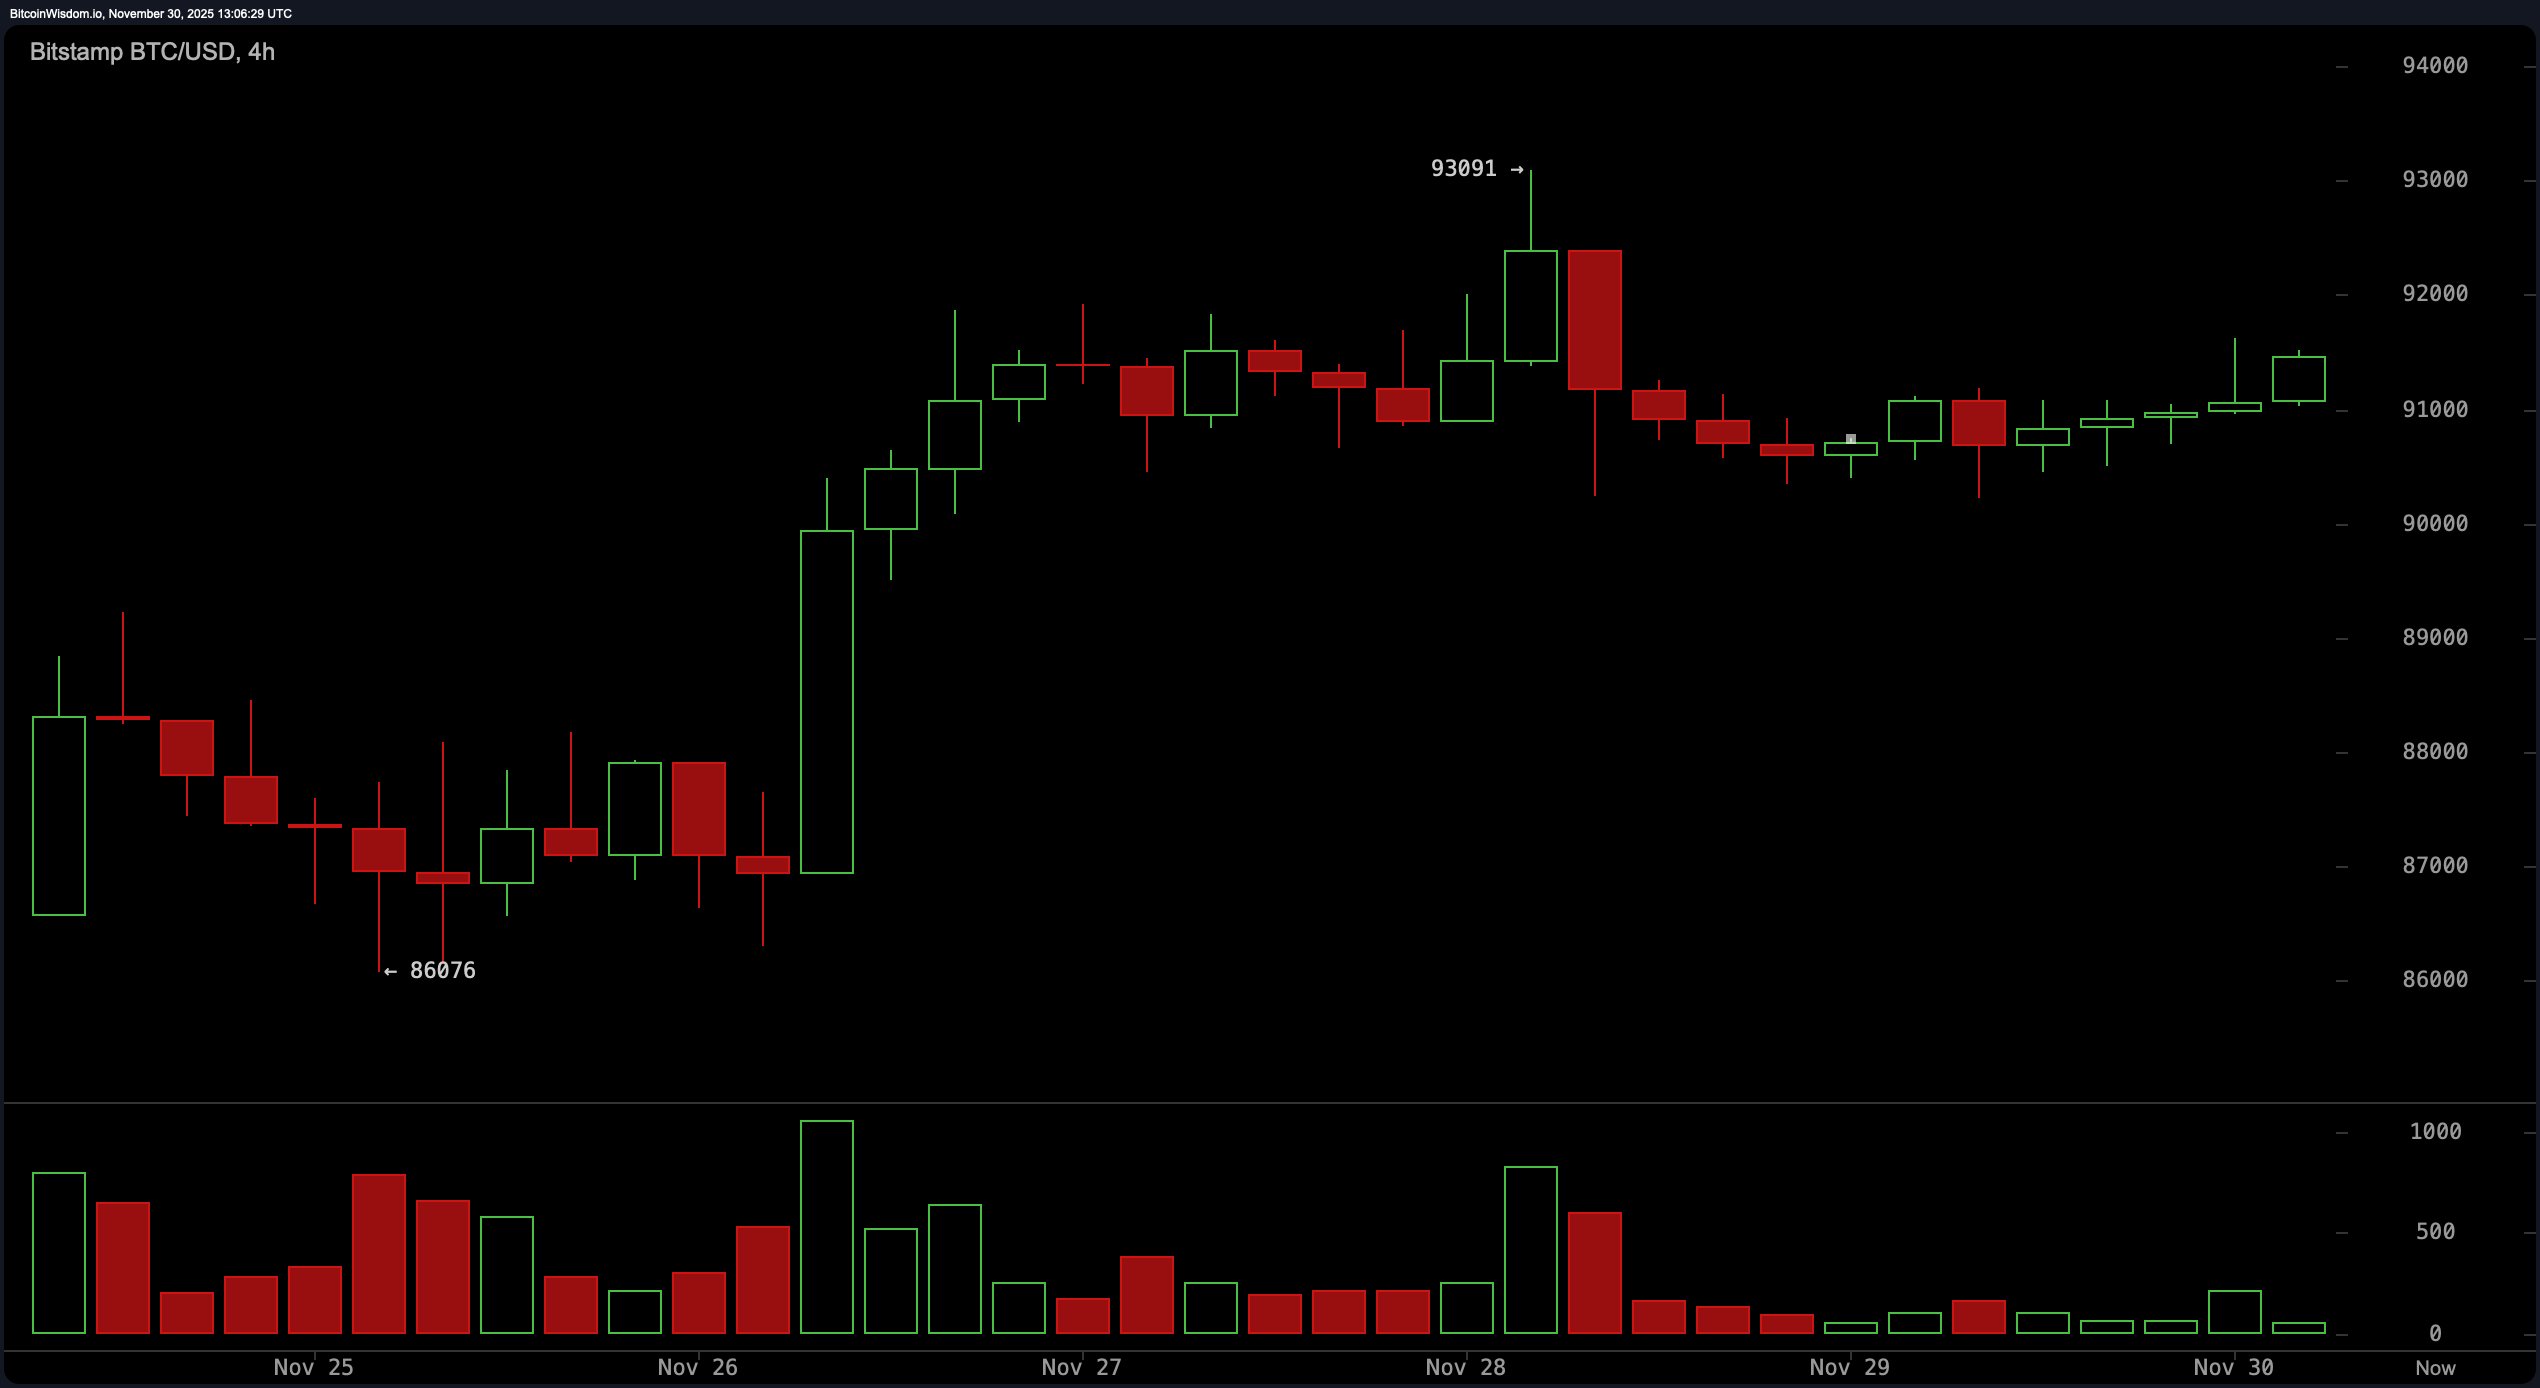
Shifting up to the 4-hour chart, the structure becomes more pronounced. Bitcoin’s latest breakout candle originated from $89,500 to $90,500, a range now reinforced as a structural floor. Price action here is defined by controlled pullbacks and sharp volume spikes at support, signaling accumulation rather than exhaustion. The resistance zone between $93,000 and $93,800, marked by a swift rejection wick at $93,091, shows the bears still have a paw on the chessboard, even if the bulls are calling the plays.
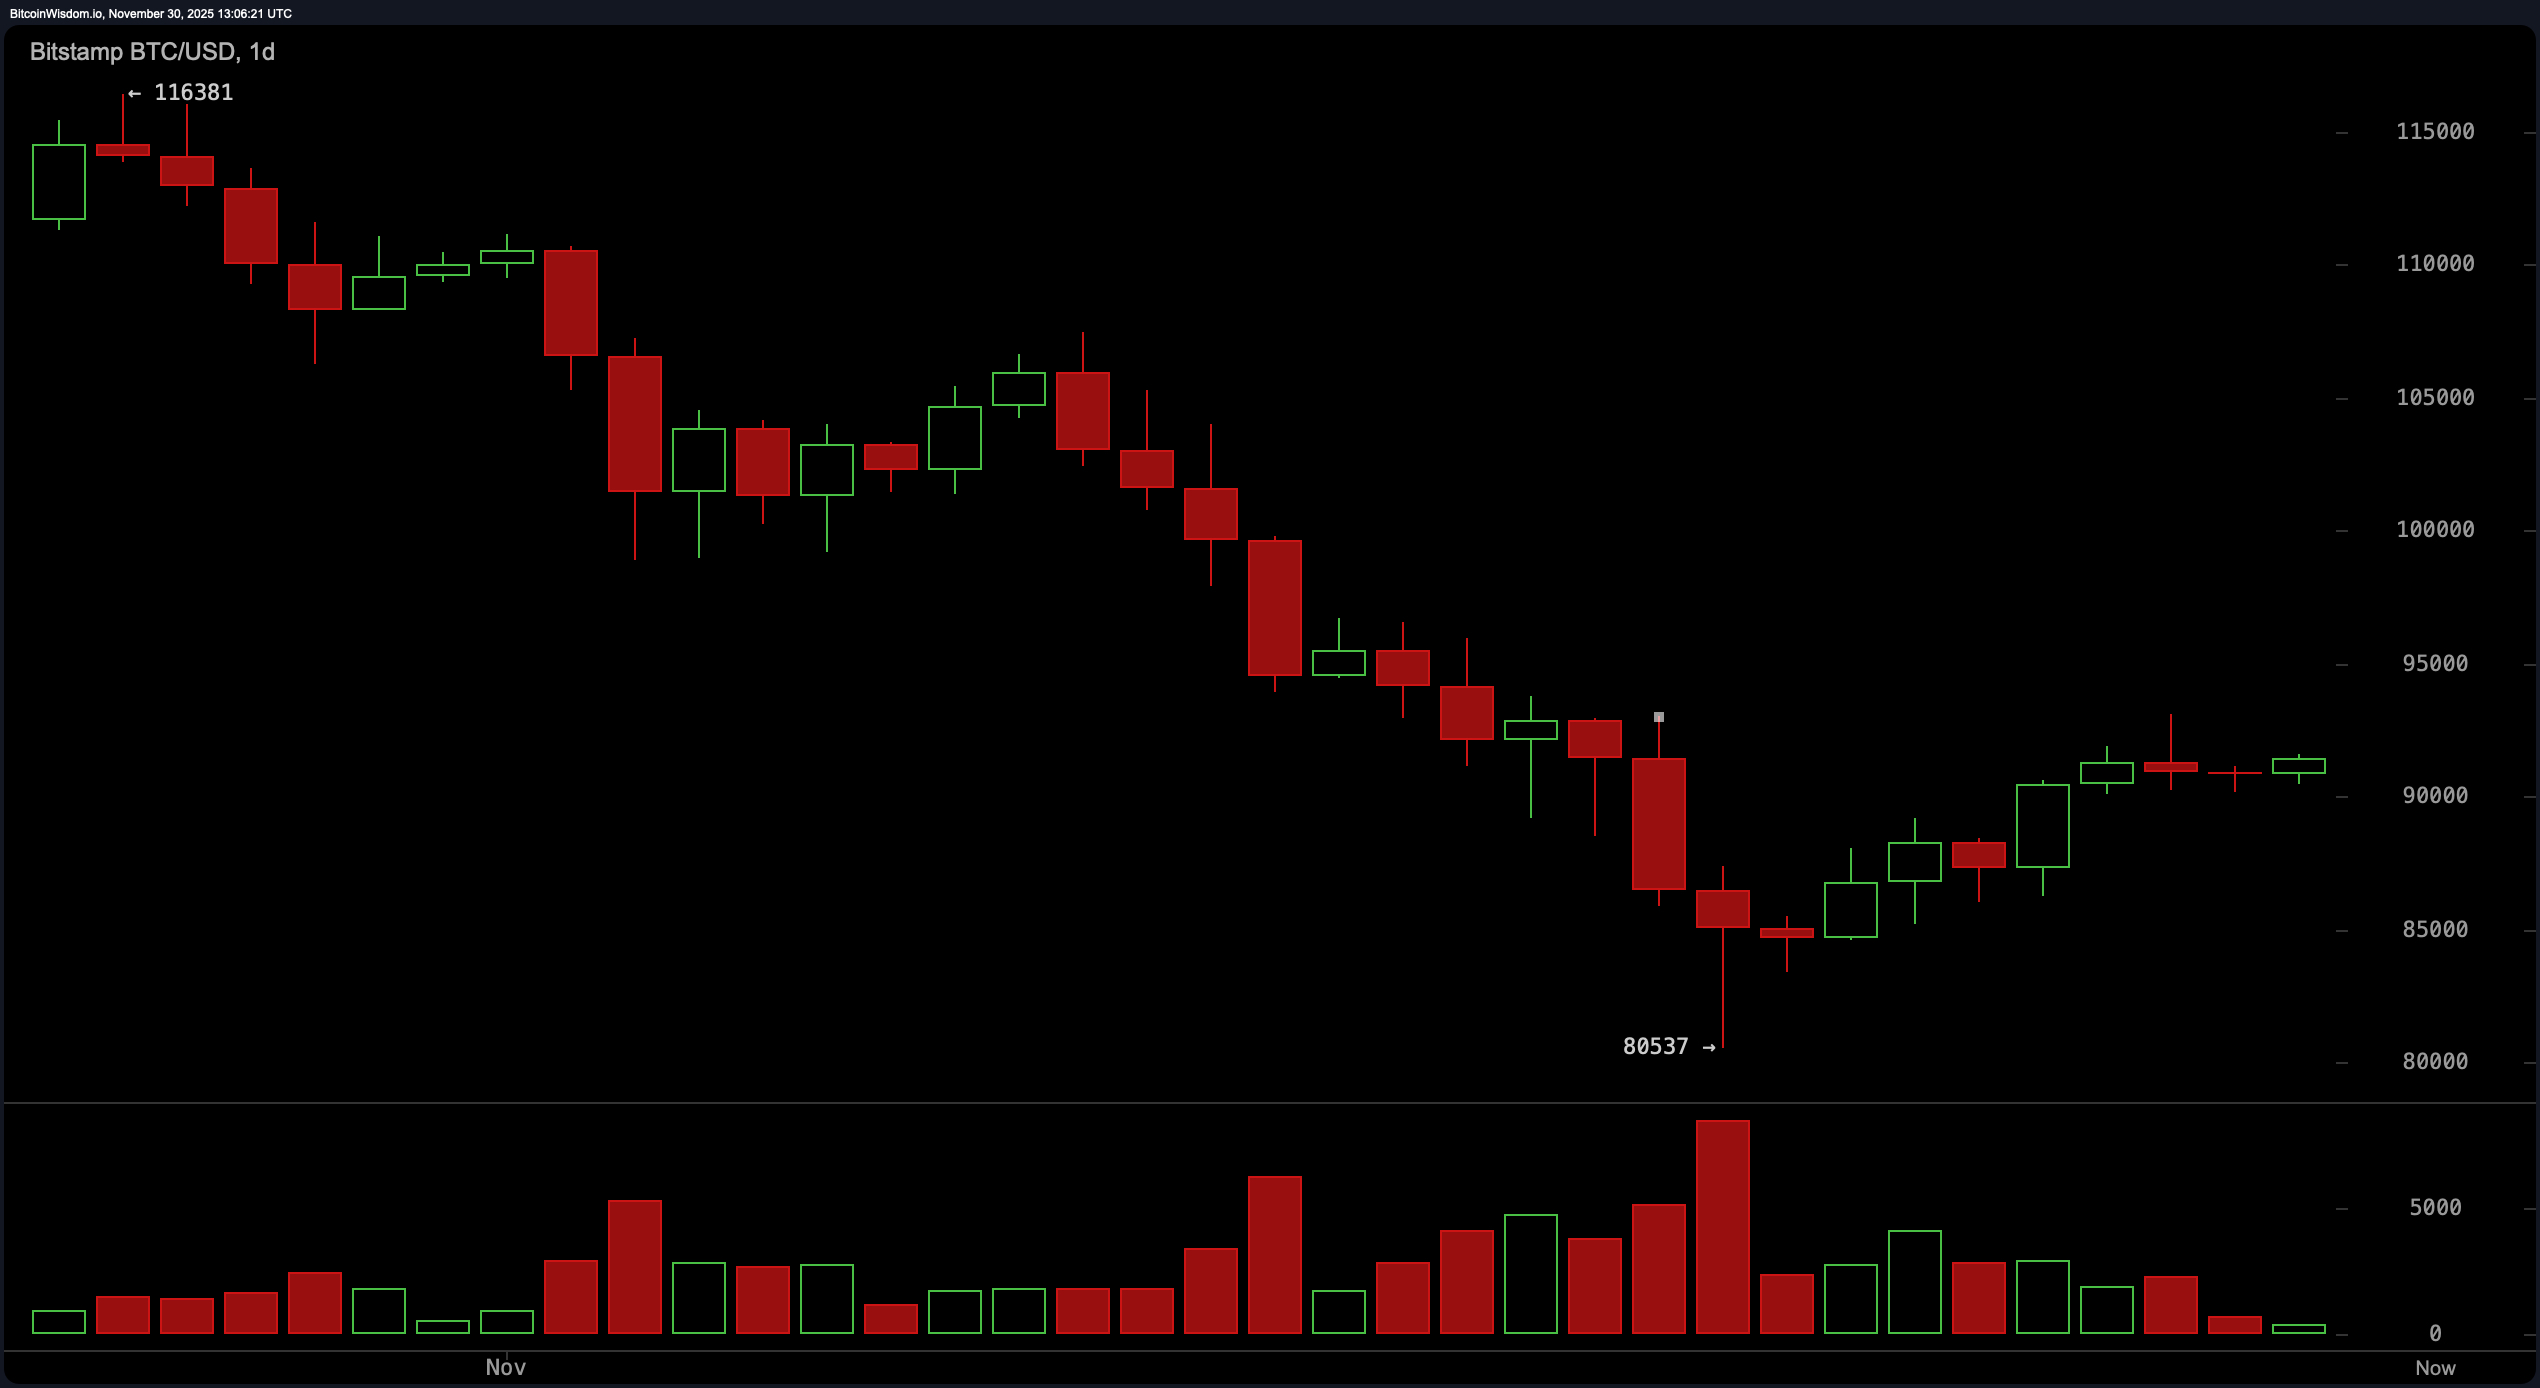
The daily chart tells the tale of a phoenix cautiously rising. After finding footing at the primary support between $80,500 and $82,000, bitcoin has stepped higher, with a higher-low base at $87,000 to $88,500. The current cap between $92,000 and $93,500 is no coincidence—it’s a prior breakdown zone where bullish momentum stalls across timeframes. Without a clean break above this band, the move remains a recovery, not a full-blown reversal.
Oscillators as of the day read like a meditation chant—steady and composed. The relative strength index (RSI) sits at 42, the stochastic at 67, and the commodity channel index (CCI) at −14, all humming a neutral tune. The average directional index (ADX) reads a sturdy 40, confirming trend strength, while the awesome oscillator is down by −7,536 but neutral nonetheless. Notably, momentum shows a positive 4,978 and the moving average convergence divergence (MACD) holds at −3,676, each nudging toward favorable pressure—but let’s not pretend they’re ready to run a marathon.
Moving averages present a more layered reality. Short-term indicators such as the exponential moving average (EMA) at 10 ($90,514) and simple moving average (SMA) at 10 ($88,720) show strength. But the moment you widen the lens to 20-period and beyond, the story cools. From the 20-period EMA at $92,814 to the 200-period SMA at $109,737, every level screams resistance in a crisp, declining slope. It’s a landscape where each step upward faces the long shadow of past overextensions.
In sum, bitcoin is striding—not sprinting—into resistance territory. The charts reveal calculated steps forward, layered with technical friction above $92,000. While the trend leans positive, each move is shadowed by cautious market memory, with short-term optimism needing to meet longer-term conviction before any breakout earns its crown.
Bull Verdict:
Bitcoin’s recent price behavior suggests disciplined strength. A structure of higher lows, momentum support from key indicators, and persistent bids above $90,000 hint at a slow but credible grind upward. A decisive move through $93,500 with sustained volume could mark the beginning of a broader upward trend.
Bear Verdict:
Despite signs of recovery, bitcoin remains capped beneath a historically significant resistance band between $92,000 and $93,500. The majority of longer-term moving averages still slope downward, reflecting residual overhead pressure. Without a breakout above this range, the risk of a retest toward $88,000 or below remains on the table.
FAQ ❓
- Where is bitcoin trading now? Bitcoin is hovering around $91,453 with resistance near the $93,500 level.
- What’s the current market sentiment?Technical indicators show cautious optimism with mixed short- and long-term signals.
- Is bitcoin gaining momentum?Momentum and MACD are turning positive, but overhead resistance remains firm.
- What’s the key support to watch?Strong structural support is forming between $89,500 and $90,500.