Bitcoin’s consolidation has been extended, with the price hovering around the $120K price range. A break below the $116K support is expected, likely pushing the price down toward the $111K region.
Technical Analysis
By ShayanMarkets
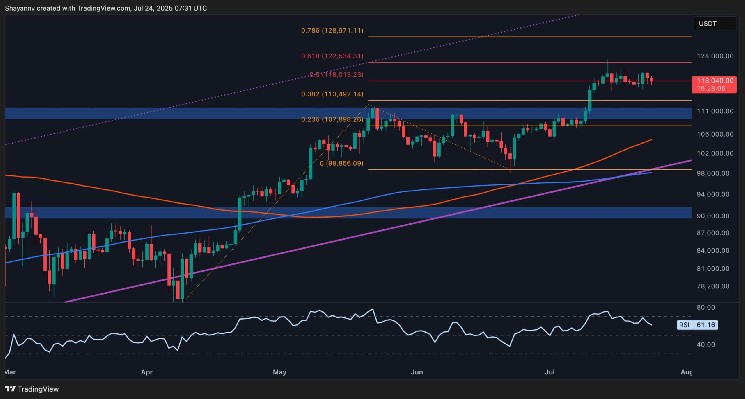
The Daily Chart
Bitcoin’s price consolidation continues just below its all-time high of $123K, hovering between the $116K and $120K levels. This price behavior signals an equilibrium zone, where buying and selling pressure are currently balanced, a sign that the market awaits a fresh catalyst.
Importantly, this range also aligns with the 0.5-0.618 levels of the Trend-Based Fibonacci Extension, adding further technical significance to the current resistance zone. Given the lack of strong bullish momentum, a deeper correction below $116K is likely, with the $111K zone emerging as the next key target.
The 4-Hour Chart
On the lower timeframe, BTC appears to be forming a bullish flag — a classic continuation pattern. Despite multiple rebounds from the $116K support, repeated testing suggests growing vulnerability.
These reactions have likely created a sell-side liquidity pool just below $116K, increasing the probability of a liquidity sweep followed by a bearish breakout. Should this support level fail, the asset could swiftly decline toward the flag’s lower boundary near $111K.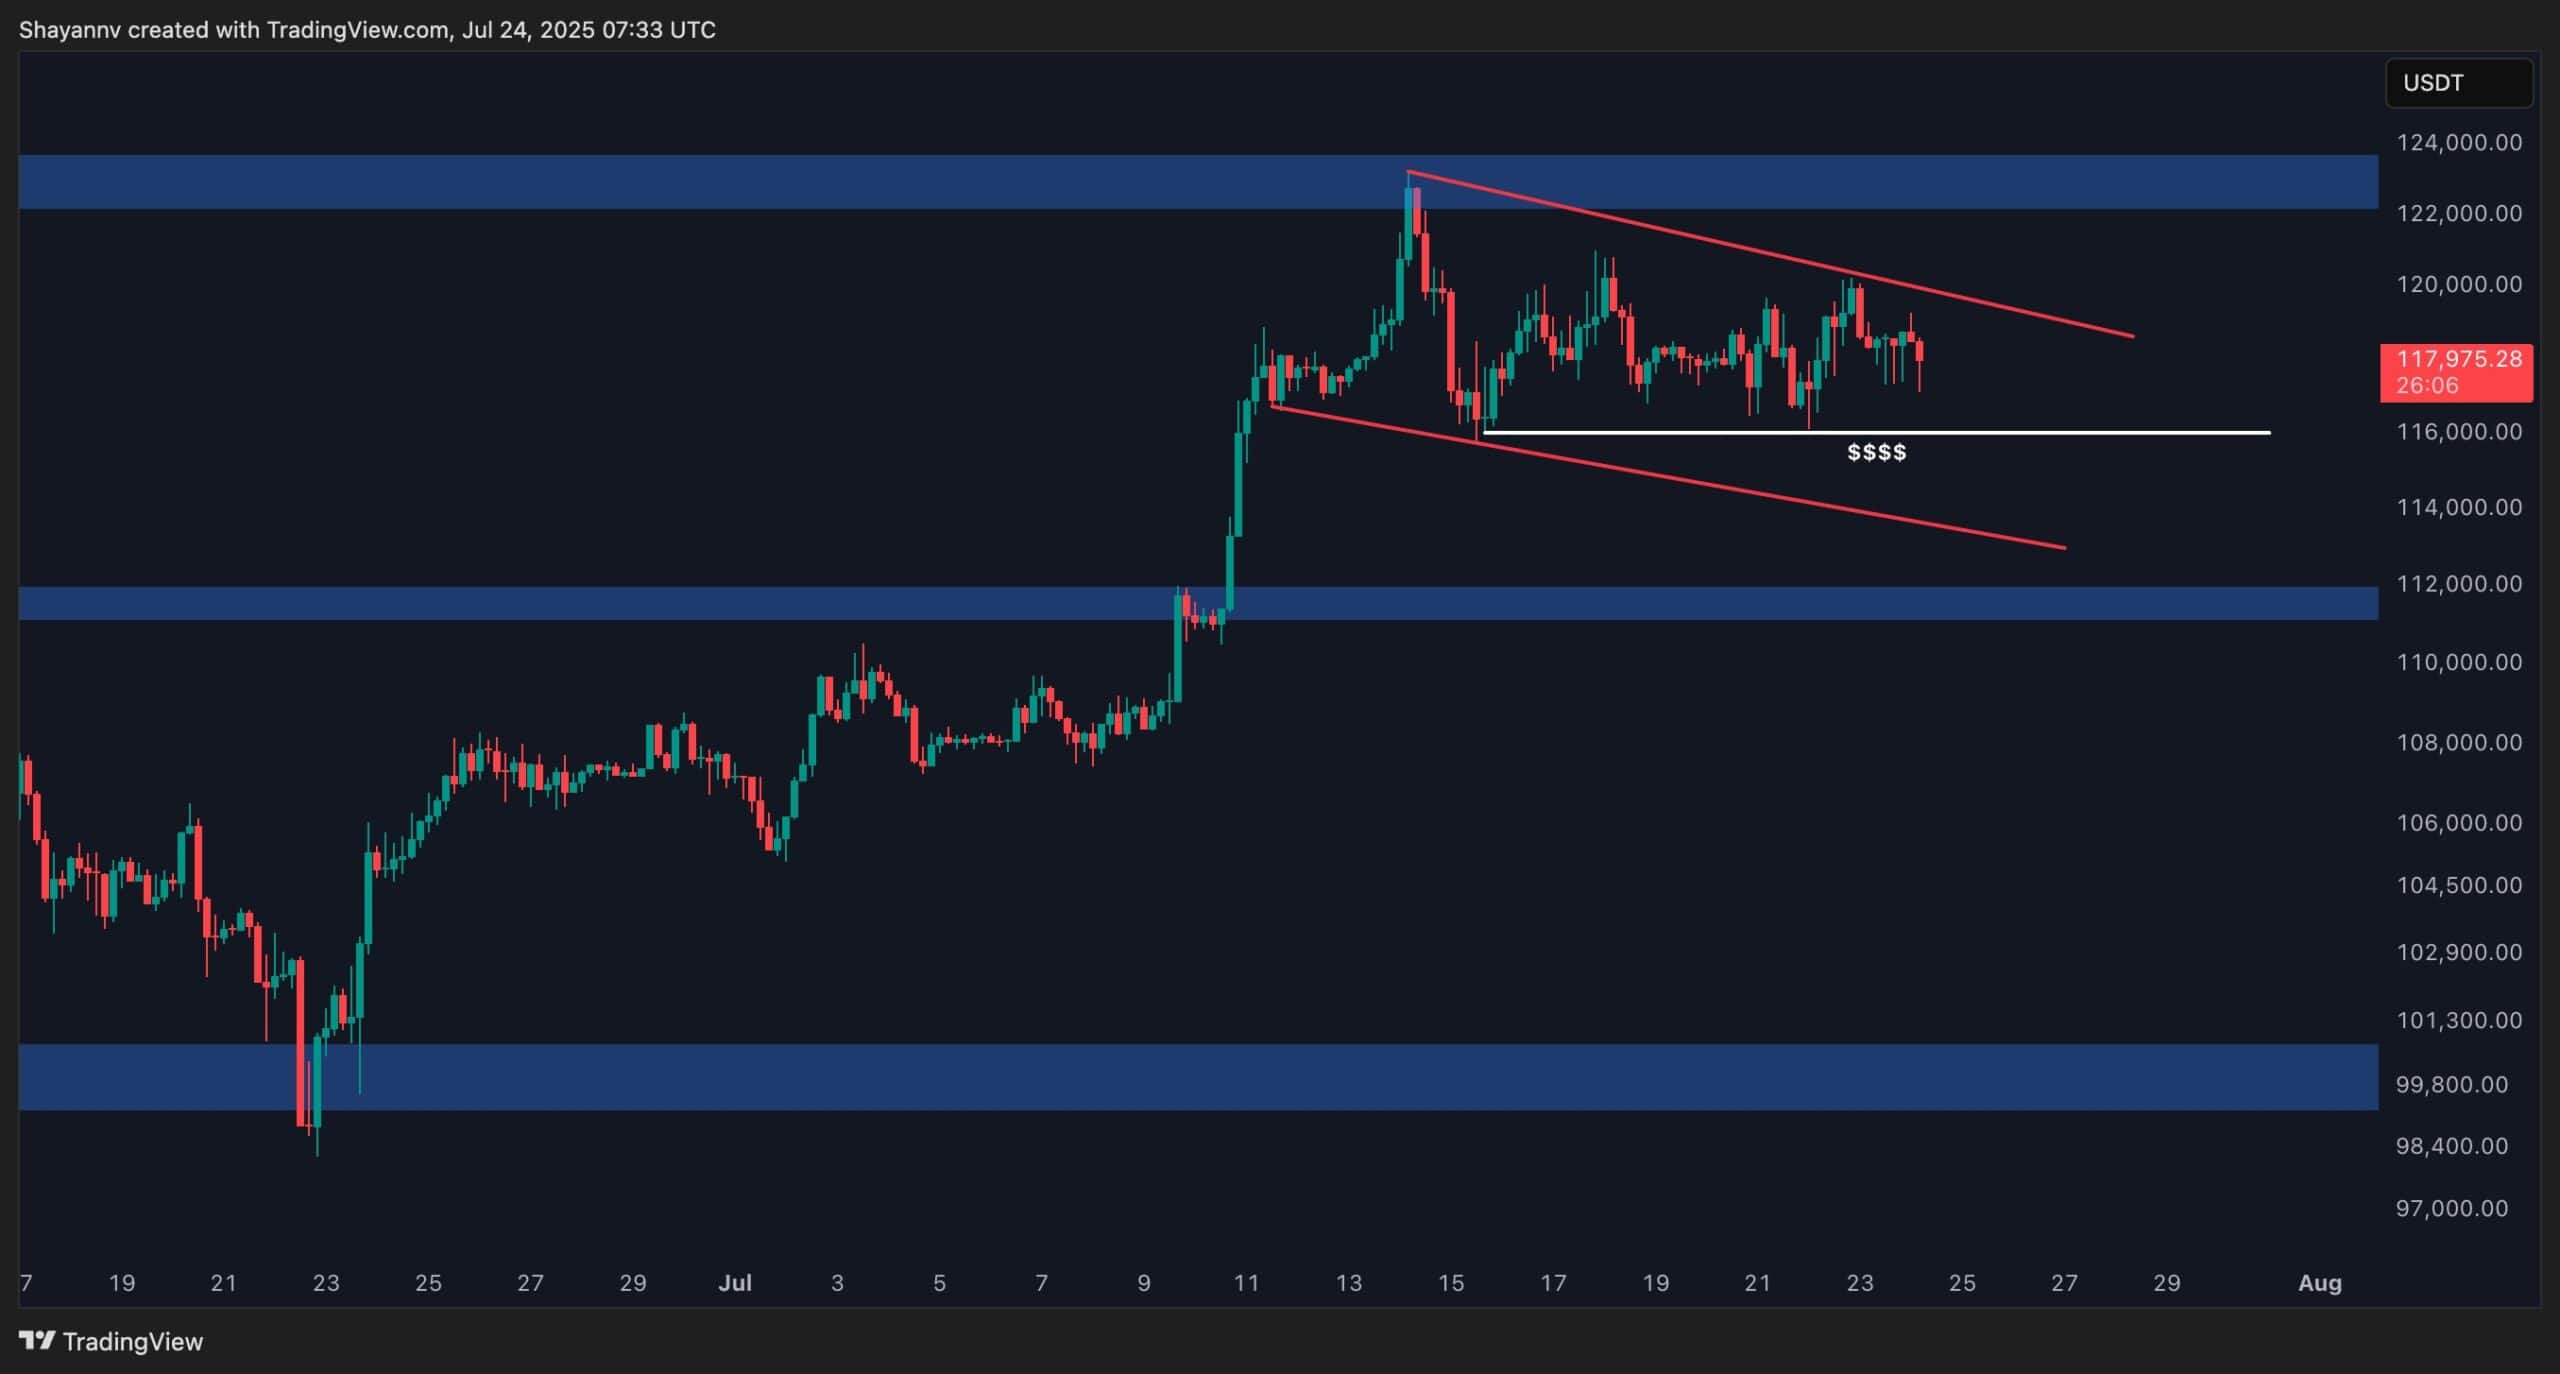
On-chain Analysis
By ShayanMarkets
The Binance BTC/USDT Liquidation Heatmap reveals a critical tug-of-war in the current market structure. Bitcoin’s price is currently trapped between two major liquidity clusters, with significant liquidation pools above $120K and below $116K.
These zones represent a high concentration of leveraged futures positions, making them prime targets for smart money and market makers seeking liquidity. A price move toward either level could trigger a cascade of liquidations, intensifying volatility and rapidly accelerating price action.
As a result, Bitcoin remains range-bound between these two zones until one side is taken out. A breakout above $120K or a breakdown below $116K will likely lead to a sharp, directional move, fueled by stop-losses and forced liquidations.
Traders should keep a close eye on these levels and prepare for potential whipsaw volatility once either threshold is breached.