Bitcoin shows potential for a breakout as $136M in short liquidations suggest a shift in market sentiment, with key resistance levels in focus.
Notably, Bitcoin (BTC) has shown positive momentum over the past 24 hours, with a 2.4% increase pushing its value to $92,502.
The price has been oscillating between a 24-hour range of $90,040.61 and $94,489.84, indicating some volatility but overall strong upward movement. The market cap is currently $1.85 trillion, with a 24-hour trading volume of $52.71 billion, suggesting a high level of market activity.
Looking at the 7-day performance, Bitcoin has experienced a 0.1% decrease, while the 14-day performance shows a larger 6.0% gain, reflecting recent positive sentiment. Over the past month, Bitcoin has dropped 12.9%, and 4.7% in the last year, indicating a longer-term downtrend despite recent price action.
With Bitcoin’s current price consolidating near the $92K mark and testing critical resistance levels, traders are closely monitoring the key price action for any breakout potential. Will Bitcoin break out?
Bitcoin Support and Resistance Levels
On the technical end, the price currently sits above the middle band of the Bollinger Bands indicator, with the upper band at $94,680.44 and the lower band at $84,758.54. BTC recently tested the upper, creating a potential resistance zone, but has since retraced towards the middle of the band based at $89,758.
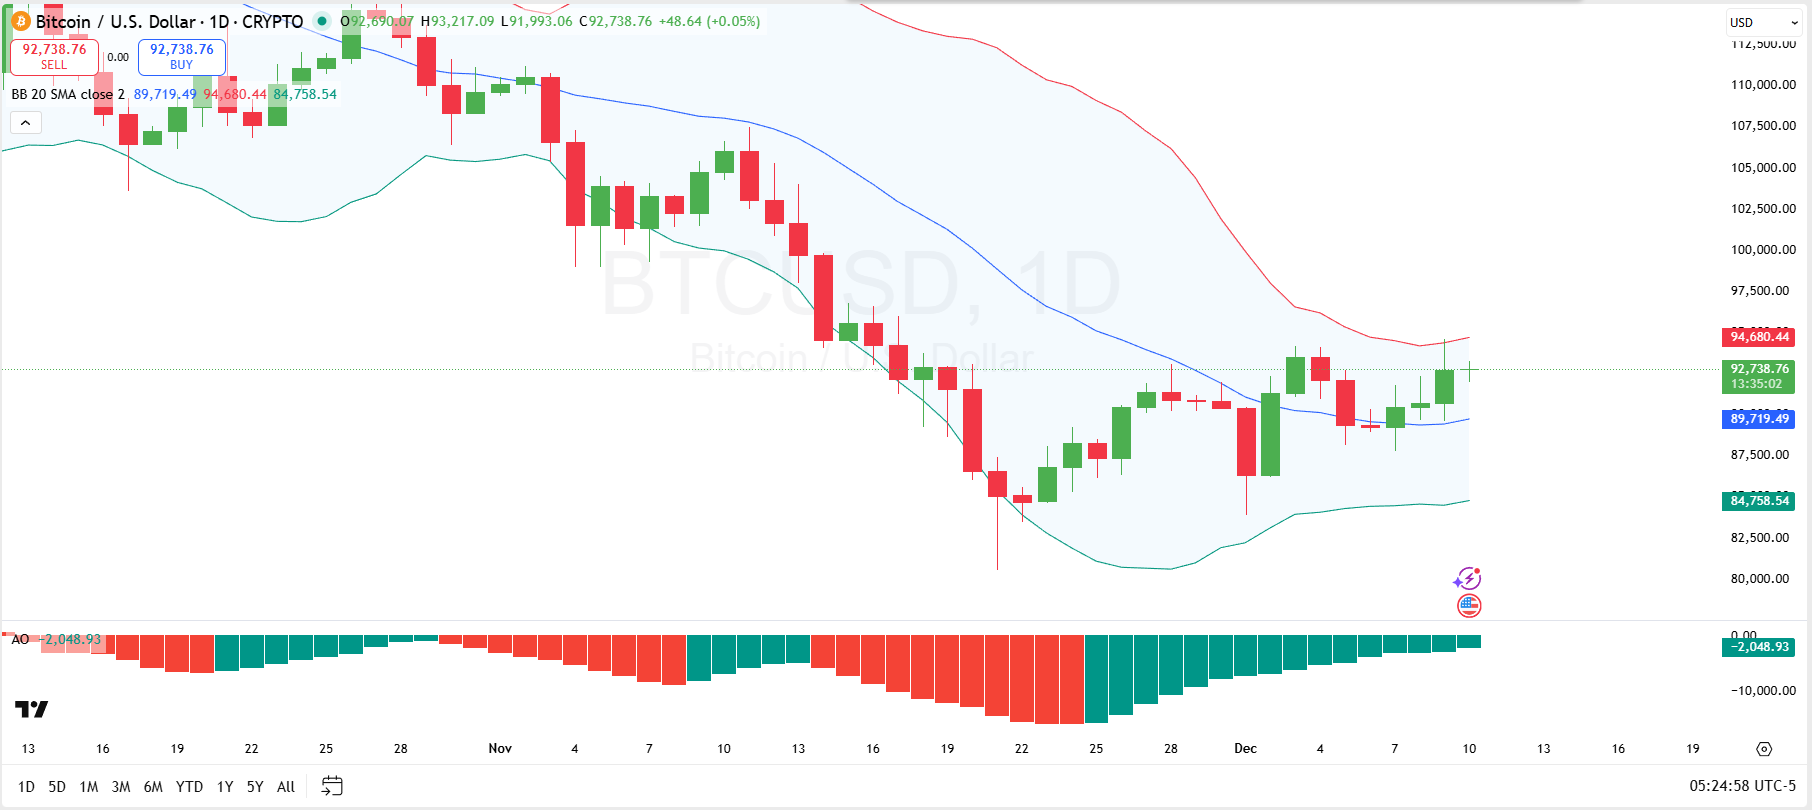
Another sustainable break above the upper Bollinger Band could signal a break towards the next resistance level at $97,500, while a move below the middle band could suggest further downward pressure towards the lower band, testing the $84,758 liquidity zone.
Further, the Awesome Oscillator (AO) is currently showing a negative reading of -2,048.93, indicating a bearish momentum in the market.
However, the AO histogram’s bars have turned green throughout December, suggesting that the downward momentum may be weakening and upward momentum is warming up. If the AO crosses into positive territory, this could indicate a shift in market sentiment, possibly pushing Bitcoin towards the next resistance levels.
Bitcoin Liquidation Overview
Meanwhile, the Bitcoin liquidation data provides insight into the current market sentiment and trader positioning across different timeframes. Looking at the 4-hour and 12-hour liquidation data, the total liquidation amounts remain relatively smaller, at $4.52 million for the 4-hour period and $9.64 million for the 12-hour period.
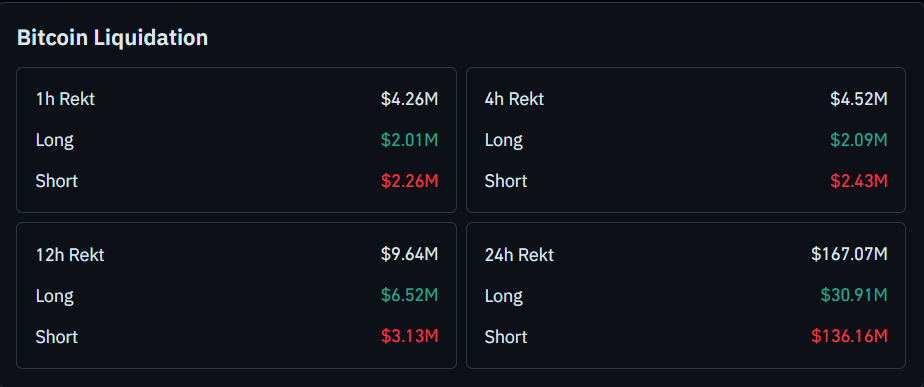
Interestingly, the 4-hour chart shows more short liquidations ($2.43 million) than long liquidations ($2.09 million), suggesting some short squeezes in the recent past. For the 12-hour period, long positions account for a larger share of the liquidation volume ($6.52 million) compared to shorts ($3.13 million), further hinting at some bearish market sentiment and possible liquidation cascades.
The most significant data comes from the 24-hour liquidation figures, with a staggering $167.07 million in total liquidations. A major portion of this, $136.16 million, comes from short positions.
However, long positions are also under significant pressure, with $30.91 million in long liquidations. The large scale of short liquidations could signal that the market is ripe for potential reversals if bullish momentum starts to take hold.