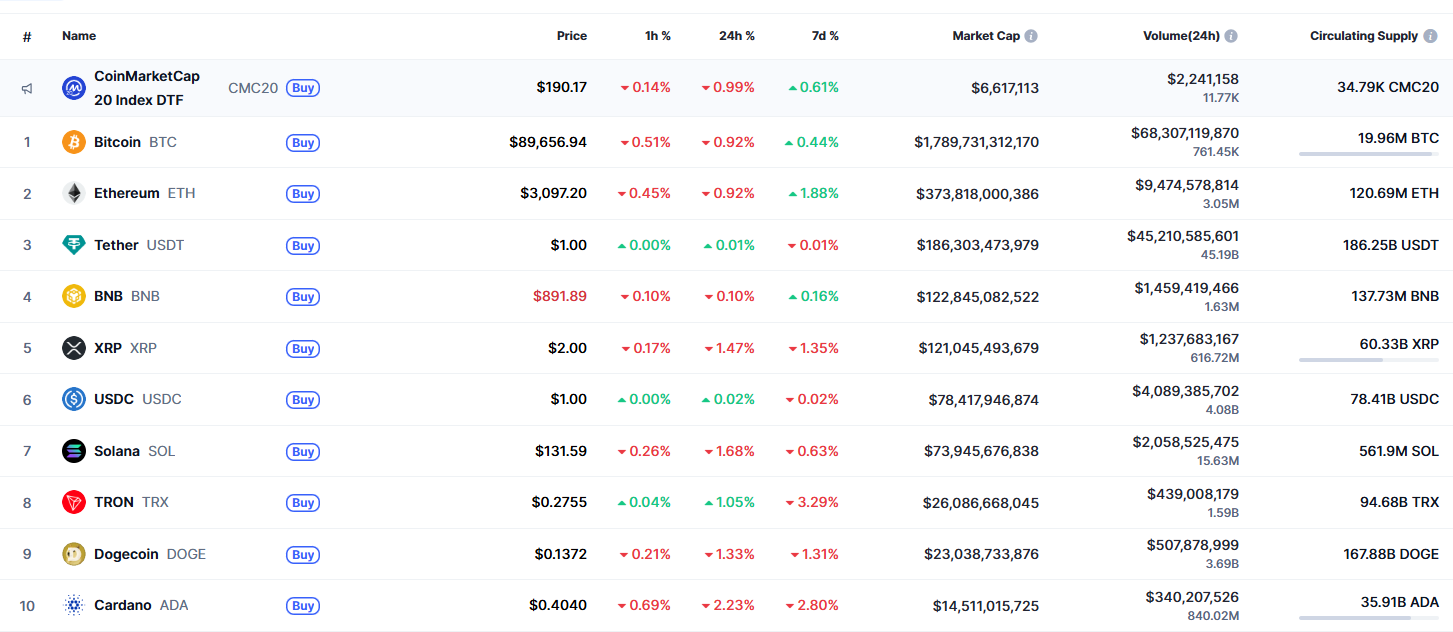
The end of the week is mainly controlled by bears, according to CoinMarketCap.
BTC/USD
The rate of Bitcoin (BTC) has declined by almost 1% since yesterday. Over the last week, the price has risen by 0.44%.
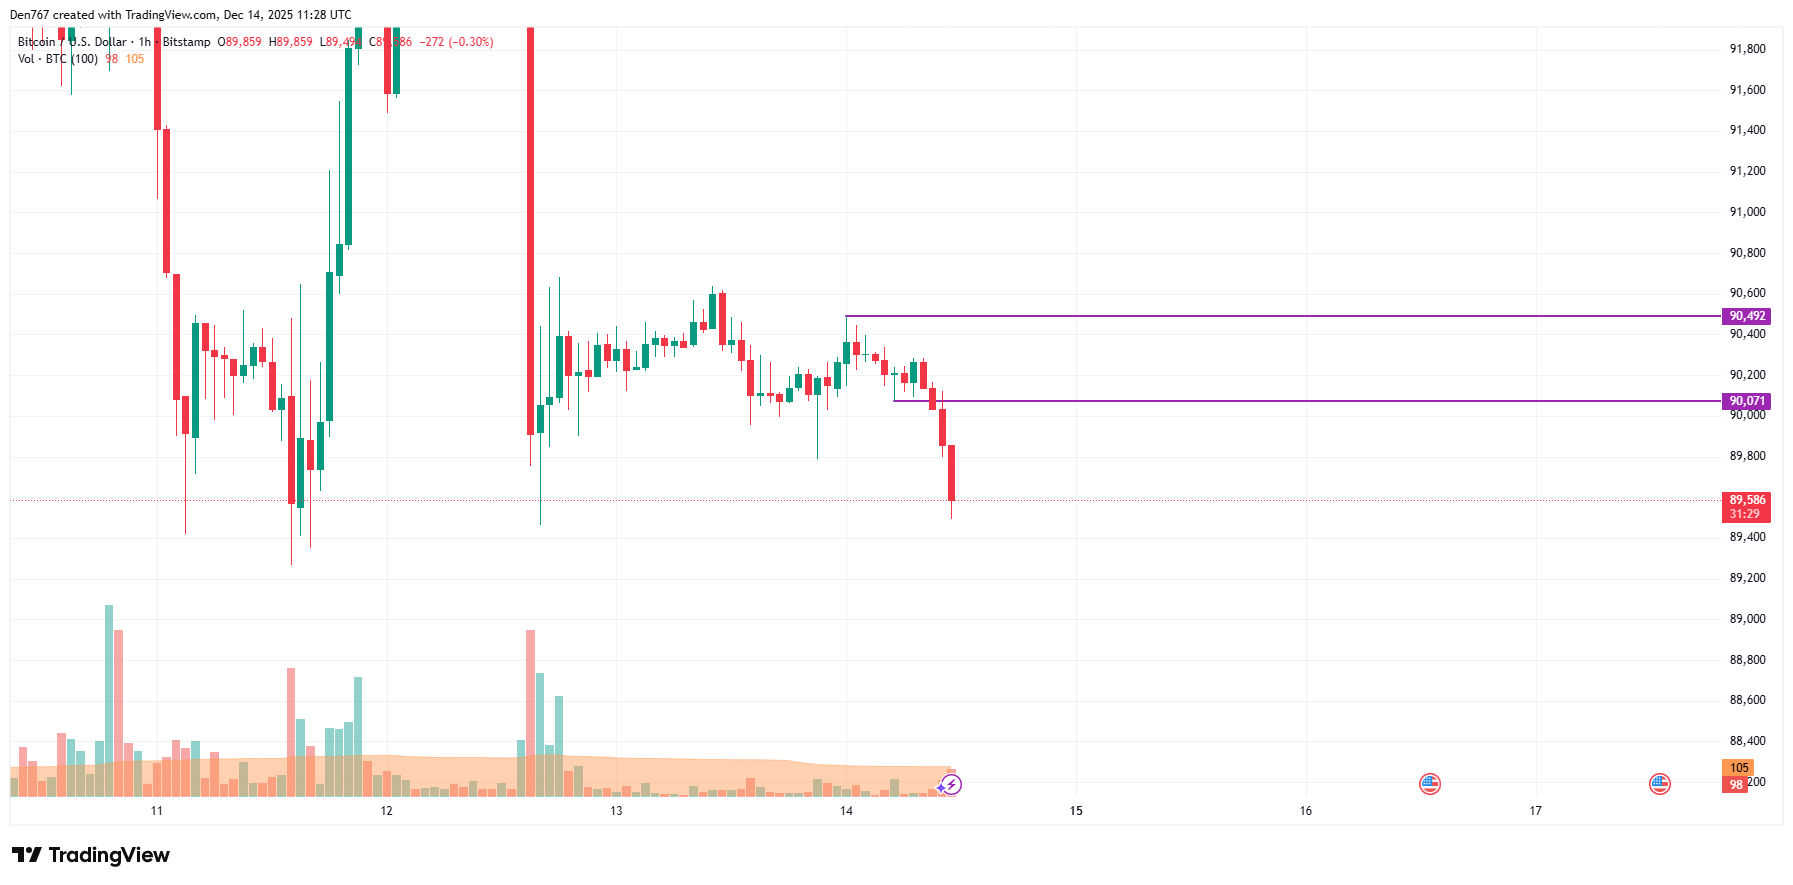
On the hourly chart, the price of BTC is going down after a breakout of the local support of $90,071. If the decline continues and the daily bar closes below the interim zone of $90,000, there is a high chance to witness a test of the $88,000-$89,000 range.
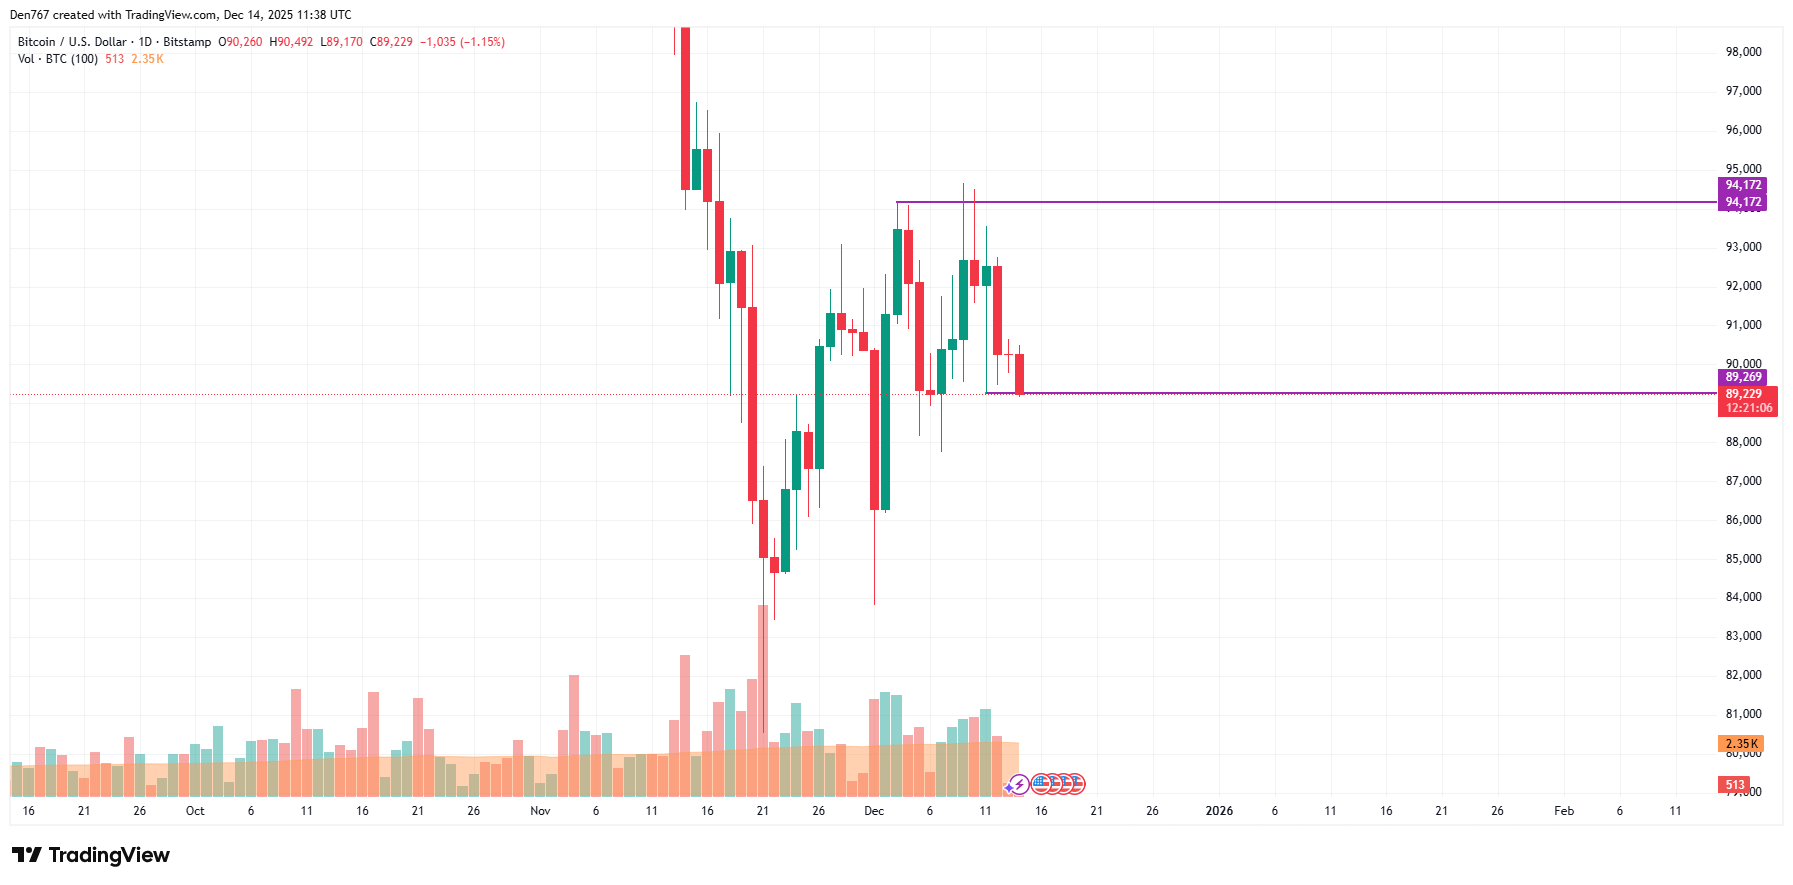
On the bigger time frame, the situation is also more bearish than bullish. If a breakout of the nearest level of $89,269 happens, the accumulated energy might be enough for a more profound drop to the $88,000 mark.
Such a scenario is relevant until the end of next week.
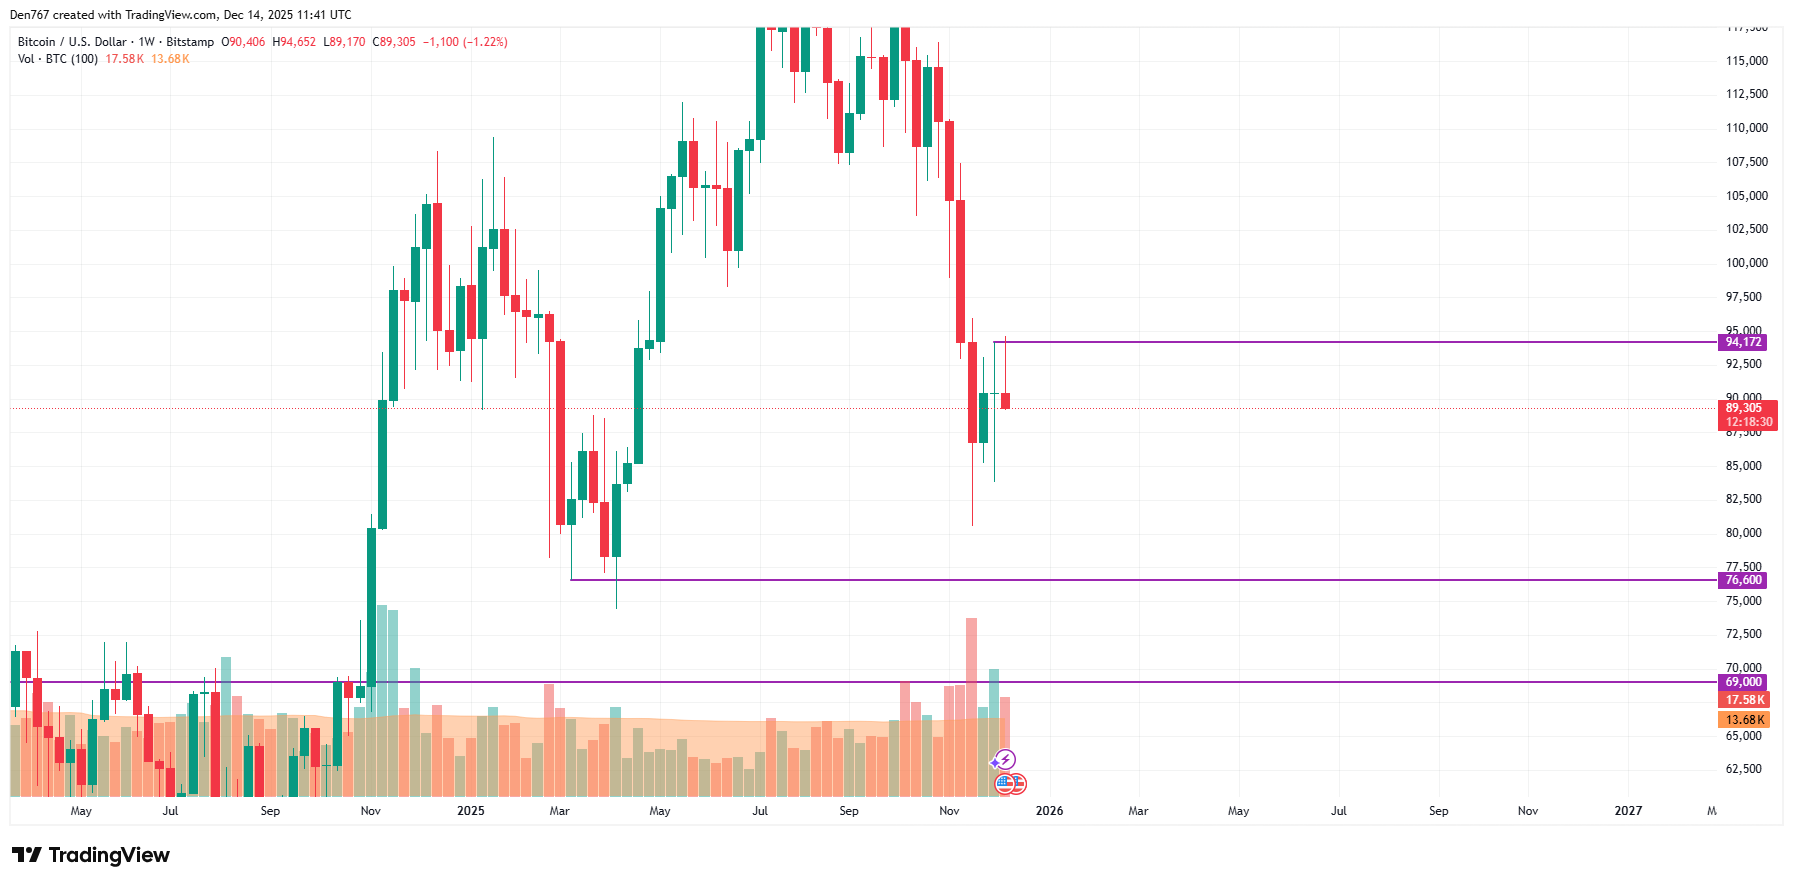
From the midterm point of view, the rate of BTC is falling after a false breakout of the previous bar high of $94,172. As there are no reversal signals so far, an ongoing correction to the $80,000-$85,000 range is the more likely scenario.
Bitcoin is trading at $89,298 at press time.