If bitcoin had a theme song today, it’d be “Can’t Stop, Won’t Stop”—except, maybe it might stop to catch its breath. Trading in a narrow intraday range, the asset has taken a breather above the $95K threshold, forming what might be a bullish flag waving at momentum. The market’s pulse? Steady with a chance of fireworks.
Bitcoin Chart Outlook
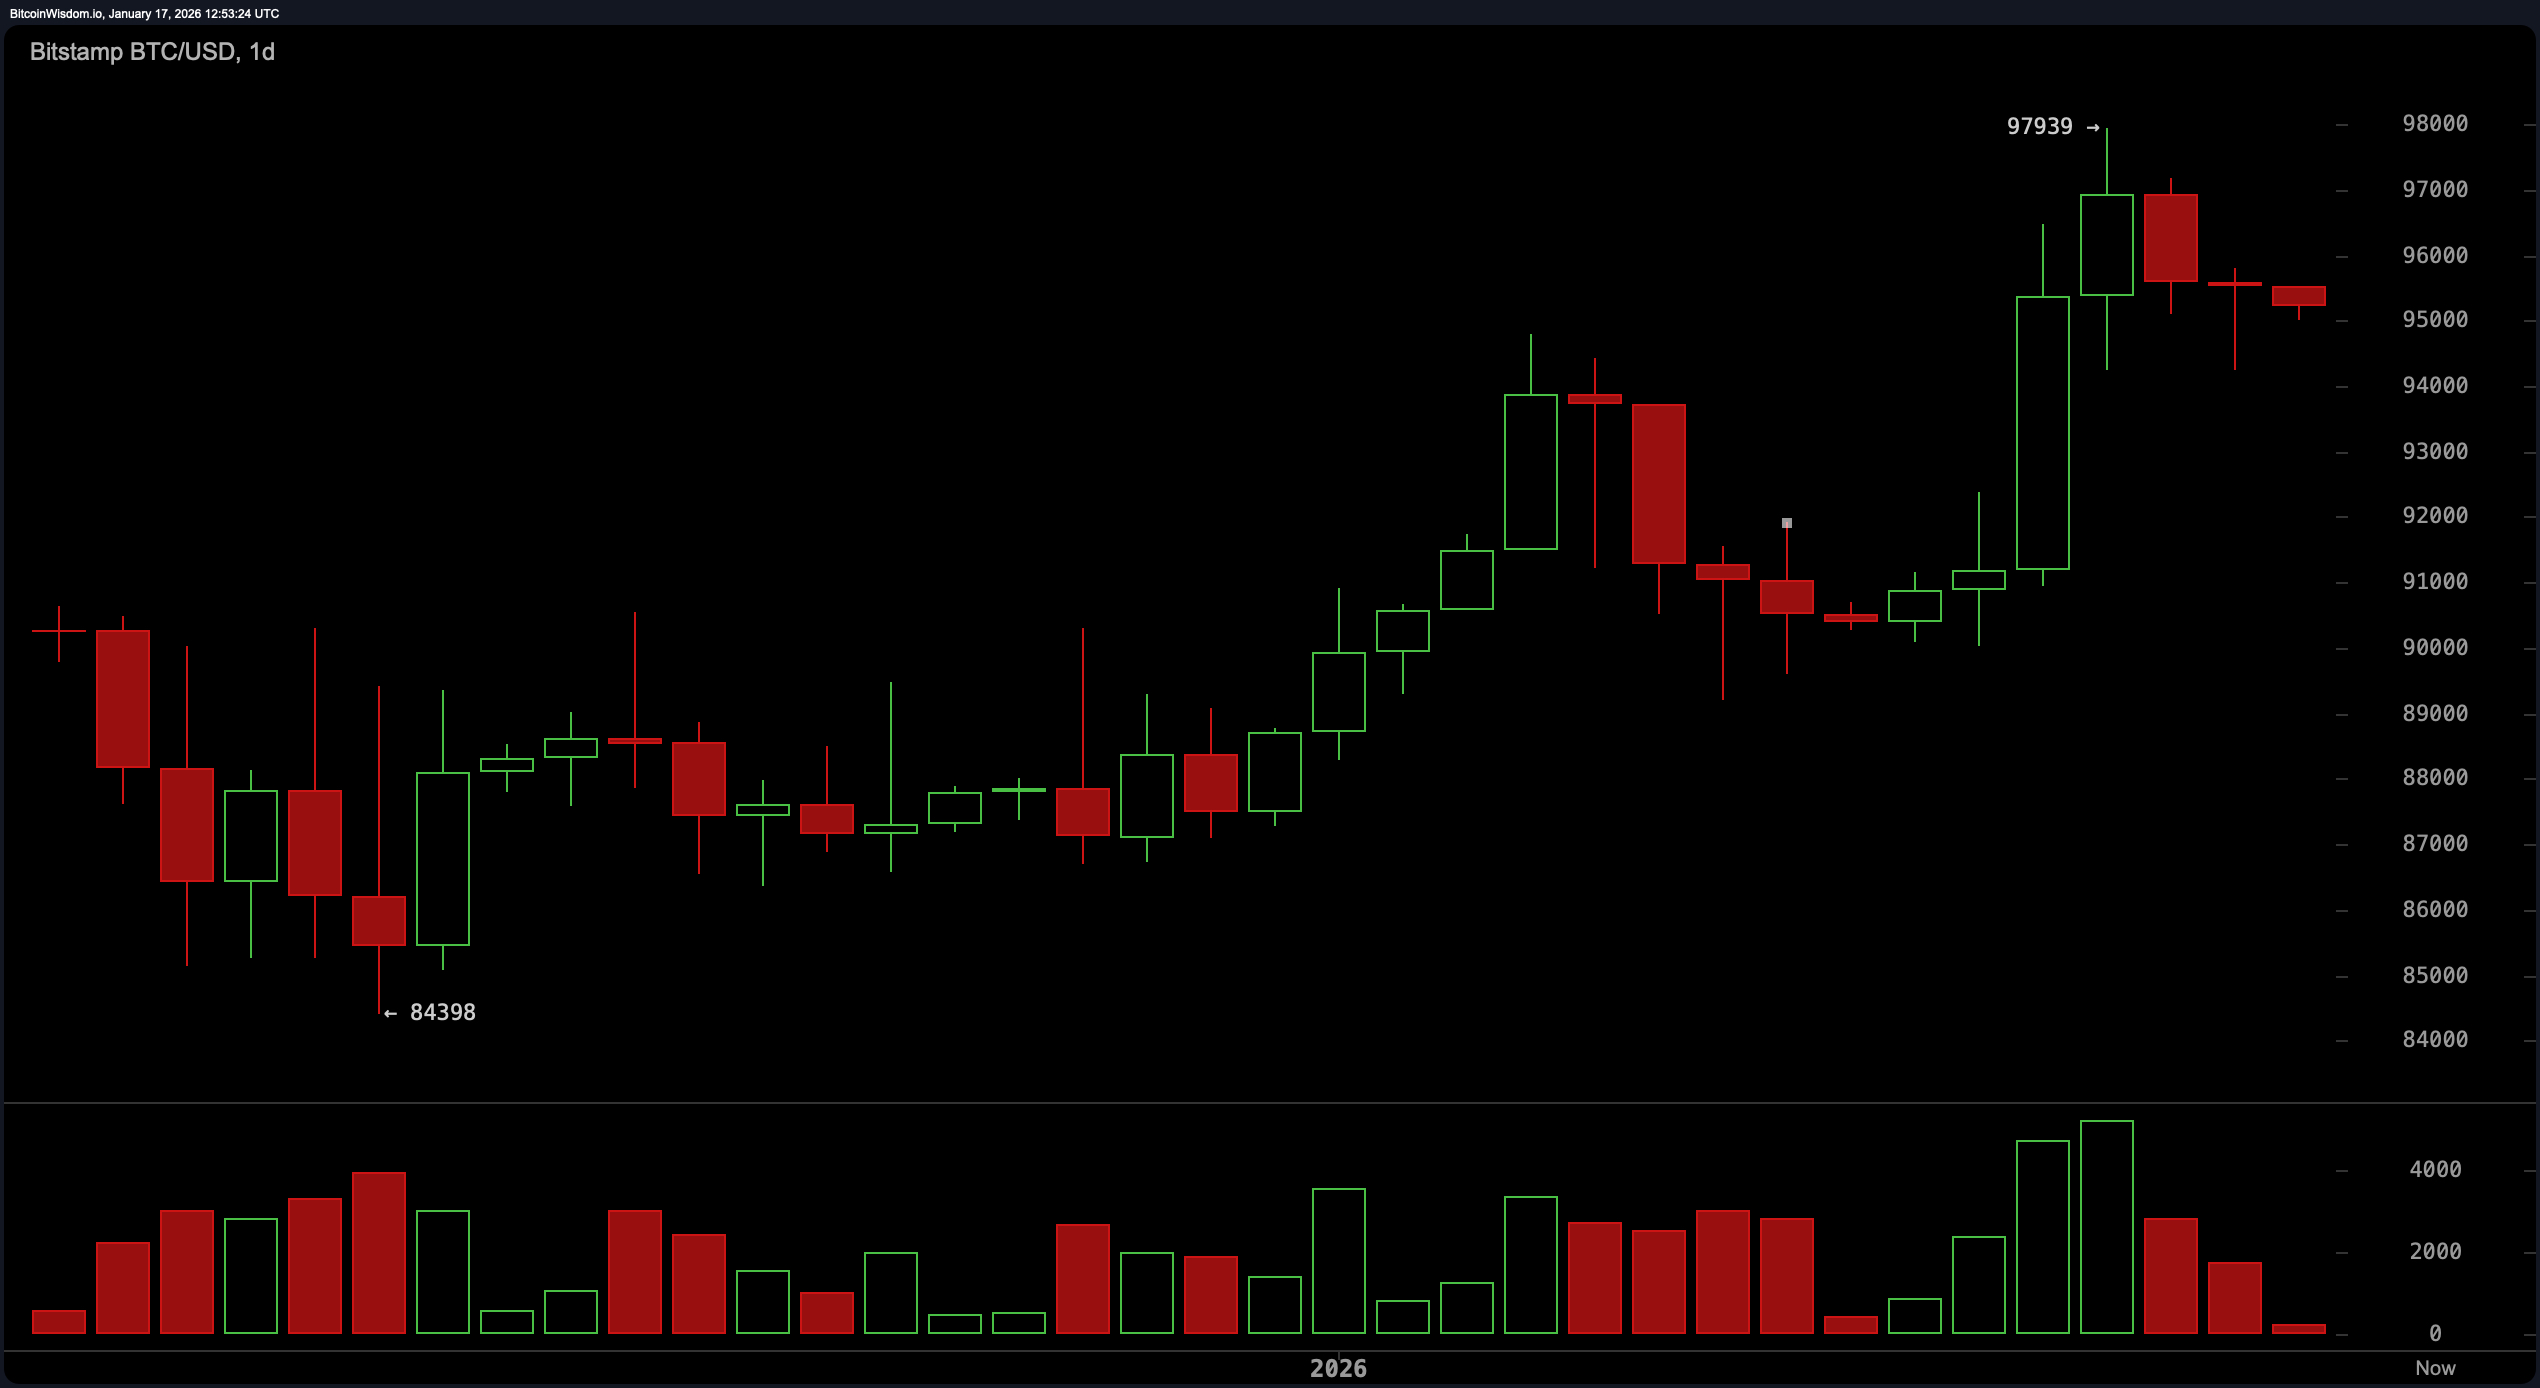
Let’s start with the daily chart, where bitcoin continues to flex its macro muscles. The asset has held its posture above the $95,000 mark, building on an uptrend that began at the local floor near $84,398. Despite a modest correction following a spike to $97,939, momentum remains sturdy, especially as volume that surged during the rally is now tapering off—often a sign of consolidation rather than exhaustion.
The technical landscape suggests a potential breakout, but the market wants to see bitcoin either bounce cleanly off the $91,000–$92,000 support or take out the $98,000 threshold with volume to back it up.
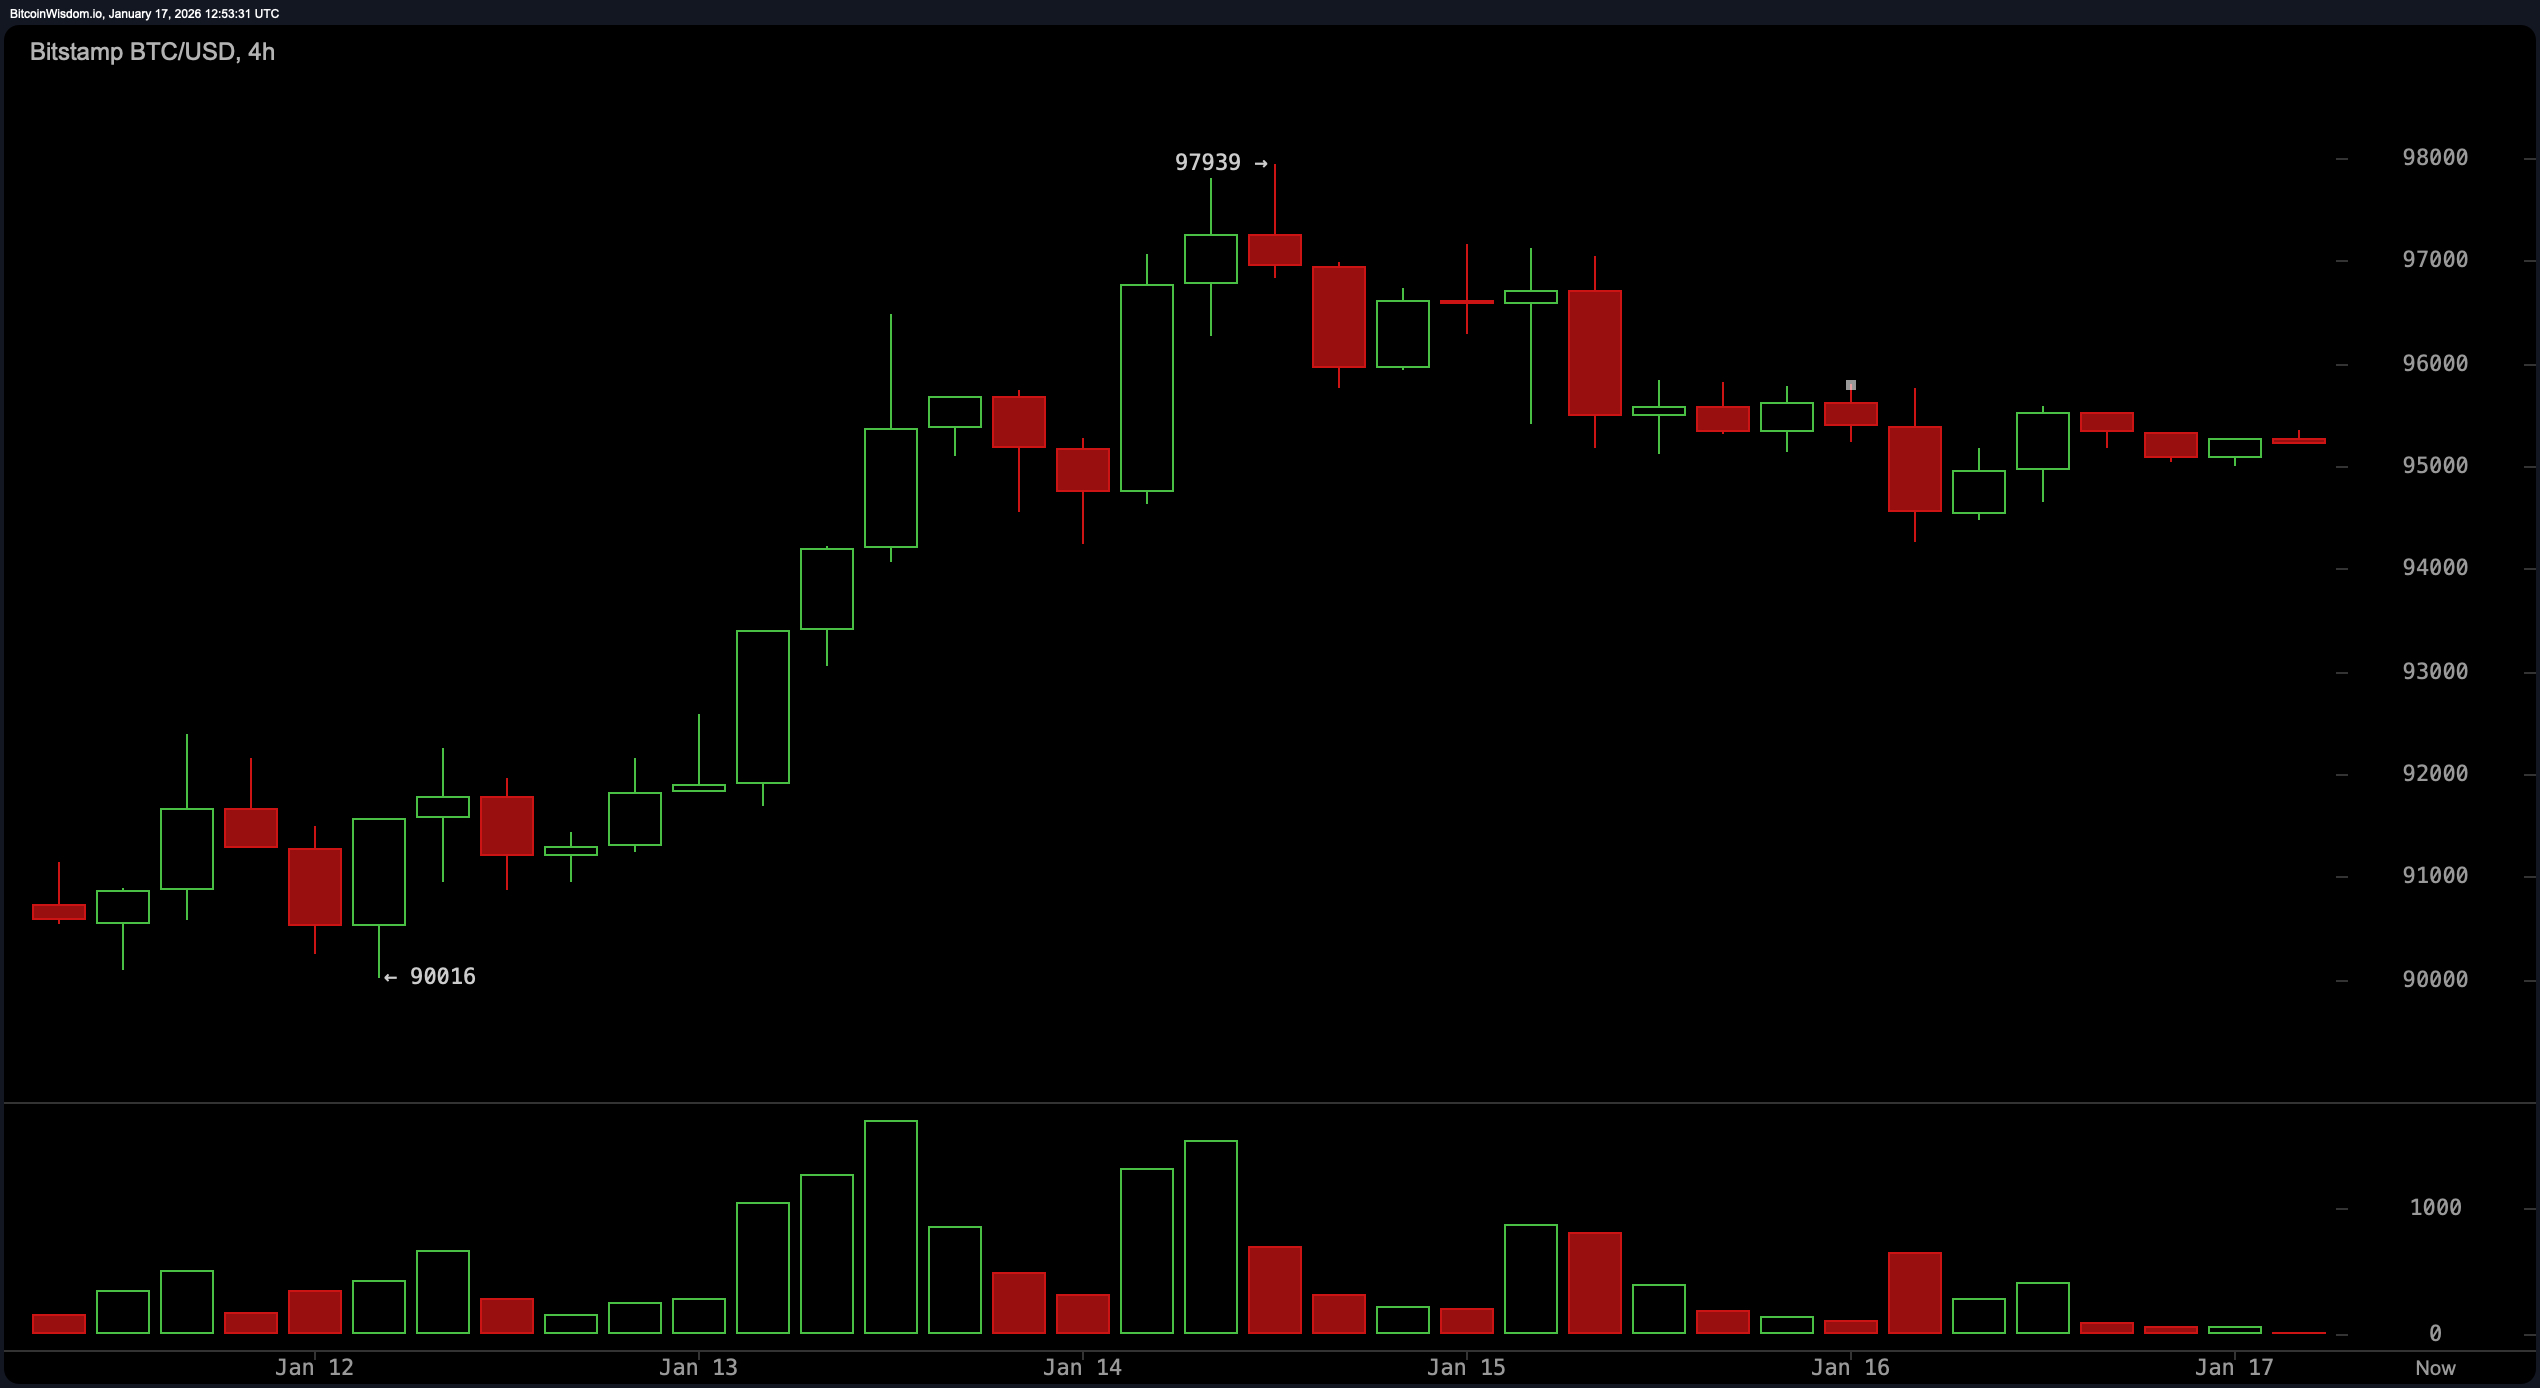
Zooming into the 4-hour chart, bitcoin is playing a more reserved game of ping-pong between $94,000 and $96,500. Momentum peaked with the recent high, but instead of a dramatic retreat, the price has settled into a sideways shuffle. Lower highs hint at fading enthusiasm, but support around $94,000 remains well-defended—buyers aren’t letting this one drop easily. The declining volume paints a picture of accumulation rather than distribution, hinting that something bigger might be brewing just under the surface.
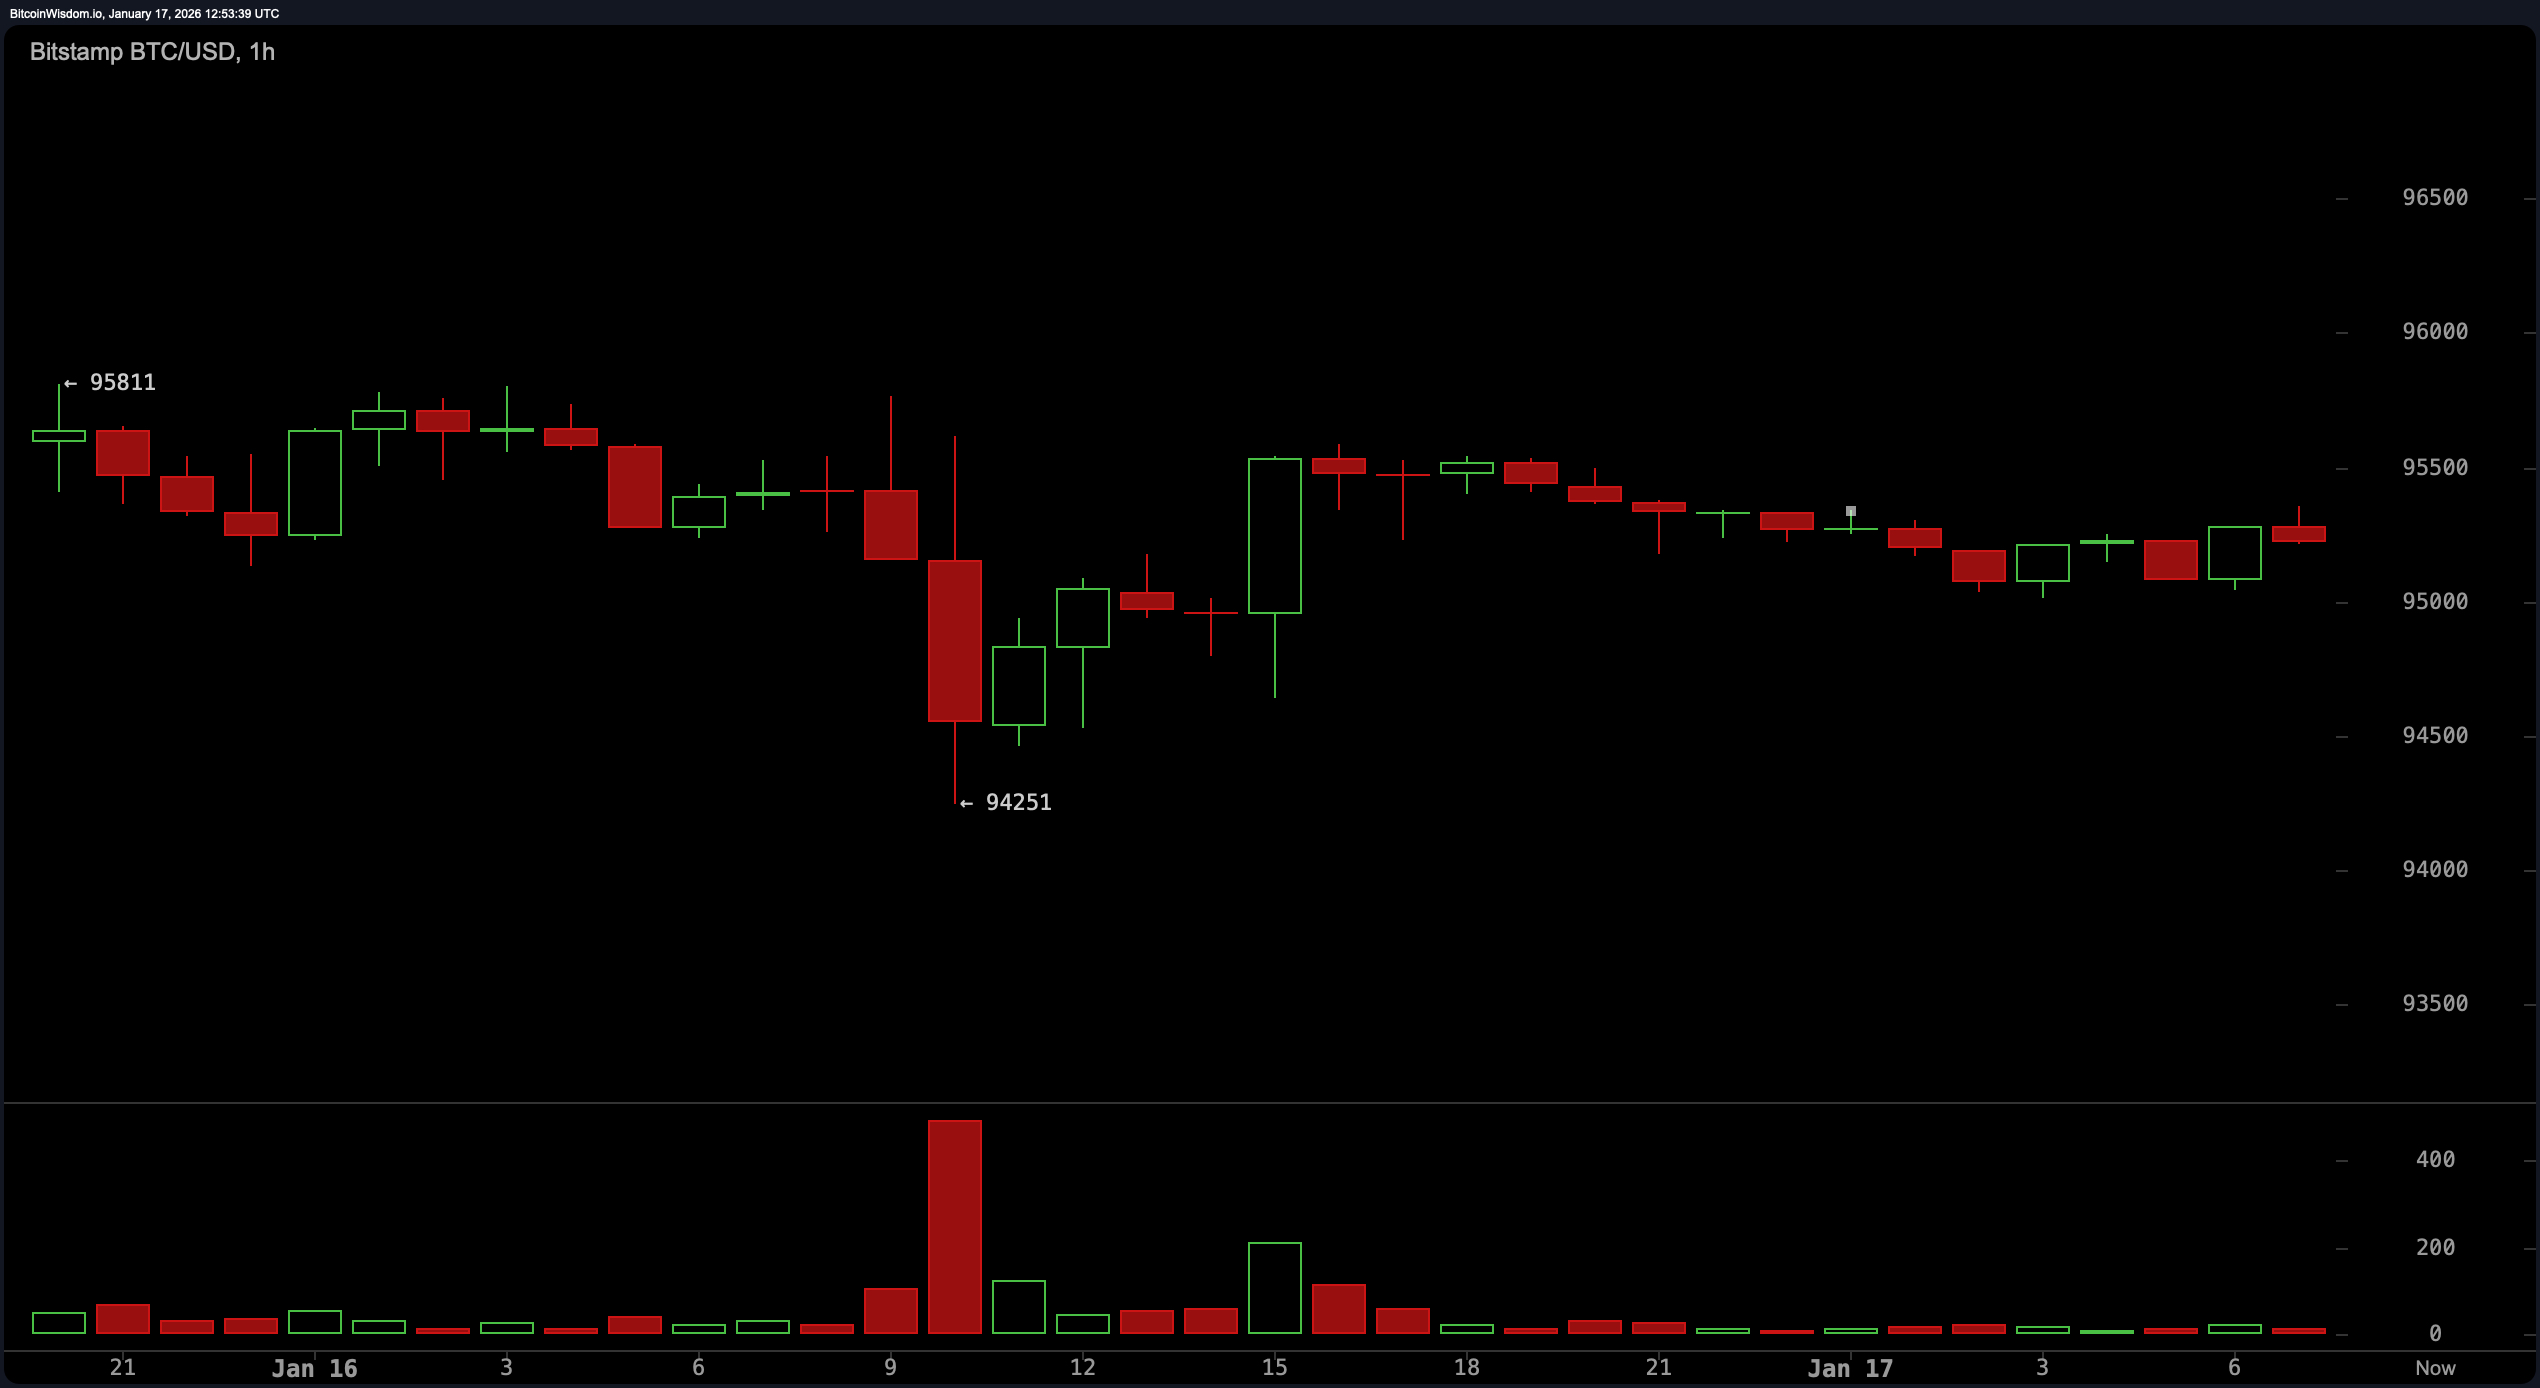
The 1-hour chart is bitcoin’s version of a power nap—mildly bearish, mildly boring, but potentially resting up for its next move. The price action is compressed in a tight $94,500–$95,500 band, with little directional momentum to speak of. The lack of volume resembles a market holding its breath, waiting for a catalyst to break the tension. Any move above $95,500 with strong volume could launch a quick push to $96,500, while failure to hold $94,250 opens the door for a deeper dive.
Oscillators are sending a mixed bag of signals, as if bitcoin’s own indicators are undecided. The relative strength index ( RSI) stands at 62, keeping things neutral. Stochastic oscillators clock in at 72, echoing that non-committal stance, while the commodity channel index (CCI) at 108 leans toward overbought conditions. Momentum, however, struts in with a bullish tone at 3,948, reinforced by the moving average convergence divergence ( MACD), which shows a level of 1,547 and sides with momentum’s optimism.
Moving averages (MAs) paint a fascinating split between near-term confidence and long-term caution. All short-term averages—like the 10-day exponential moving average (EMA) at $93,881 and the 20-day simple moving average (SMA) at $91,762—are in bitcoin’s corner. Mid-range signals up to the 50-day remain supportive, but once you step into triple-digit territory, sentiment flips. Both the 100-day and 200-day averages, including the EMA at $99,468 and the SMA at $105,894, have thrown in the towel, suggesting the broader trend still needs to shake off the ghosts of past volatility before committing to new highs.
Bitcoin may be stuck in a short-term holding pattern, but the longer-term narrative still leans bullish—if the price can hold its ground and break out with conviction. The market is eyeing $98,000 like it’s the velvet rope to a trend continuation party. For now, bitcoin’s technicals are a masterclass in patience, caution, and the art of waiting for volume to do the talking.
Bull Verdict:
If bitcoin can sustain support above $94,000 and gather the volume strength needed to break through the $98,000 ceiling, the trend continuation narrative gains serious credibility. With short- to mid-term moving averages aligned and momentum indicators leaning favorable, a bullish breakout isn’t just wishful thinking—it’s a high-probability setup waiting for confirmation.
Bear Verdict:
Should bitcoin lose its footing below $94,000—especially with volume backing the breakdown—the structure risks unraveling toward the $91,000 support zone. Add in the bearish signals from long-term moving averages and overbought readings like the commodity channel index (CCI), and the market may be prepping for a controlled descent rather than a victory lap.
FAQ ❓
- What is bitcoin’s current price? Bitcoin is trading at $95,222 as of January 17, 2026.
- What price levels should traders watch today?Key levels include support at $94,000 and resistance near $96,500–$98,000.
- Is bitcoin in a bullish or bearish trend?The broader trend remains bullish, but short-term momentum is neutral.
- What indicators are signaling the next move?Momentum and MACD are positive, while long-term moving averages flash caution.