Bitcoin trades within a tight range as buyers defend support, while resistance above keeps the market cautious and awaiting a clear breakout direction.
Bitcoin ($BTC) is trading near $70,606 at press time, down 0.1% over 24 hours, after a volatile intraday session between $68,933 and $70,931. The chart shows an early drop below $68,900, followed by a steady recovery as buyers stepped in and pushed $BTC back above the $70,900 zone.
This rebound suggests demand remains active on dips, while the move toward the upper end of the daily range shows bulls still defend short-term momentum. However, Bitcoin has not yet broken through the $71,000 resistance level. This zone keeps the market within a cautious range as traders monitor the next directional move.
With the Bitcoin price holding above key intraday support and pressing higher again, another breakout attempt could quickly shift market sentiment.
Can Bitcoin Break Out Again
Bitcoin’s daily chart shows the latest candle holding above the middle of a descending pitchfork. That placement suggests that Bitcoin continues to trade within a broader downward-sloping structure, but the price remains firm near the upper half of the range.
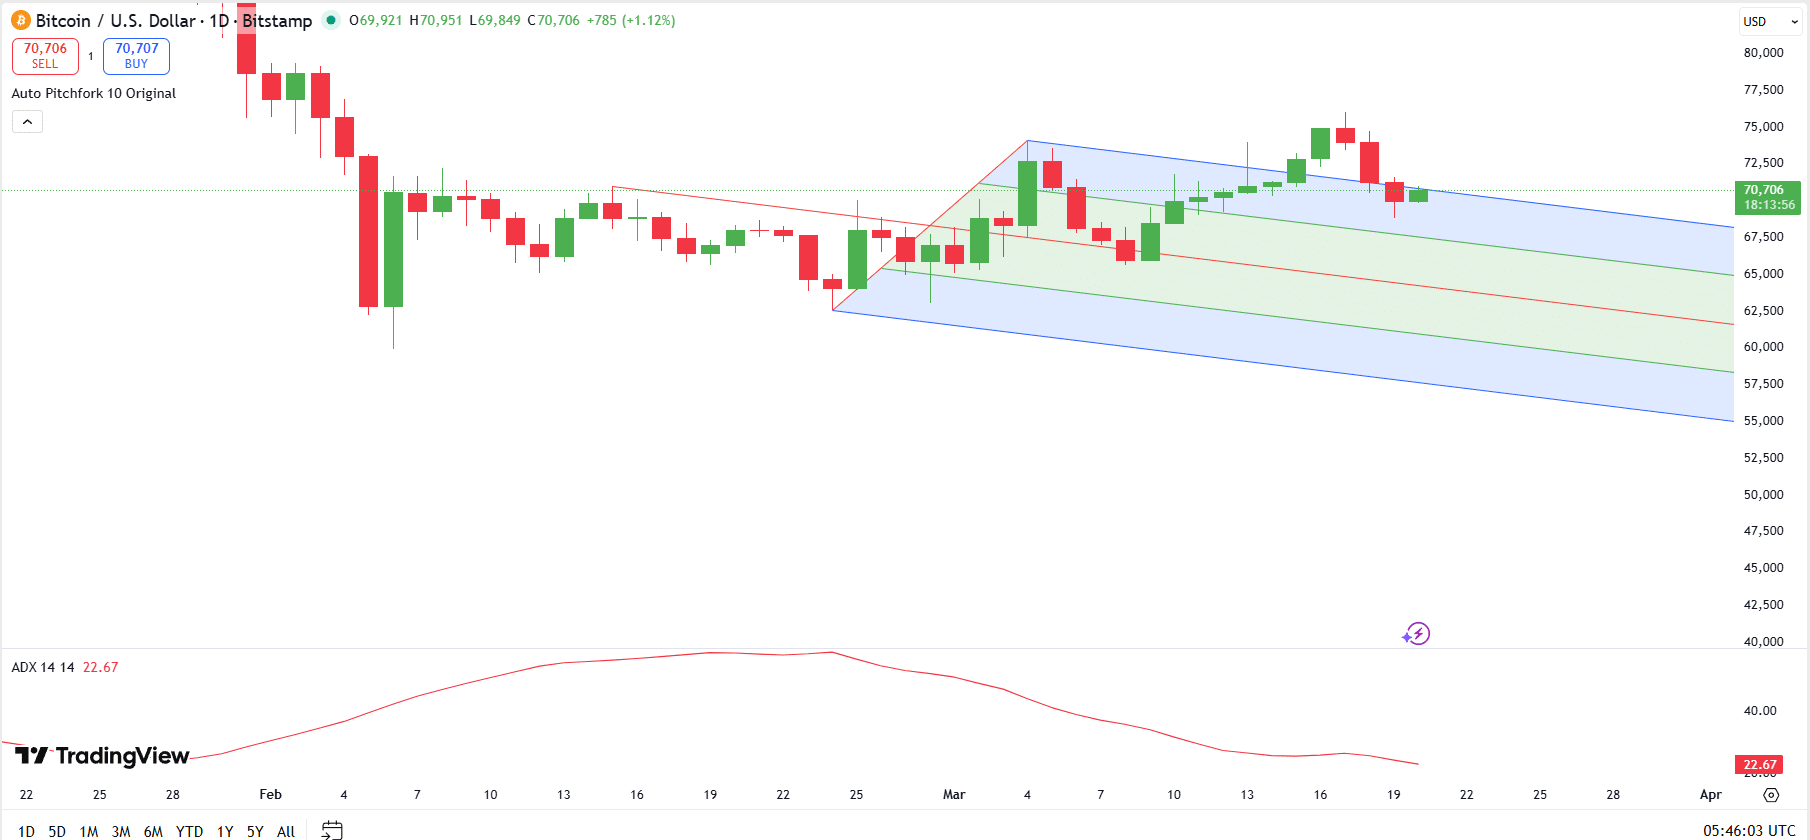
The recent rebound from the lower channel support also indicates that buyers have remained active on dips, which has helped $BTC recover from the late-February weakness.
The main technical level now sits near the upper pitchfork resistance, around the $71,000 to $72,000 zone. A clear move above that area would strengthen the bullish case and could open the way toward the recent swing high near $75,000.
On the downside, the mid-channel area near $66,000 to $67,000 acts as first support, while a deeper pullback could expose the lower boundary near $57,500 to $60,000.
Meanwhile, the ADX is 22.67, indicating a weak trend. That reading suggests momentum exists, but it is insufficient to confirm a powerful breakout or breakdown. The ADX line is also sloping downward, indicating that the prior trend has been losing strength.
Here’s Key Support Region
Elsewhere, More Crypto Online said Bitcoin is moving toward an important support area between $67,761 and $66,765. Here, buying interest needs to appear to maintain the current structure.

The analyst said the chart still shows no strong bounce or reversal signal, so there is no confirmation yet that price has reached a near-term bottom. According to the post, unless Bitcoin delivers a clear upward response, downside risk remains in place. Also, price is still vulnerable to falling deeper into that support range or breaking below it.