Bitcoin still faces downside risk before any stronger rebound, as two market analysts point to weak structure and unfinished liquidity below current price. Together, their charts show a market stuck between lower support targets and repeated resistance failures, with no clear sign yet of a lasting trend reversal.
Bitcoin liquidity zones point to possible dip before rebound
Bitcoin may revisit lower liquidity levels before making another move higher, according to chart analysis shared by trader Ted Pillows.
Ted said Bitcoin has not yet fully cleared downside liquidity. He also noted that liquidity clusters are now building above the $75,000 level. As a result, the setup suggests Bitcoin could first move lower in the short term, then turn up later.
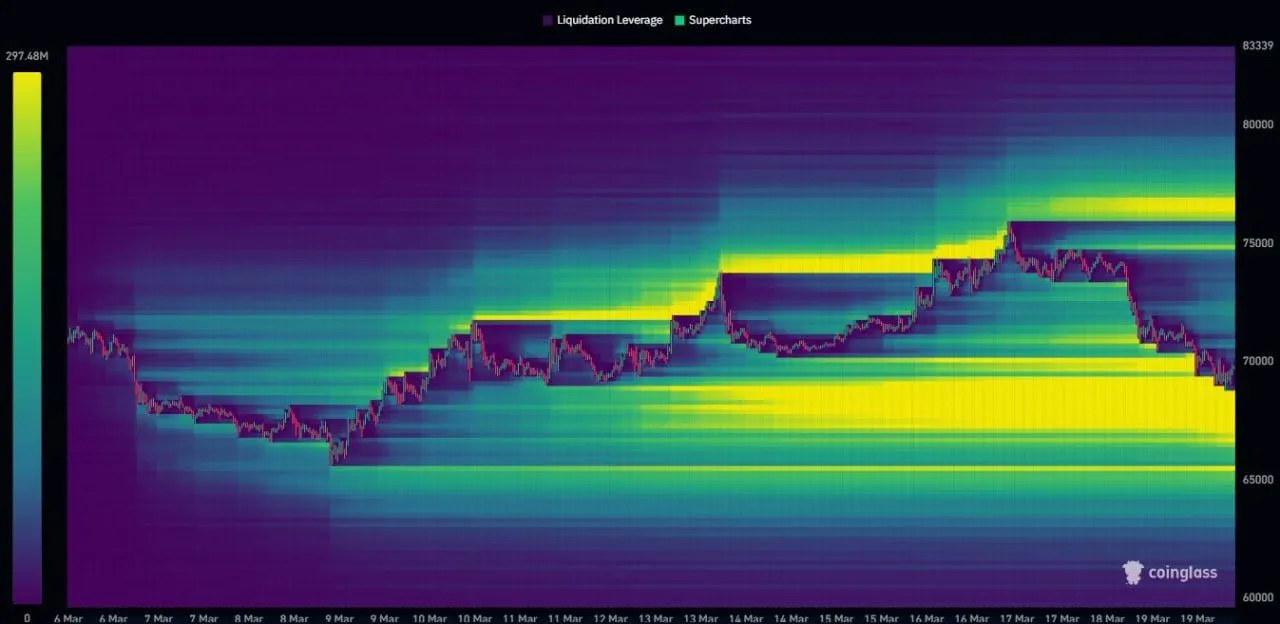
Bitcoin Liquidity Heatmap BTC Price Levels. Source: CoinGlass
The chart shows large liquidity concentrations below the current price, especially in the $66,000 to $69,000 area. At the same time, another cluster appears near and above $75,000. Therefore, the structure points to two active zones where price could react.
In this setup, downside liquidity often acts as a magnet before a reversal. So, Bitcoin could tap that lower area first if sellers keep pressure on the market. After that, if buyers return, price may attempt another move toward the upper liquidity cluster above $75,000.
Still, the chart does not confirm timing. It only shows where liquidation interest is building and where price may move next. For now, the main takeaway is that Bitcoin remains caught between heavy liquidity below and fresh liquidity forming overhead.
Bitcoin range failures signal continued downside pressure
Bitcoin continues to reject at key resistance levels, reinforcing a broader downtrend structure, according to analysis shared by Daan Crypto Trades.
Daan said repeated range breakout failures make a sustained relief bounce unlikely. Each attempt to push higher has faced rejection, which confirms that sellers remain active at resistance. As a result, price has not managed to establish a stronger upward structure.
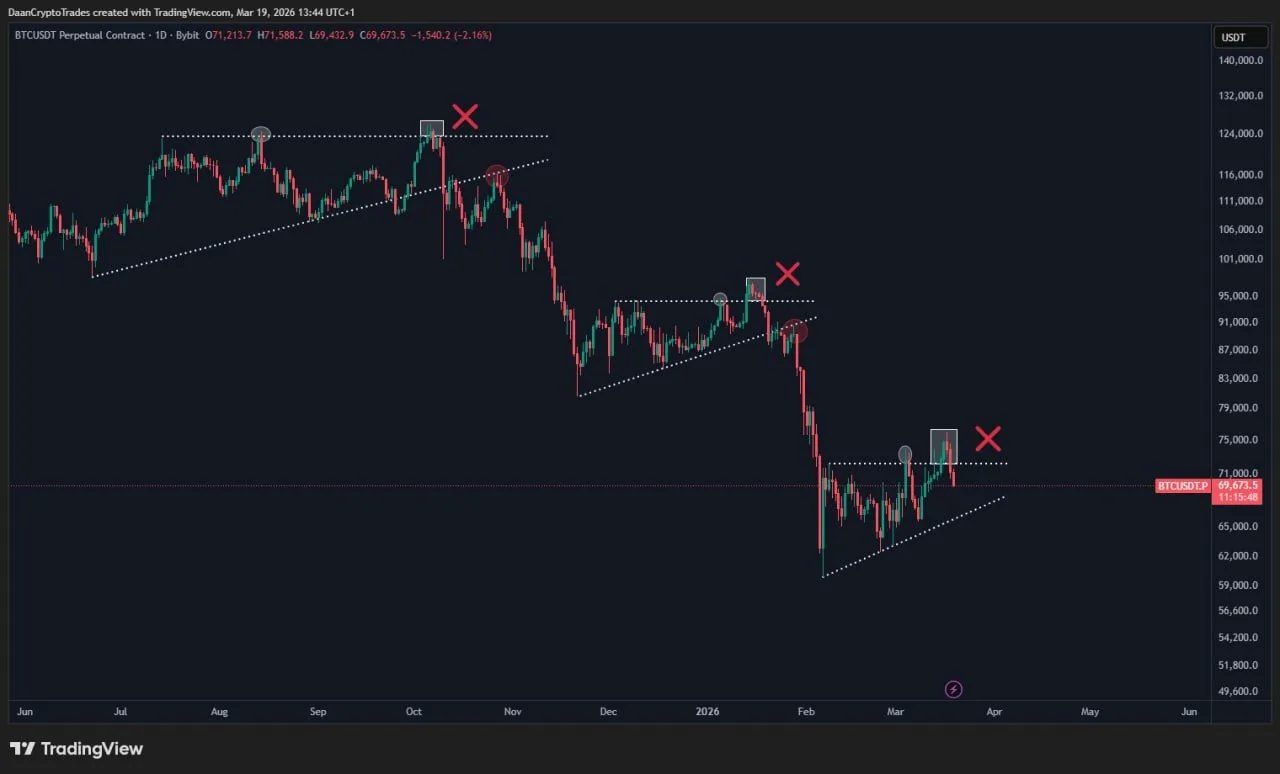
Bitcoin Range Breakouts Keep Failing. Source: TradingView / X
The chart shows several failed breakouts marked by lower highs and rejections near horizontal resistance zones. At the same time, ascending trendlines on lower timeframes keep breaking down. Therefore, short-term strength has not translated into a trend reversal.
In addition, Daan noted that recent moves mainly reflect short squeezes followed by continued downside. These sweeps trigger temporary upward moves, but they do not hold. Instead, price returns lower after liquidity above is cleared.
Meanwhile, Bitcoin price action remains choppy across lower timeframes. This structure has persisted for about six weeks, which limits clear directional moves. As long as this pattern continues, the market remains unstable with no confirmed trend shift.