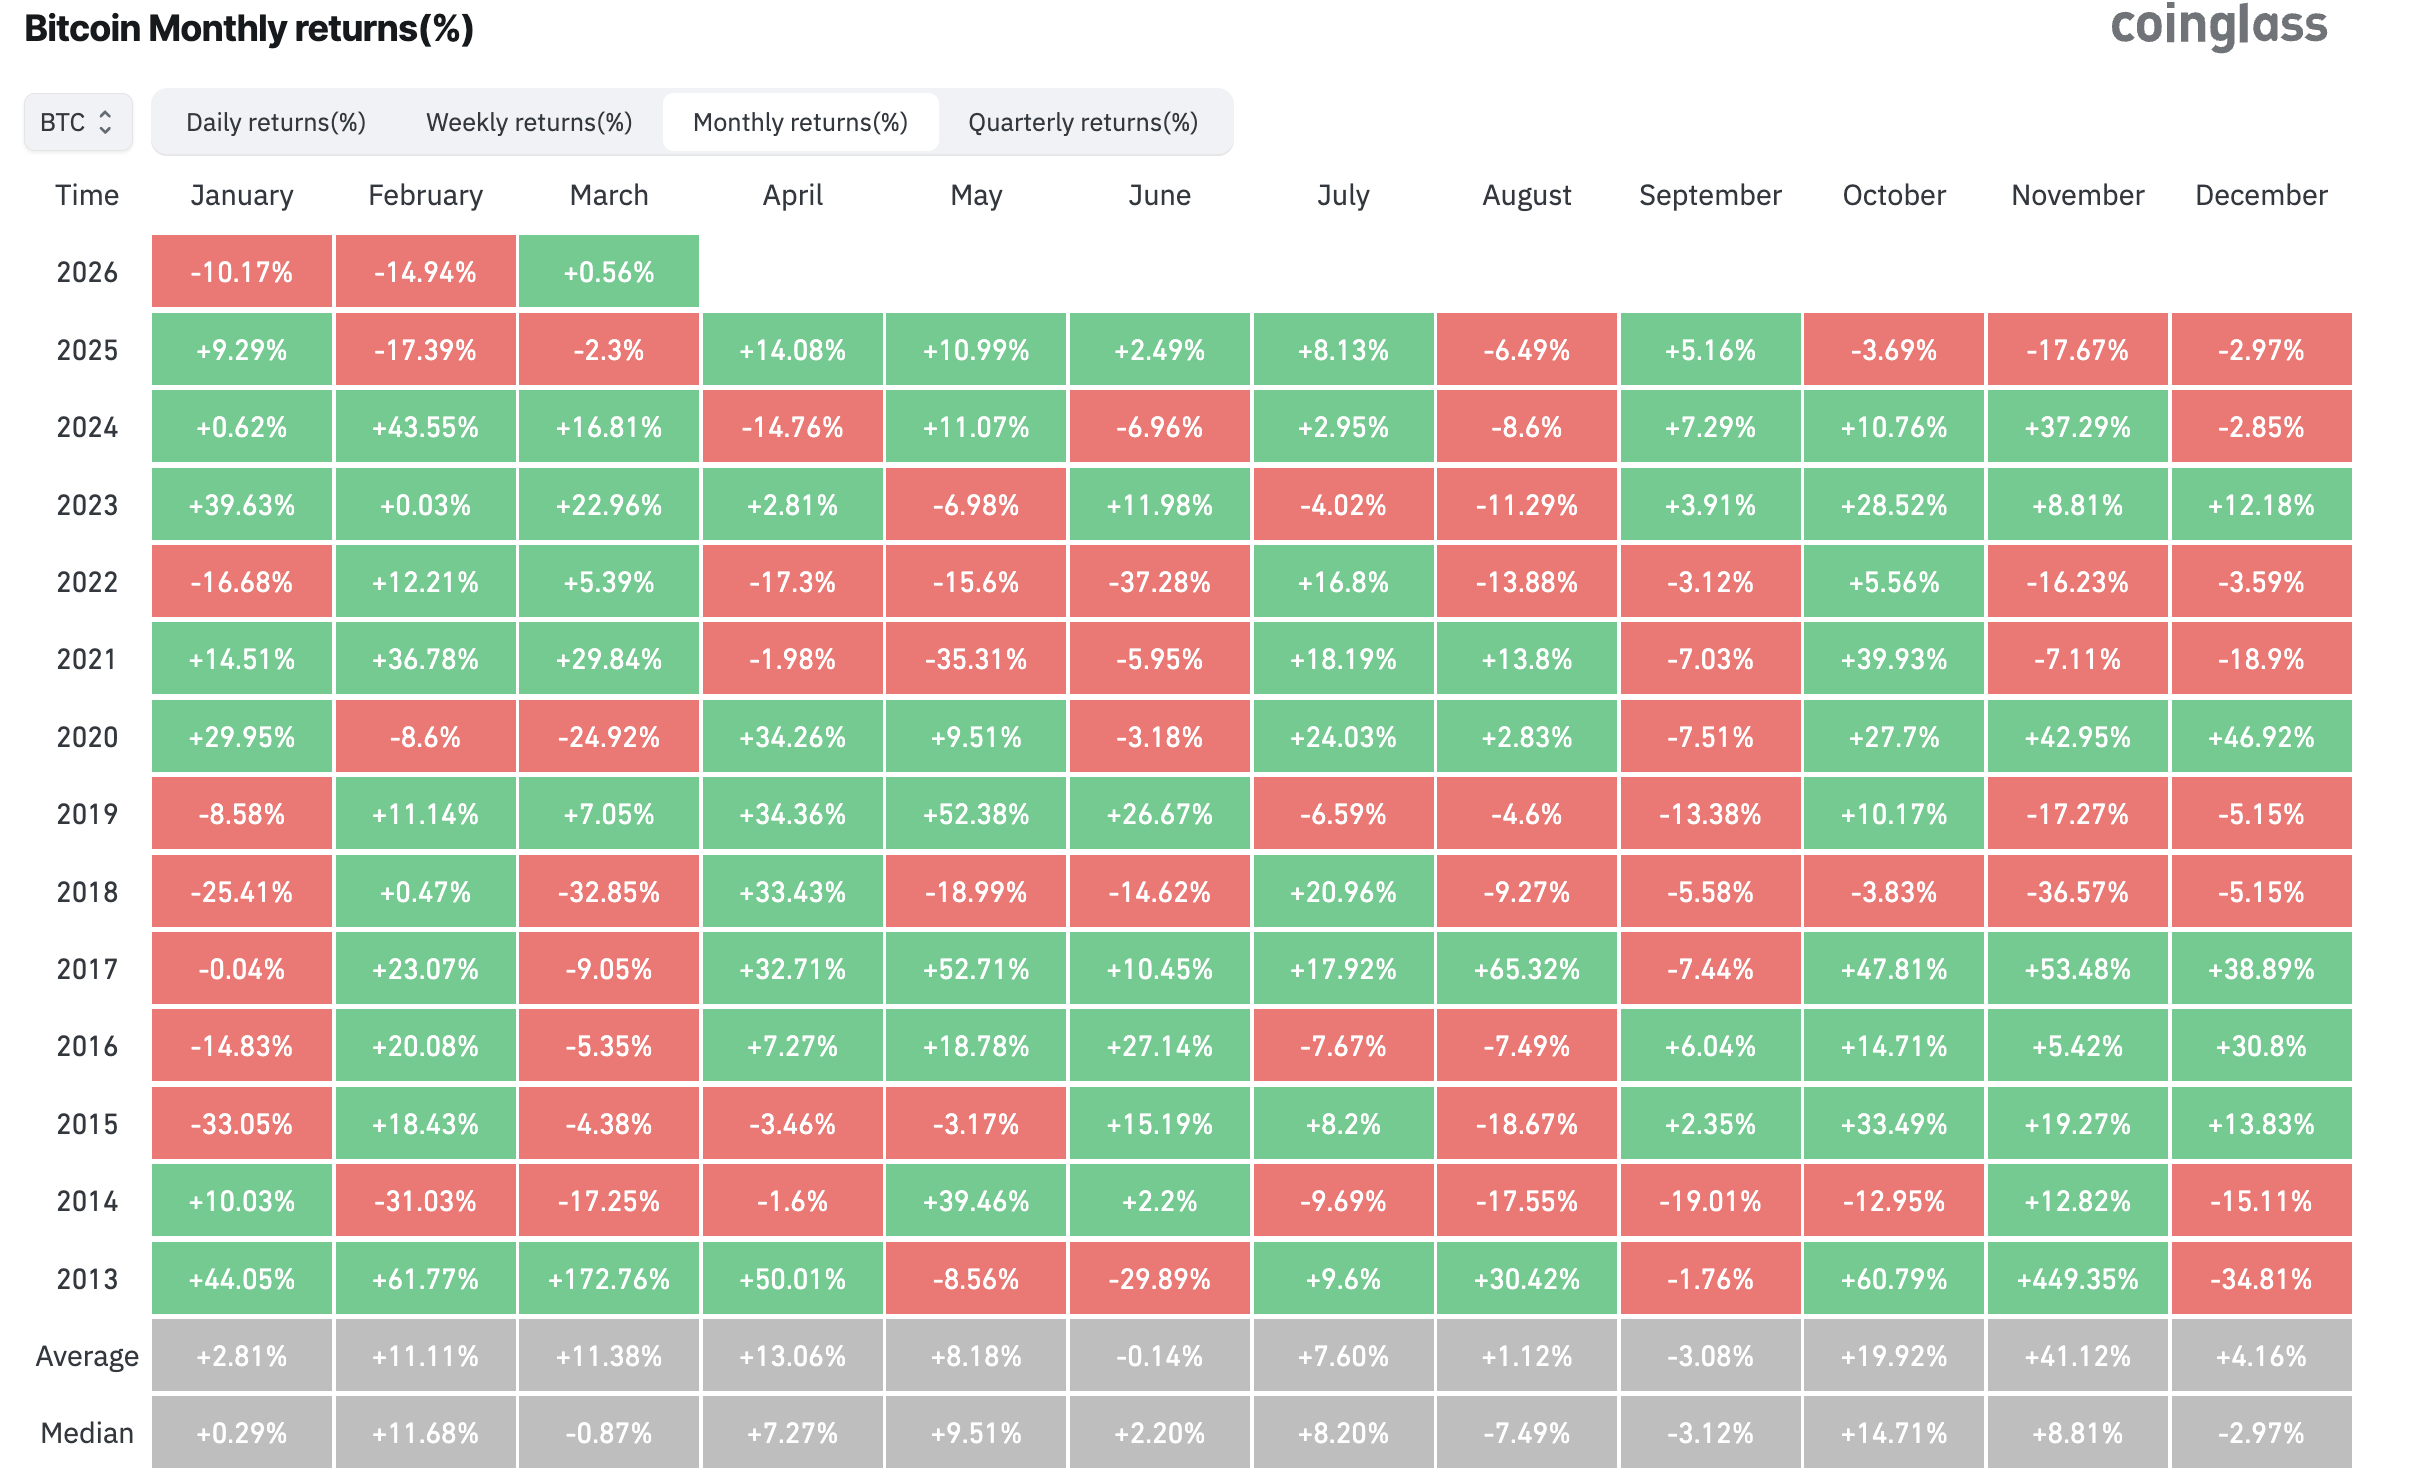
Bitcoin ($BTC) has posted five consecutive monthly declines since October 2025. In March, the cryptocurrency is currently up around 0.56% amid macro headwinds.
A red close would tie the 2018–2019 stretch as the longest consecutive monthly losing streak in Bitcoin’s recorded history.
The sell-off has pushed $BTC roughly 46.8% below its all-time high near $126,000. With the asset trading around $67,800, an on-chain indicator is now flashing a capitulation signal typically associated with market bottoms.
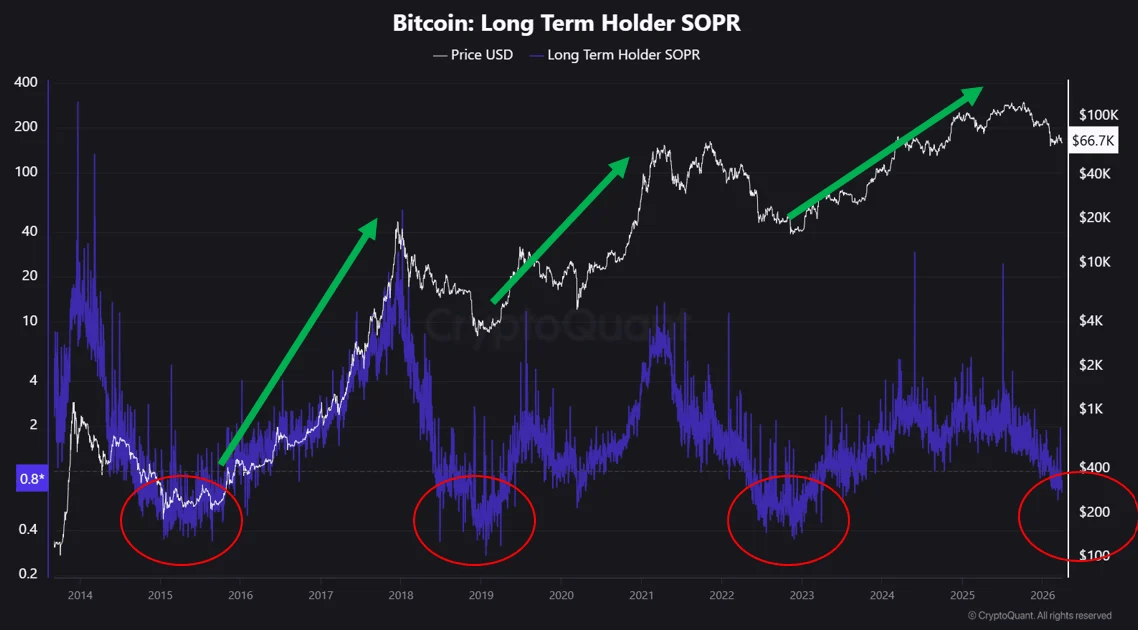
Analyst Crypto Dan flagged that the Long-Term Holder Spent Output Profit Ratio (SOPR) is below the 1.0 threshold. This means investors holding $BTC for over 155 days are now selling at a loss on average.
“Because long-term holders are the least sensitive to short-term volatility, a phase in which they begin to realize losses can be interpreted as a broader market-wide capitulation. By this point, short-term holders have likely already exited the market or suffered significant losses,” the post read.
When this metric falls below 1, it typically signals a phase in which even conviction-driven participants exit positions while absorbing losses.
The analyst said that historically, such readings have preceded the exhaustion of sell-side pressure. This, in turn, results in market bottoms or zones close to long-term lows.
“While it may be premature to identify the current market as the absolute bottom, a phase in which losses become widespread would likely represent the final stage of fear and the beginning of opportunity,” Dan added.
Previously, analyst Michaël van de Poppe pointed to the $BTC/Gold ratio chart, which shows a roughly 70% drawdown from its peak.
“In any bear market, bottoms are found after a 70-85% correction. On top of that, we’re already in a bear market for 13-14 months, and historically, that’s when $BTC has bottomed out vs. Gold. This time won’t be different,” he said.
However, on-chain analyst Willy Woo presented a more cautious outlook. Woo, citing “old school onchain models,” noted that $BTC could bottom between $46,000 and $54,000.
Old school onchain models suggest a $BTC bottom between 46k-54k. Also hints at how much time we have to wait.
Orange line correlates to the capital stored in $BTC and it has been leaving since November.
CVDD Floor Model has the advantage of climbing over time, 45.5k right now. pic.twitter.com/PrfFTgwAyA
— Willy Woo (@willywoo) March 30, 2026
This aligns with other analysts’ views who project a potential bottom forming below $40,000, suggesting the current sell-off may still have further to go.