Bitcoin has declined by about 50% this market cycle, far less than in previous cycles, Fidelity Digital Assets said, adding this trend could continue over time.
Bitcoin’s post-all-time-high drawdowns have historically been steep, at about 80% to 90%, but this cycle has been about 50%, Fidelity Digital Assets research analyst Zack Wainwright said Tuesday.
One can see the “diminishing returns” that have developed from cycle to cycle when looking at Bitcoin’s price performance from the perspective of the previous all-time high, he said.
“Each cycle has been less dramatic to the upside than the previous,” he said. “Downside risk has been less dramatic in 2026, the current cycle, as well,” he added.
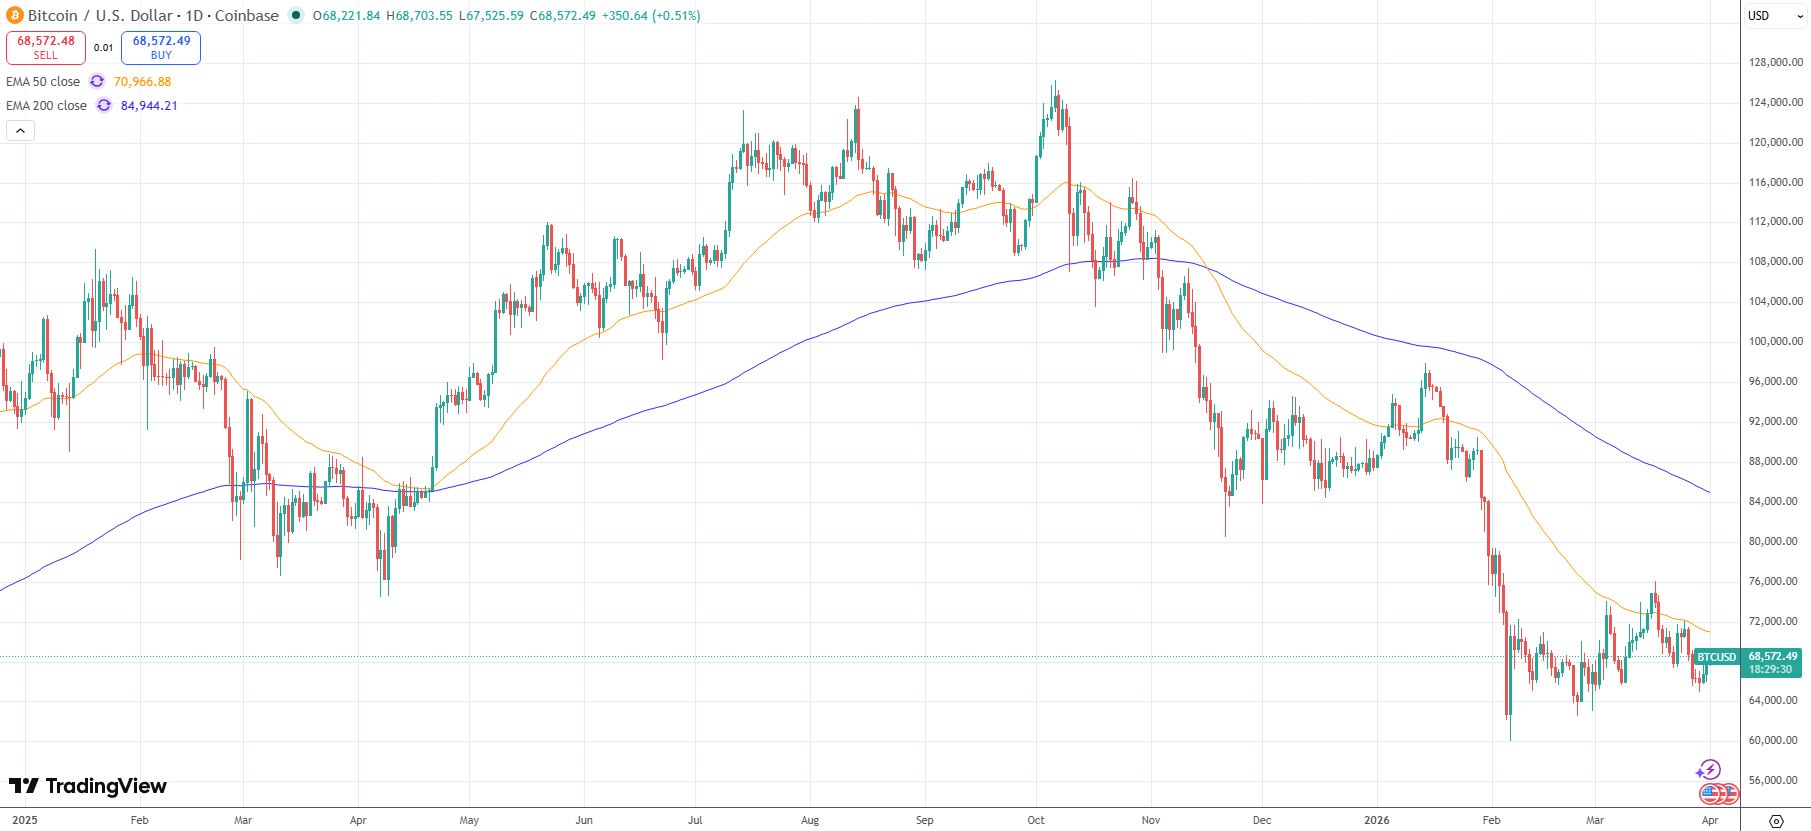
Bitcoin’s price hit its current cycle low of just over $60,000 on Feb. 6, a decline of 52% from its Oct. 6 all-time high of about $126,000, according to TradingView. It is currently down 46% from its peak six months ago.
The previous cycle saw a much larger decline of 77%, from the 2021 all-time high of $69,000 to a bear market low just below $16,000 in November 2022.
Bitcoin may bottom in late September
Fidelity’s assessment that this Bitcoin cycle is notably shallower than prior cycles “indicates a maturing market with reduced volatility and stronger institutional confidence,” Nick Ruck, director of LVRG Research, told Cointelegraph on Wednesday.
“This shift signals that Bitcoin is changing from a speculative asset toward a more stable store of value, potentially paving the way for greater adoption in the future.”
Related: Bitcoin’s $10K range expected to hold until spot traders show up: Data
Meanwhile, Alphractal founder Joao Wedson observed Tuesday that Bitcoin’s top occurred 534 days after the last halving, a shorter span than in the previous cycle.
This “decaying pattern” across cycles suggests the historical bottom may occur between 912 and 922 days after the halving, which “points to a bottom in late September or early October 2026,” he said.
$BTC is below key daily moving averages
Bitcoin remains below the key 50-day and 200-day exponential moving averages, two long-term trend indicators.
It is hovering at the 200-week EMA, around $68,000, which has served as a key level of support during previous market downturns.
Magazine: Nobody knows if quantum secure cryptography will even work