
Bitcoin Crash Reason: What Caused the Bitcoin Drop?
The Federal Reserve’s decision to hold rates steady on July 30 created macro pressure on risk assets. Bitcoin, which had consolidated below the $123K resistance, finally gave in and triggered a cascading sell-off across the market. Crypto tends to perform better in low interest environments, and this “no-cut” policy stalled any bullish momentum.
BTC Coin Price: Chart Breakdown
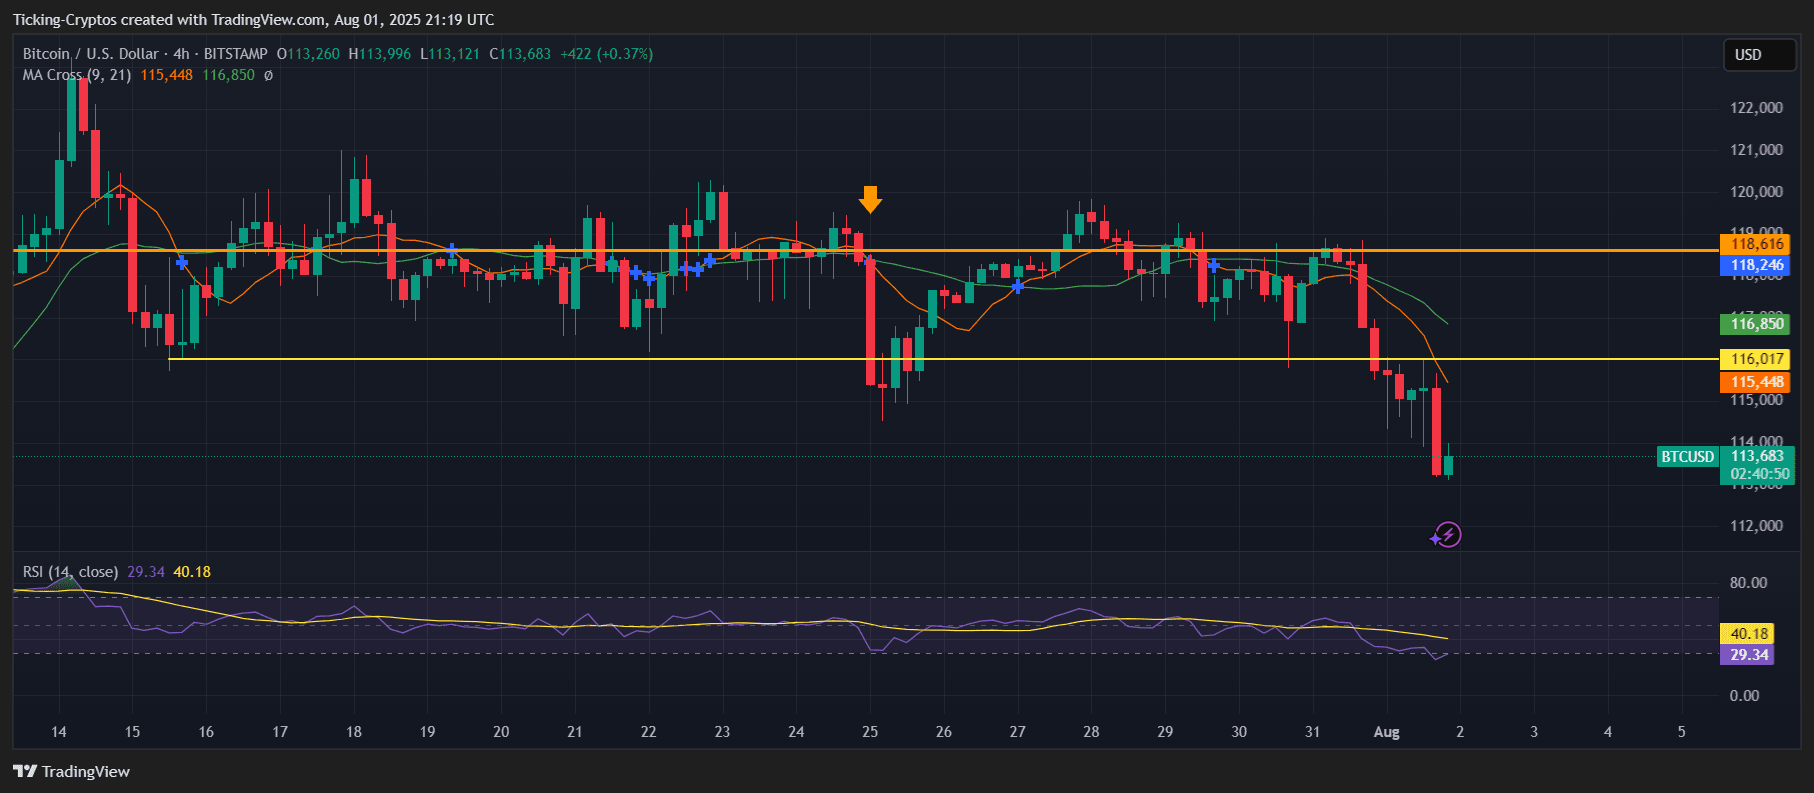
BTC/USD 4-hours chart – TradingView
- Failed breakout at $123K, followed by range-bound movement between $116K–$118K
- Clean breakdown below $116K, which is now flipped into resistance
- 9/21 MA bear cross, with 9MA (orange) curving sharply down
- RSI at 29.34 → oversold zone, but with no bullish divergence yet
What to Watch Next for BTC
- Immediate support sits near $111K–$112K. If this breaks, we could see Bitcoin drop toward $108K or even $104K short-term.
- A potential relief bounce may occur, but it must reclaim $116K to flip the structure.
- Keep an eye on volume – if we see high sell volume near $111K, the market may accelerate downward.
- Macro events like further Fed commentary or inflation data could inject new volatility.
$BTC, $Bitcoin