Skip to content
  • Home
  • Bitcoin
  • Business
  • Blockchain

Copyright the voice of money 2026 | Theme by ThemeinProgress | Proudly powered by WordPress

the voice of money
  • Home
  • Bitcoin
  • Business
  • Blockchain
Bitcoin Article

Bitcoin On-Chain Technical Data Released: Here’s What It Tells Us

On April 9, 2026 by voice

Current on-chain data in the cryptocurrency market continues to generate important signals regarding investor behavior and market psychology. In particular, both derivative data and on-chain indicators present a noteworthy picture for Bitcoin.

According to data from the last 24 hours, while the Bitcoin price was trading around $72,280, a total of $327.18 million in liquidations occurred in the market. Of these liquidations, $237.64 million consisted of long positions, while short (bearish) positions accounted for $89.54 million. The data indicates that approximately 72.6% of the liquidations were long positions, suggesting a sharp cleanup in the market following overly optimistic short-term positioning.
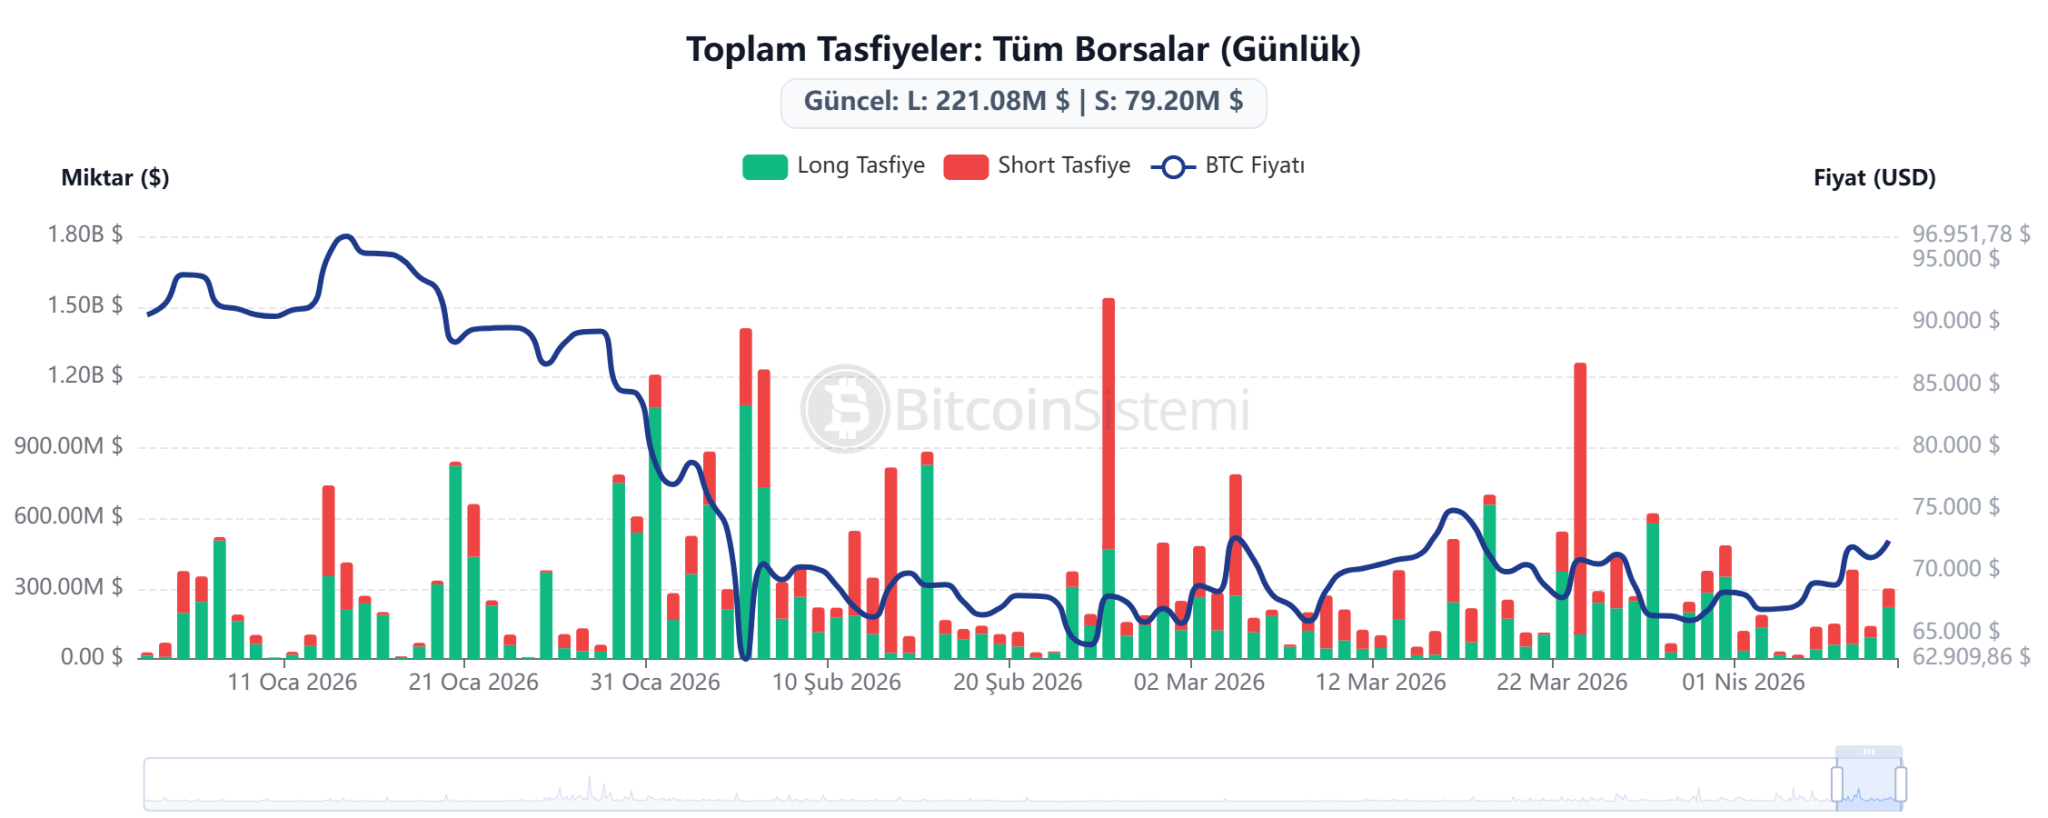
A graph comparing Bitcoin price and liquidations.

On the other hand, the fear and greed index, which measures market sentiment, continues to remain in the “Extreme Fear” zone. The current score is at 14, while it was measured at 17 yesterday, 12 last week, and 13 last month.

Another important metric that stands out on the on-chain side is the “actual price.” For Bitcoin, this level is around $54,200, and the fact that the current price is well above this level indicates that the market as a whole is in profit. This suggests that this level could act as a strong support zone in uptrends. In past cycles, the price approaching this level has been seen as points where selling pressure weakened and buyers stepped in.
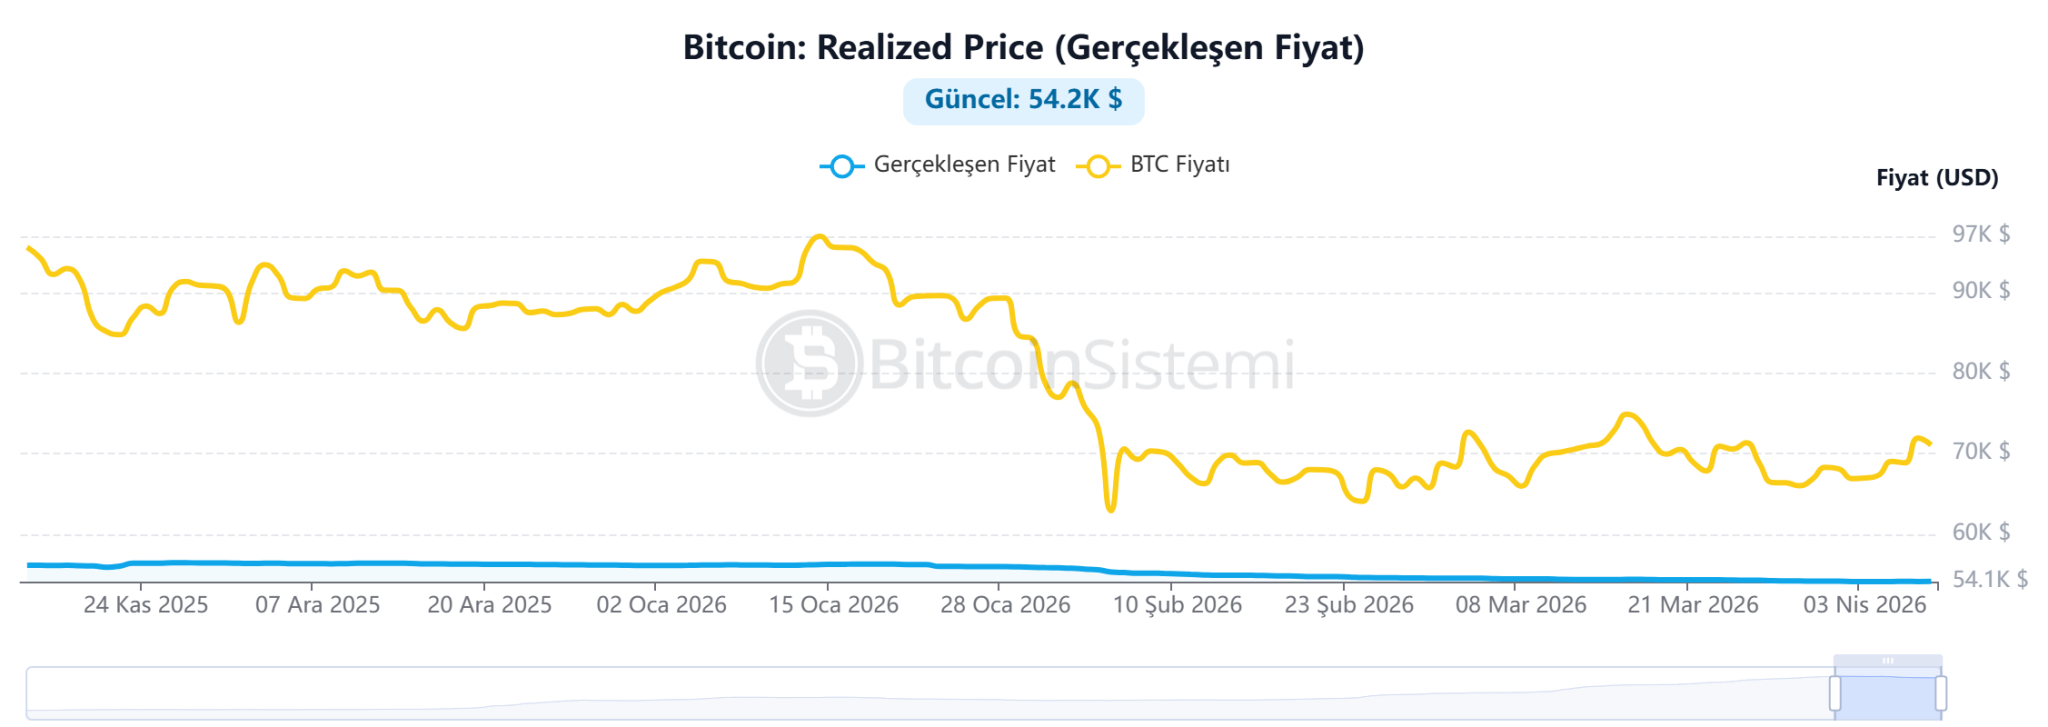
A graph showing the price data for Bitcoin.
Related News One of the People Closest to Satoshi Nakamoto: “Adam Back Is Not Satoshi”

However, the MVRV ratio is also measured at 1.31. This value indicates that the market is neither excessively cheap nor excessively expensive, but rather “close to equilibrium but in a slightly profit-taking zone.” Historically, an MVRV below 1 is considered a bottoming-out signal, while levels above 3.7 are seen as a bubble and peak warning. The current outlook suggests that the market has not yet overheated, but investors are in profit.
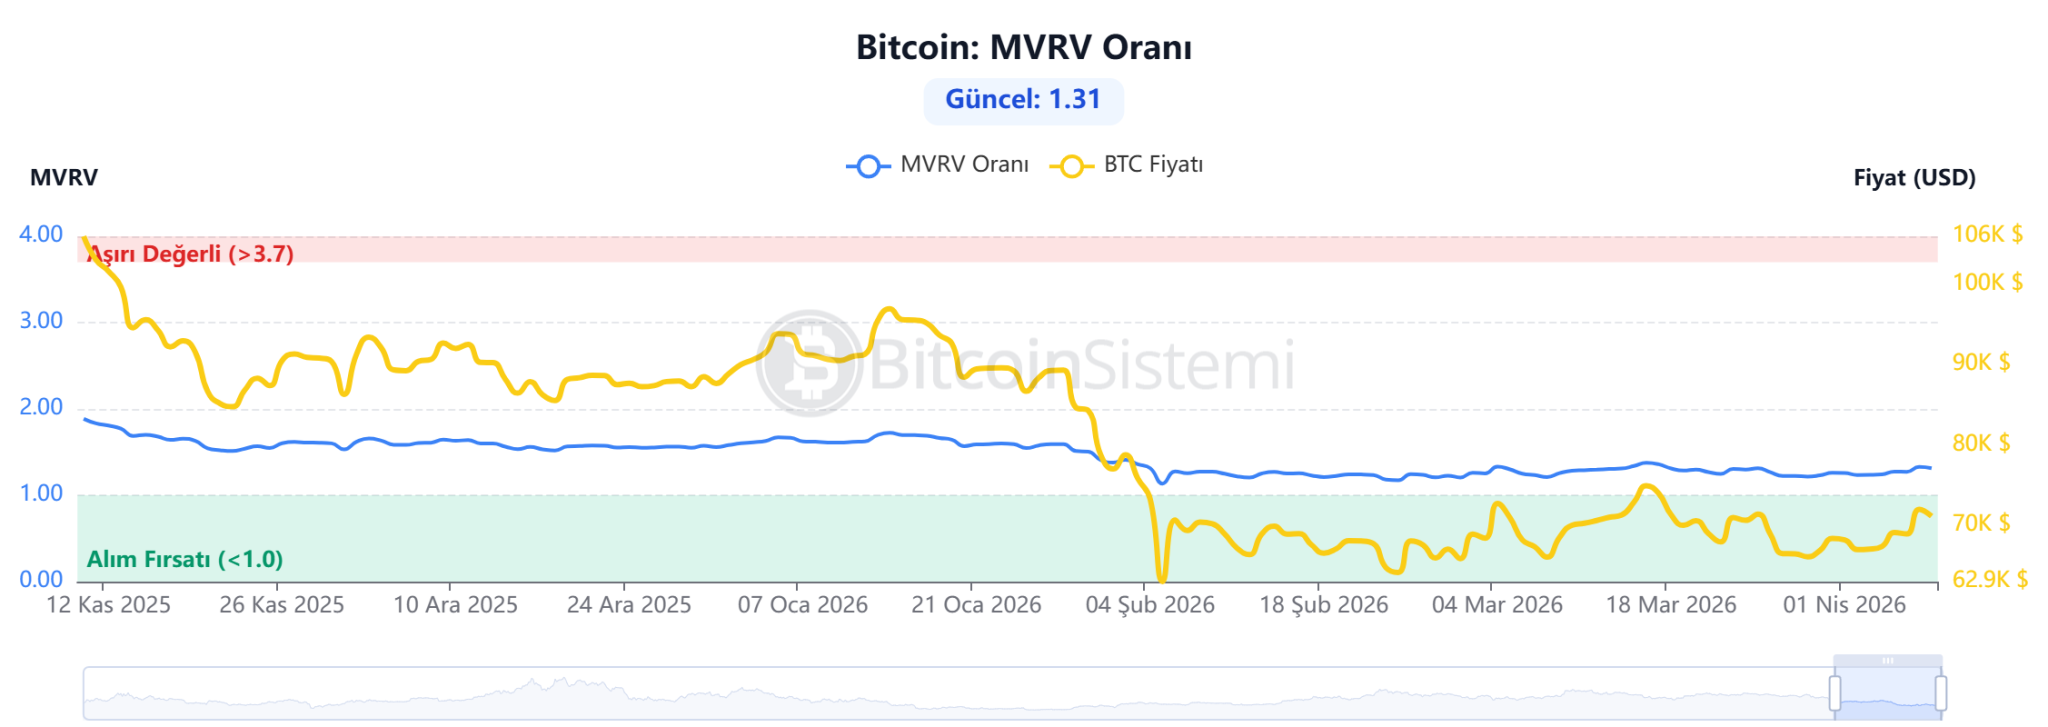
A graph comparing MVRV value with Bitcoin price.

*This is not investment advice.

You may also like

A Bitcoin Treasury Company Has a Doctor on Staff, But Why?

Bitcoin Price Could Fall To $72.5K Before Next Rebound — Here’s Why

Strategy Pauses Bitcoin Buying as Saylor’s ‘BitVac’ Comment Puts Next BTC Buy on Watch

Archives

  • May 2026
  • April 2026
  • March 2026
  • February 2026
  • January 2026
  • December 2025
  • November 2025
  • October 2025
  • September 2025
  • August 2025
  • July 2025
  • June 2025
  • May 2025
  • April 2025
  • March 2025
  • February 2025
  • January 2025
  • December 2024
  • November 2024
  • October 2024
  • September 2024
  • January 2024
  • December 2023
  • January 2023
  • December 2022
  • January 2022
  • December 2021
  • January 2021
  • December 2020
  • December 2019

Calendar

May 2026
M T W T F S S
 123
45678910
11121314151617
18192021222324
25262728293031
« Apr    

Categories

  • Bitcoin
  • Blockchain
  • Business
  • Markets

Archives

  • May 2026
  • April 2026
  • March 2026
  • February 2026
  • January 2026
  • December 2025
  • November 2025
  • October 2025
  • September 2025
  • August 2025
  • July 2025
  • June 2025
  • May 2025
  • April 2025
  • March 2025
  • February 2025
  • January 2025
  • December 2024
  • November 2024
  • October 2024
  • September 2024
  • January 2024
  • December 2023
  • January 2023
  • December 2022
  • January 2022
  • December 2021
  • January 2021
  • December 2020
  • December 2019

Categories

  • Bitcoin
  • Blockchain
  • Business
  • Markets

Copyright the voice of money 2026 | Theme by ThemeinProgress | Proudly powered by WordPress