Normally, mixed signals tend to create a volatility loop as momentum builds on speculation.
Looking at Bitcoin [$BTC], it seems to be playing out the same way. According to CoinGlass, Open Interest (OI) has jumped back to early February levels, crossing $55 billion, the biggest spike since the war started. But back in February, $BTC was trading above $75k, while this time it’s still struggling below that key resistance.
This divergence suggests leverage is building up faster than spot price strength, which typically leads to elevated short-term volatility. In this kind of environment, calling a Bitcoin bottom therefore looks a bit premature, and on-chain metrics seem to support that view as well.
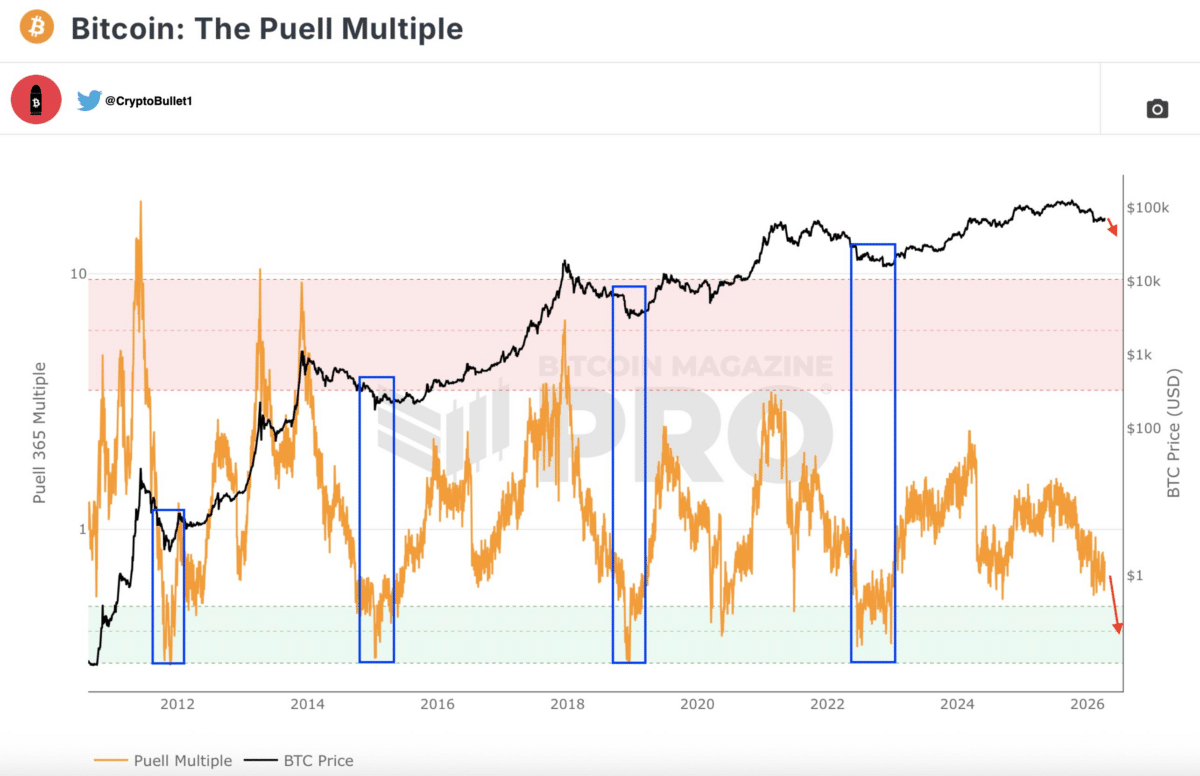
The Puell Multiple is one of those indicators that looks at miner revenue. Historically, every major $BTC bear market bottom has lined up with the Puell Multiple dropping into the green “undervalued” zone.
However, as the chart shows, Bitcoin hasn’t entered that bottoming box yet, which suggests the market may still be in a transitional phase rather than a confirmed cycle bottom. Combined with the post-halving trend, analysts are also pointing out that $BTC’s 4-year cycle still seems to be playing out in a pretty textbook way.
Because of that, some are eyeing Q4 2026 as a potential bottoming window, with downside scenarios clustering around the $40k region. However, “smart money” doesn’t seem to fully align with that narrative, suggesting traders are positioning more dynamically rather than strictly following cycle-driven setups.
In short, the current setup around Bitcoin’s $75k resistance splits the market. Naturally, this raises the question: Are these mixed signals setting $BTC up for a volatility loop, reinforcing that a clean bottom is still premature? Or is this divergence setting up a bear trap instead?
Bitcoin’s technical setup and current on-chain signals both start to lean toward a bearish bias.
At the macro level, Bitcoin reacted sharply after the U.S. Vice President JD Vance left Pakistan and called the peace talks with Iran a “failure.” The news triggered an immediate risk-off move, with $BTC sliding 1.87% intraday. More importantly, it also flushed leverage out of the system, wiping out nearly $48 million in long positions and marking the largest long liquidation event of the month so far.
At the same time, Bitcoin’s long-term holder supply continues to climb steadily. As the chart shows, roughly 200,000 $BTC have accumulated in this cohort this month alone. This creates a clear split in sentiment: fear dominates short-term price action, while long-term holders continue to accumulate into weakness.
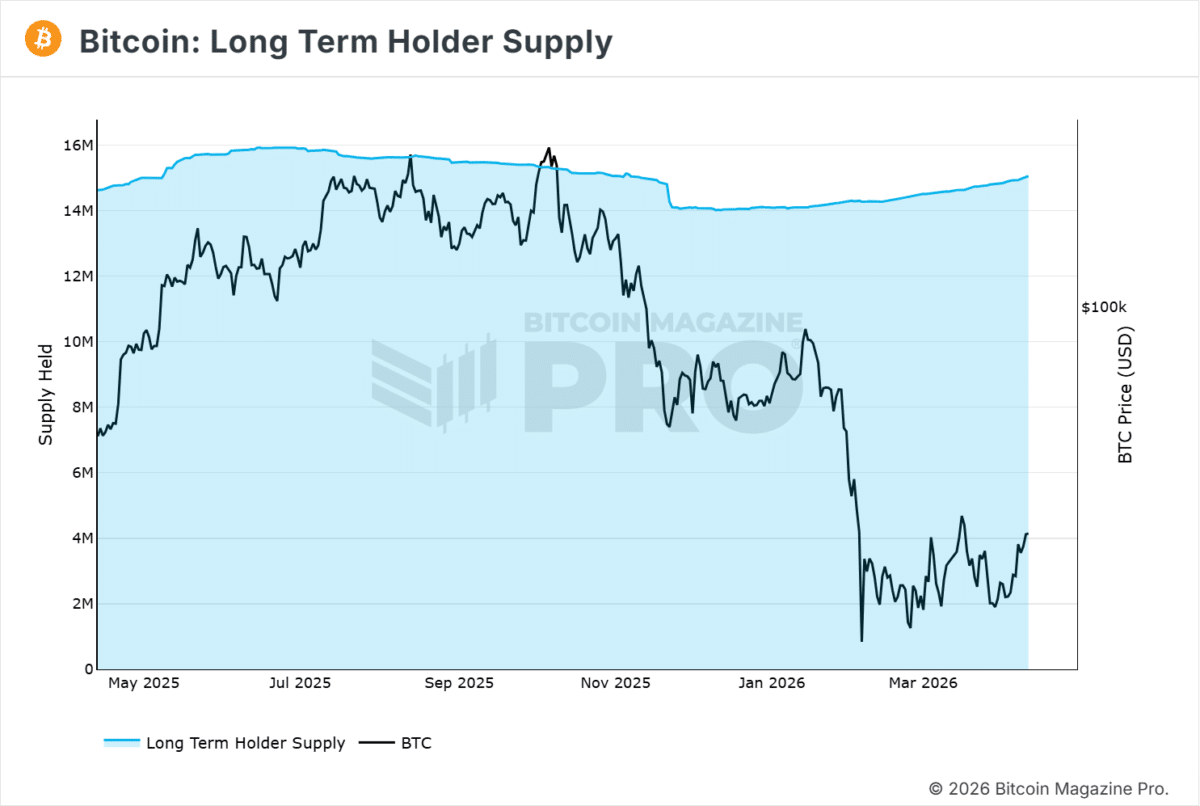
According to AMBCrypto, this setup resembles a textbook bullish divergence.
As weak hands exit and overheated derivatives cool down, bearish on-chain signals continue to keep retail cautious, while smart money steadily accumulates. Bitcoin now appears to be forming a classic bear trap structure, which could set the stage for a breakout above $75k, strengthening the broader bottom thesis.
Final Summary
- Leverage is building faster than spot strength, with Bitcoin’s mixed on-chain signals suggesting elevated volatility rather than a confirmed bottom.
- While weak hands exit, long-term holders continue accumulating, creating a divergence that could fuel a bear trap near $75k.