Two months ago, Bitcoin was sitting near $60k with a deeply oversold RSI, capitulation-level on-chain readings, and a market that had largely given up on the idea of a recovery.
Today, it is trading at $77.6k, moving toward the upper boundary of the $75k–$80k resistance band with improving momentum across every major timeframe.
The shift has been gradual, and the key question now is whether the move has enough conviction behind it to push through into higher territory.
Bitcoin Price Analysis: The Daily Chart
The descending channel that defined Bitcoin’s structure from October 2025 through early April is now firmly behind the price. The cryptocurrency has broken above it, cleared the 100-day moving average (~$74k), and is holding within the $75k–$80k resistance band, with the RSI trending higher around 60.
The former channel boundary and the 100-day MA near $74k–$75k are now key support levels, and the price has successfully retested them before pushing higher.
What lies directly ahead is the most consequential resistance test of this recovery. The $80k level is both a psychological threshold and a horizontal supply zone. Above that level sits another resistance cluster at $88k–$90k, where the 200-day MA and a significant supply zone converge. A weekly close above $80k would be the clearest signal yet that this correction is structurally over. However, losing $74k–$75k on a daily close would also be the first warning that the breakout is losing steam, making the next few sessions critical.
BTC/USDT 4-Hour Chart
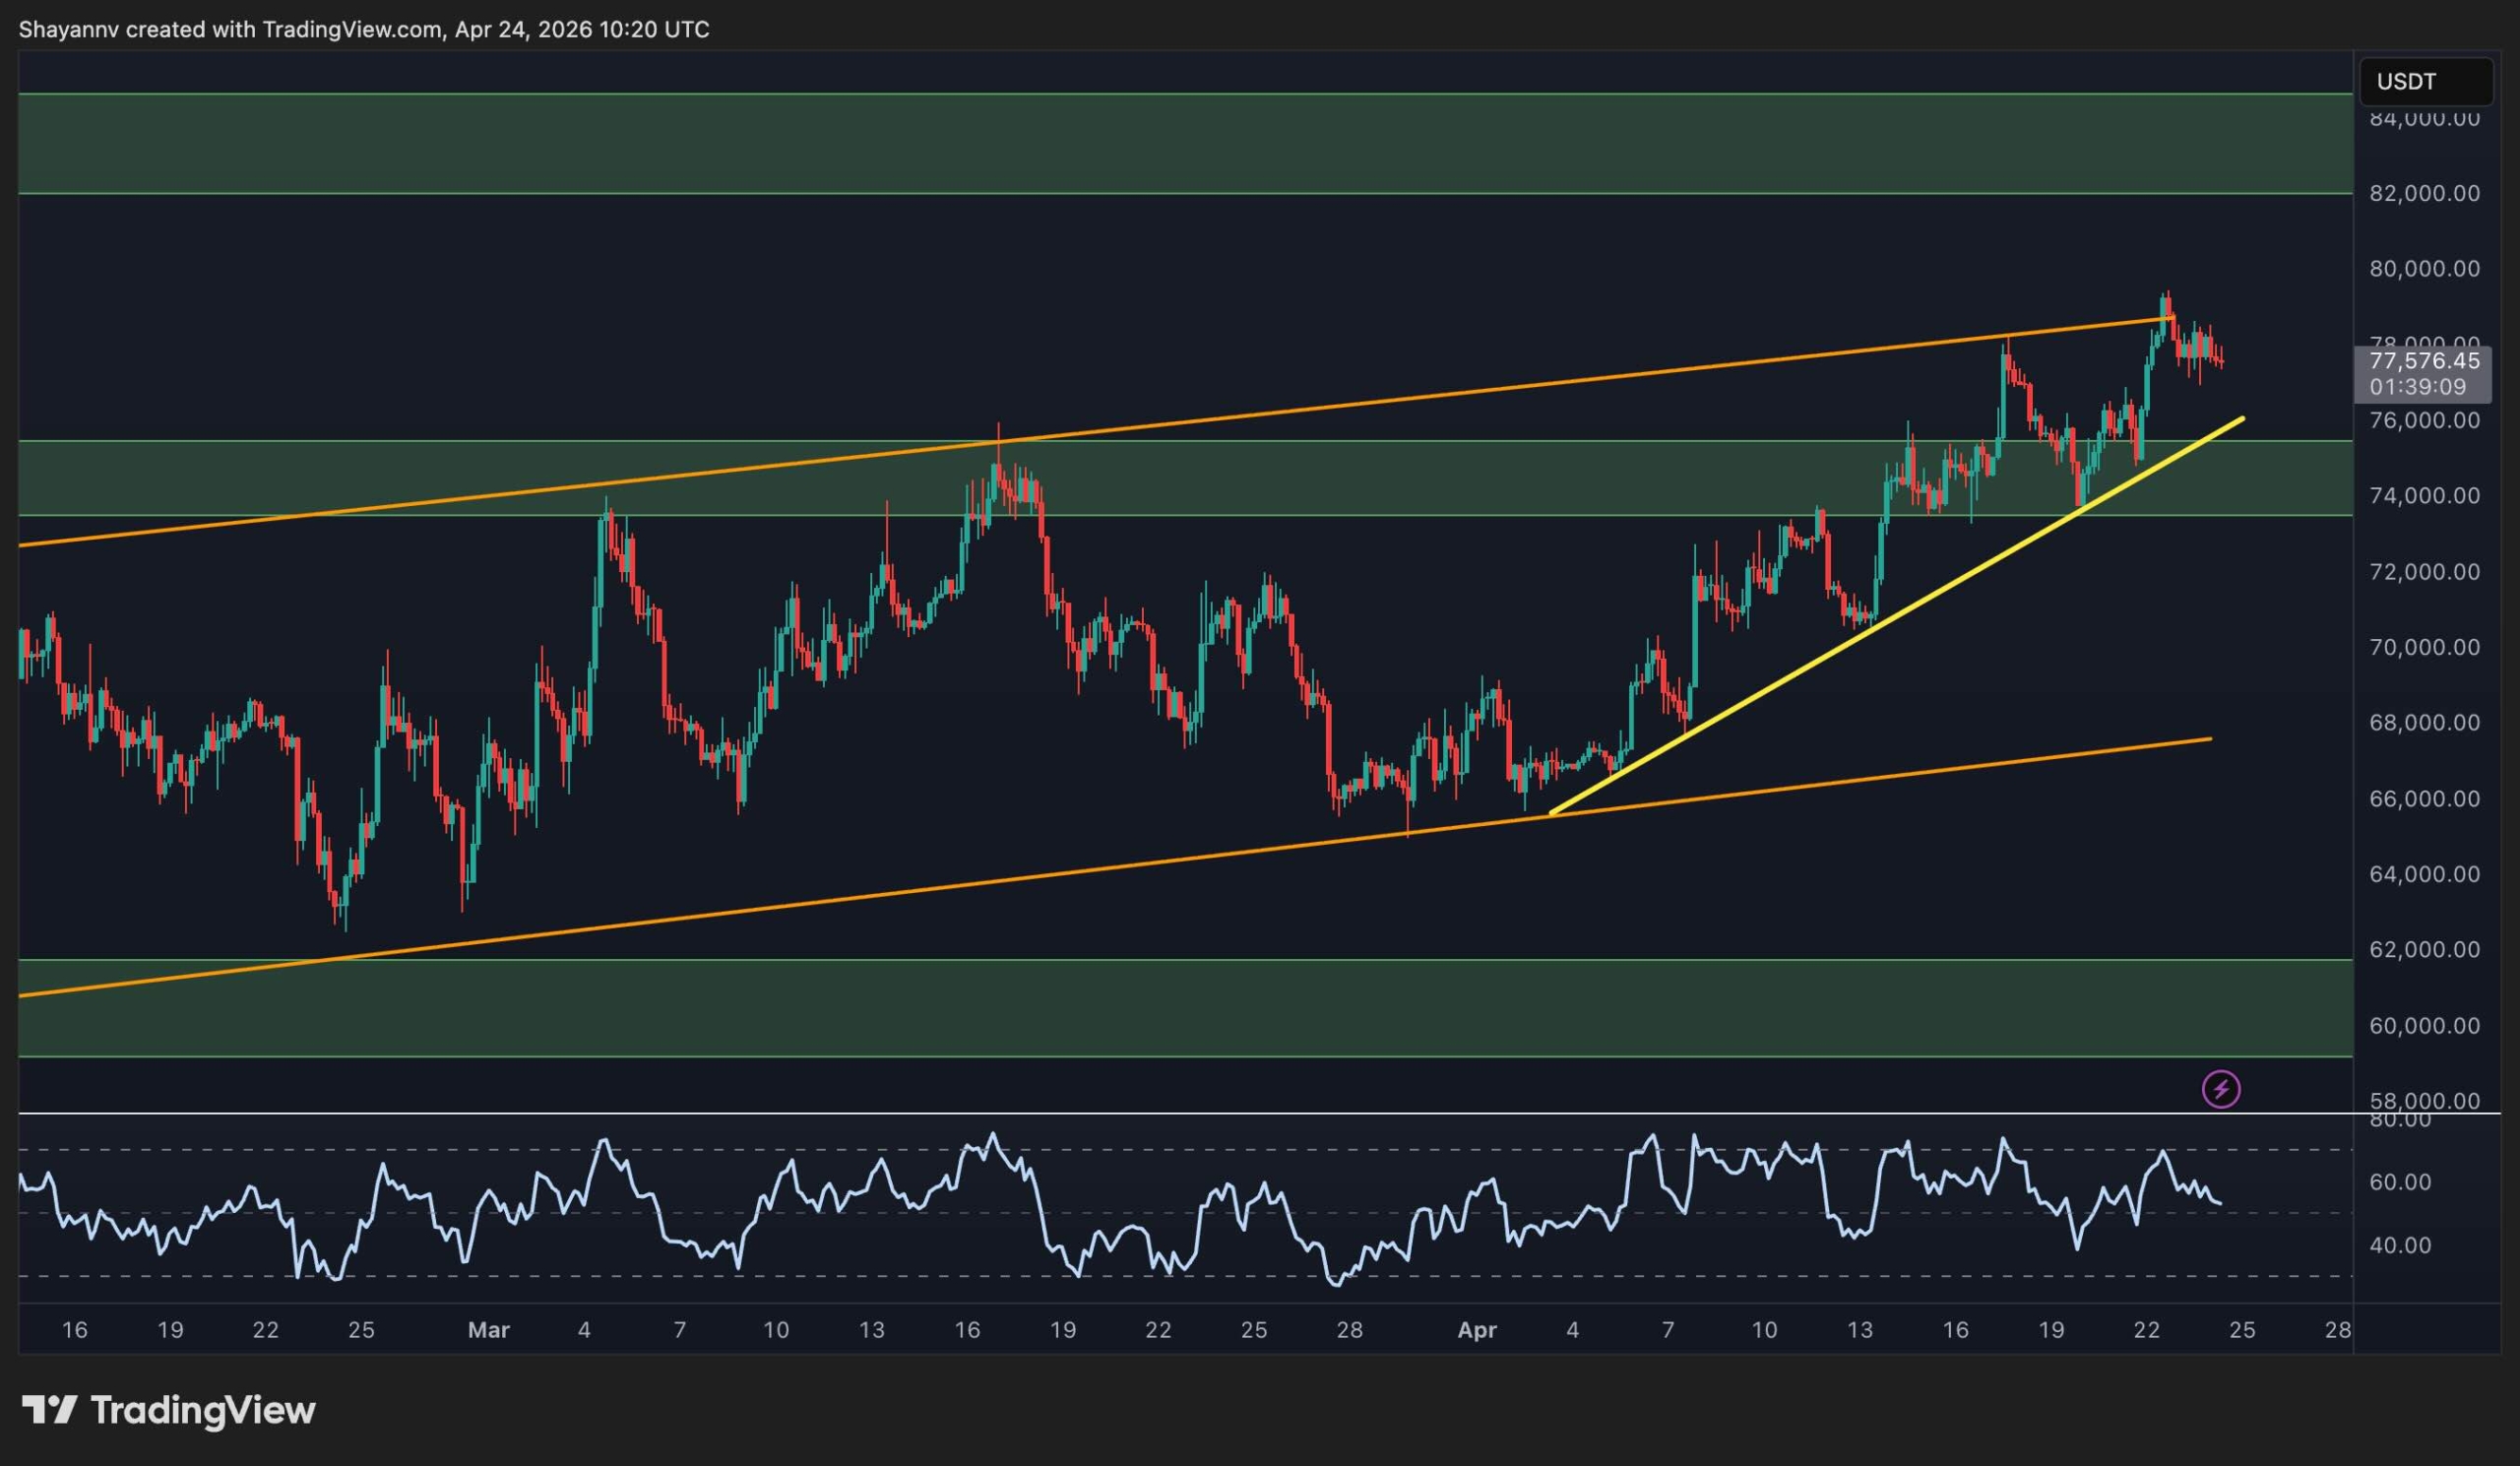
Something worth noting on the 4-hour chart is that a steeper, more aggressive ascending trendline has formed within the broader ascending channel since early April. It is essentially a channel within a channel. This shorter-term trendline has driven the recent push from $68k to $79k, and price is now riding it toward the $80k level.
The RSI on this timeframe is hovering slightly above 50, pointing to cooling short-term momentum. The immediate picture suggests consolidation is more likely than a blowoff top, with the short-term trendline near $76k as the first support on any pullback, and the $74k–$76k horizontal band providing a thicker cushion below. The setup favors continuation as long as neither level breaks on a closing basis.
On-Chain Analysis
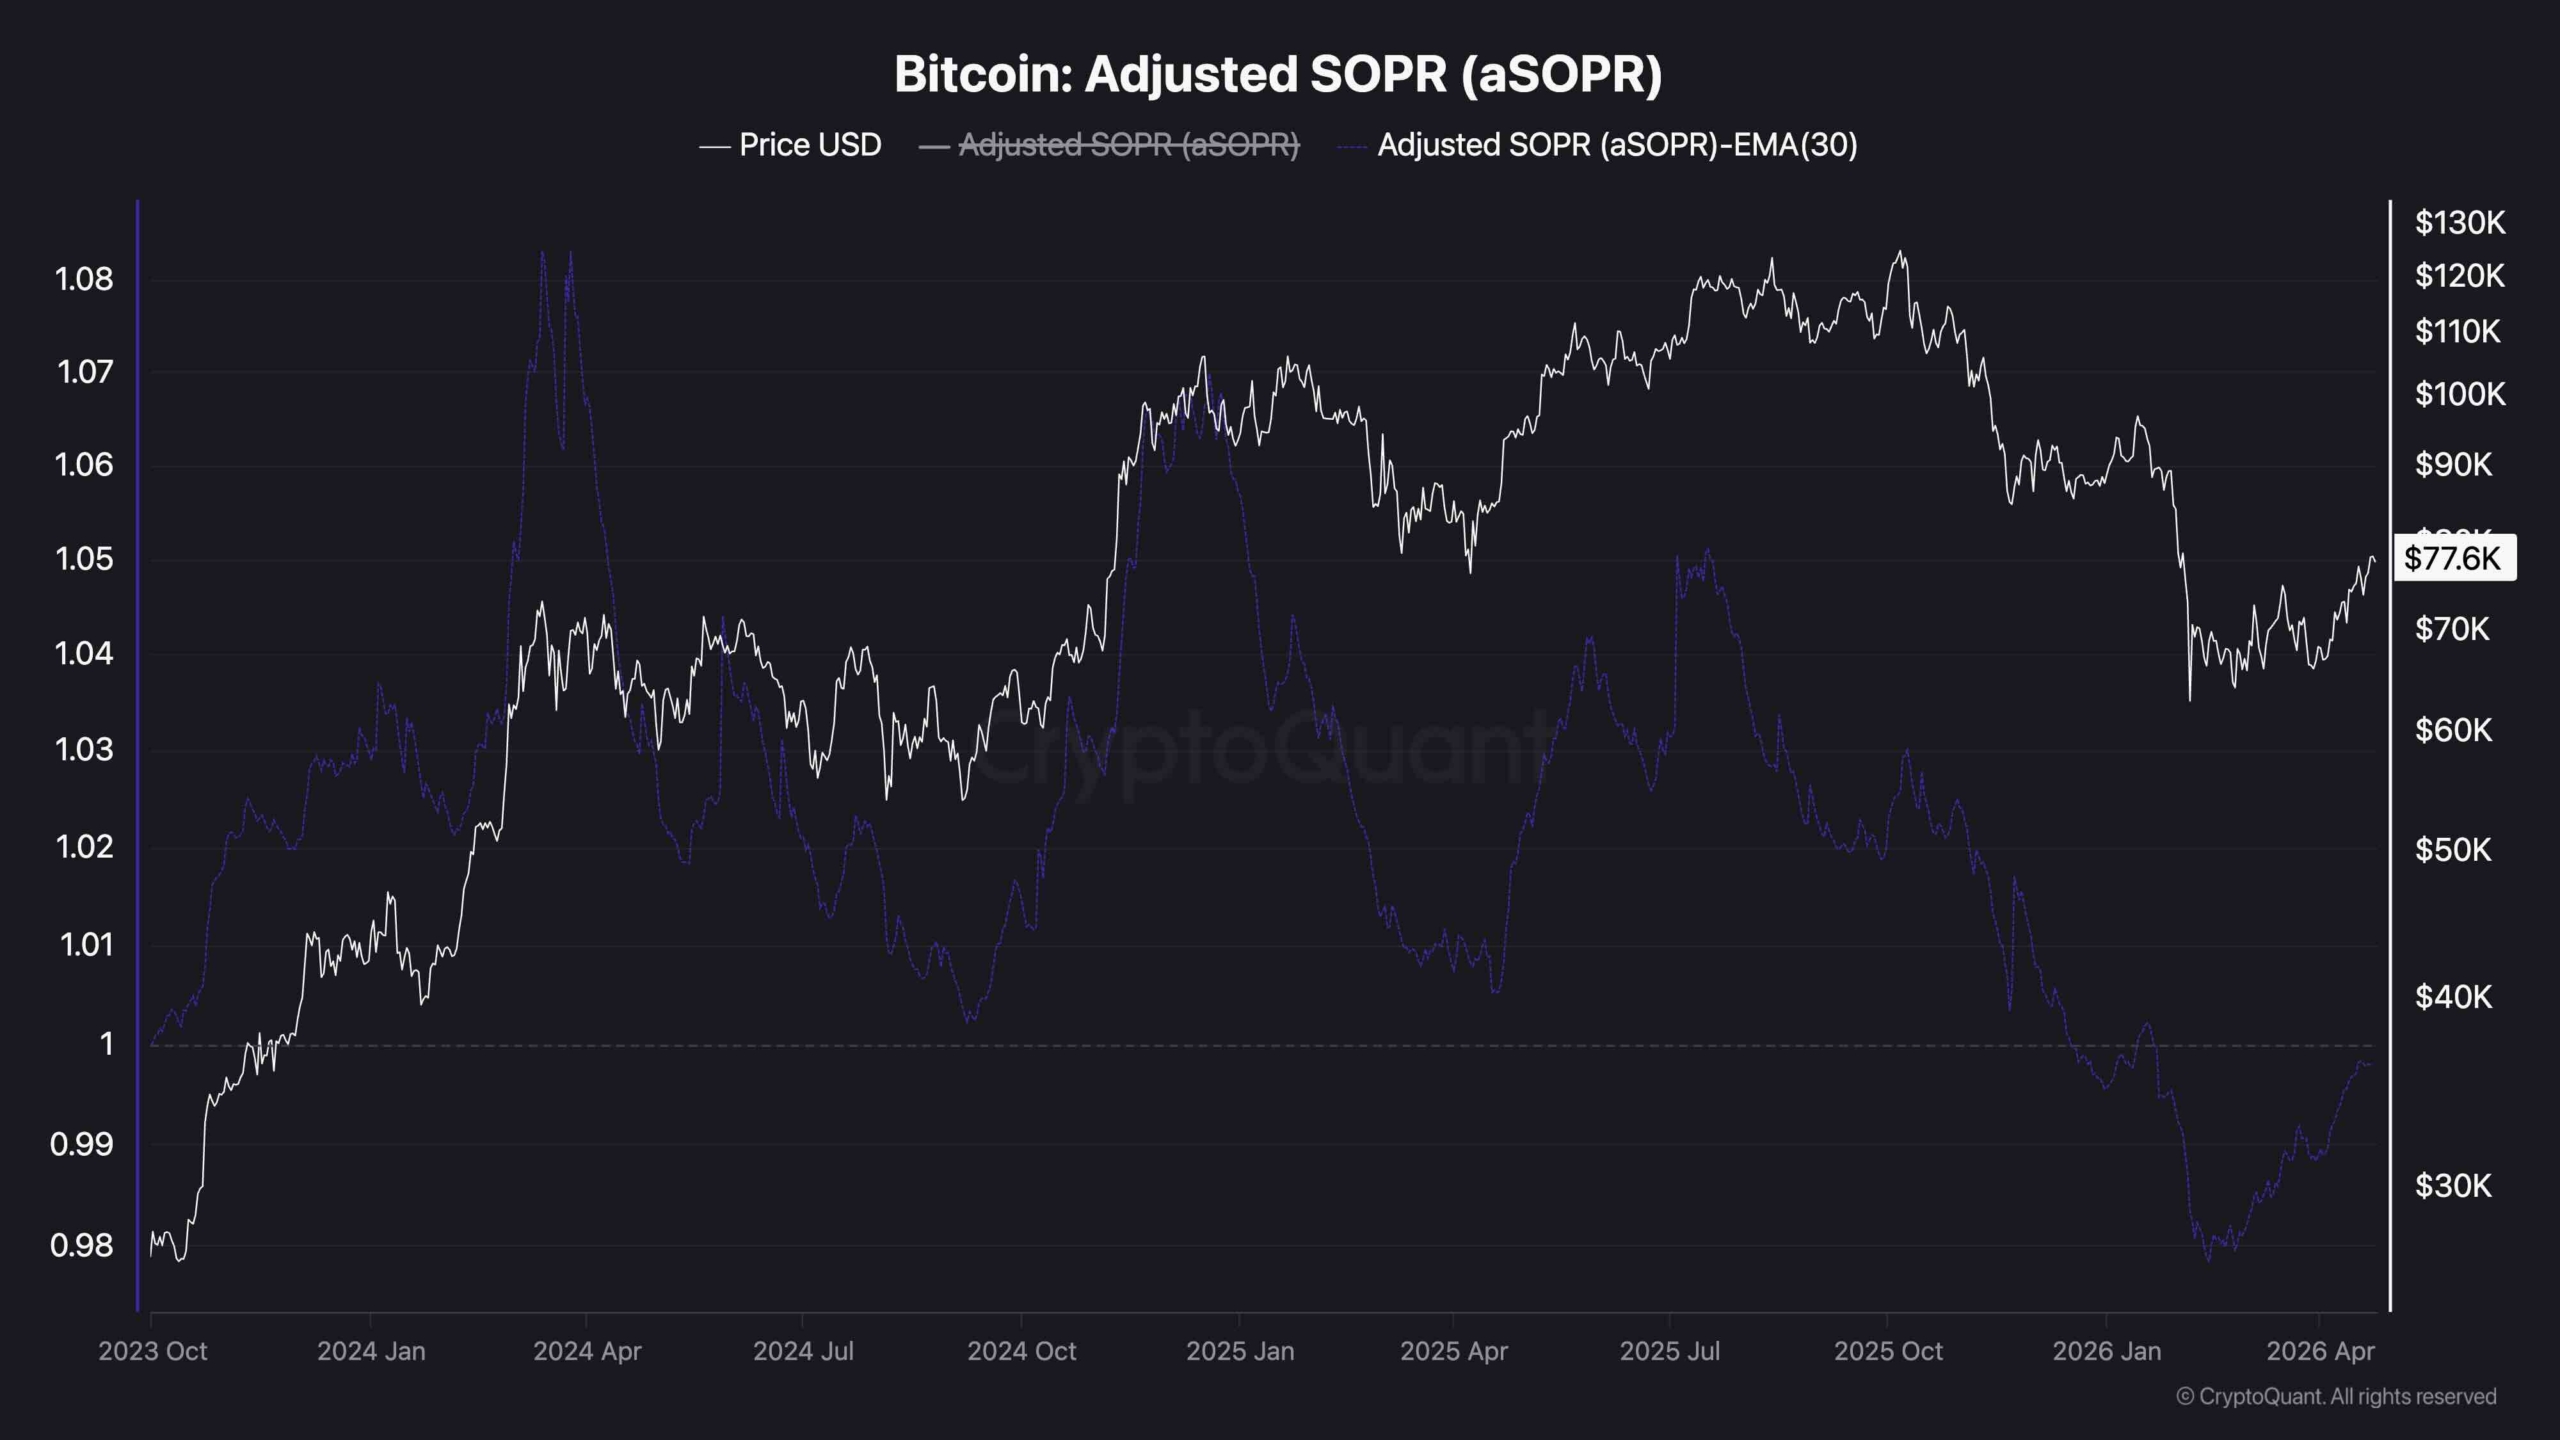
The aSOPR tells the most compelling story of all right now. After spending February and March printing values below 1.00, which means that coins were being spent at a loss on aggregate, the indicator is now recovering, and the 30-day EMA is reaching 1.0. This is a classic pattern seen at the early stages of previous bear market bottoms, but it would need to continue.
The significance of this recovery cannot be overstated. If aSOPR transitions from below 1.00 to sustainably above it, it marks the point at which the average coin being moved on-chain is back in profit. Historically, that transition has coincided with a shift in market psychology from capitulation and holding to cautious participation and smart money accumulation. The February low appears to have been the capitulation trough for this cycle. Whether $77k proves to be the early stage of a new leg higher or simply a strong relief rally will depend on whether price can break above $80k and the aSOPR can continue trending higher above 1.0, which would mean the market is back in a healthy bullish state.