Crypto analyst Kaz has called the local Bitcoin top, stating that the leading crypto has little room to the upside. The analyst also explained why $BTC is now likely to drop below the psychological $60,000 level, which would mark a new low for the crypto asset.
Bitcoin Top About To Form As Price Eyes Drop Below $60,000
In an X post, Kaz said Bitcoin is very close to a local top, despite market participants predicting a sustained rally to $90,000. He noted that the last local top formed around $97,000, when people were calling for a rally to $108,000, but it did not happen. Instead, $BTC was rejected from the daily Fair Value Gap (FVG) and recorded a massive decline.
Kaz stated that the same price action is playing out again, with Bitcoin very close to the local top and a daily FVG in place. The analyst predicted that $BTC might be rejected from the daily FVG and form a local top between $80,000 and $82,000. He also mentioned that the final range won’t dump in an instant but would rather be a slow bleed.
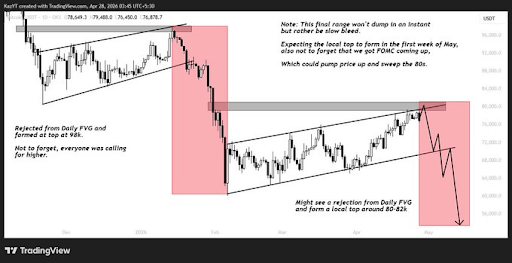
The analyst further pointed to the first week of May as when the Bitcoin top could form. Commenting on the current price action, he noted that $BTC has only swept the highs and has formed equal lows on the lower timeframe, which is very likely to get swept. His accompanying chart showed that $BTC could drop as low as $56,000 on the next move lower. Meanwhile, Kaz revealed that he will be adding to his short if $BTC sweeps the $80,000 range.
$BTC No Longer In A Bear Flag
In an X post, crypto analyst Colin stated that Bitcoin remains in the yellow channel, with $81,000 as resistance at the upper boundary. The analyst noted that a break above this upper boundary would be bullish while a break below the lower boundary at $72,000 would be bearish. He added that if $BTC continues to gradually climb within the channel, it will bump into overhead resistance between $80,000 and $86,000.
Colin warned that this is where Bitcoin will struggle to sustain its upward momentum and will likely find a local top, completing the relief rally. He explained that this range is highly likely to be a rejection point for $BTC, as there is a convergence of overhead resistance levels, the 200-day moving average (MA), and the upper range of the channel. His accompanying chart showed that $BTC could drop to around $66,000 when this relief rally is over.
At the time of writing, the Bitcoin price is trading at around $75,600, down over 2% in the last 24 hours, according to data from CoinMarketCap.