Bitcoin entered yesterday’s Fed decision already capped below a dense on-chain supply zone, and Fed Chair Jerome Powell’s press conference gave buyers little reason to push through it.
The Federal Reserve kept the target range at 3.5%-3.75% and explicitly linked elevated inflation to higher global energy prices, citing the tensions in the Middle East as a source of uncertainty for the economic outlook.
Powell added to that framing in his opening remarks, estimating that total PCE ran at 3.5% through March, core PCE at 3.2%, and that higher oil prices are set to push overall inflation up in the near term.
The committee also fractured in the most divided Fed vote since 1992. Eight officials held, one dissenter wanted a cut, while Hammack, Kashkari, and Logan objected to retaining any easing bias in the statement at all.
The internal split exposed the committee’s actual posture of easing bias and kept the language in the text, while three officials argued that the language was already too accommodating.
For Bitcoin, the consequence is a macro environment where a dovish pivot has become harder to price, even as the March Summary of Economic Projections still showed a median 2026 fed funds rate of 3.4%, implying one cut this year.
Futures markets came away pricing little chance of that cut materializing by year-end, with some traders putting a small probability on a hike over the next twelve months.
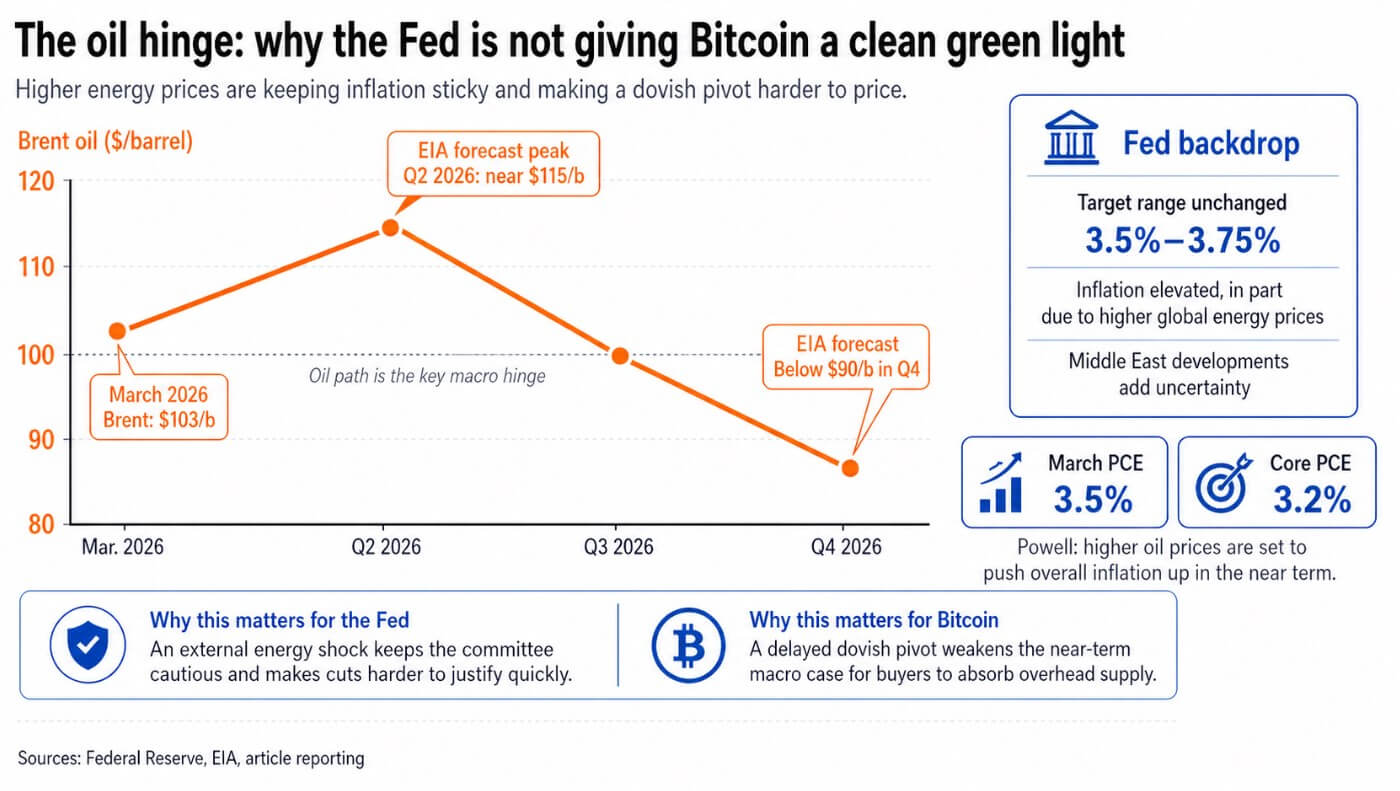
The oil hinge
The Fed’s inflation problem traces to an external energy shock that Powell said the central bank cannot control.
Brent oil averaged $103 per barrel in March, with the EIA forecasting a peak near $115 in the second quarter, followed by a decline below $90 in the fourth quarter.
Both headline and core inflation are running hot through separate channels, as energy is pushing up PCE, while tariff effects continue to work through core goods prices.
That two-channel setup prevents the Fed from quickly looking through the oil shock because the committee must first confirm that higher energy costs are not feeding into inflation expectations before justifying a cut.
Near-term inflation expectations are already running higher, according to Powell’s own account. Bitcoin sits below a heavy supply zone at the moment, and the macro case for absorbing that supply has the least near-term traction.
Where Bitcoin gets stuck
Glassnode’s latest report places Bitcoin’s key resistance at the True Market Mean, near $78,000, and the short-term holder cost basis around $79,000.
Both levels converge into a supply zone between $78,000 and $80,000 that $BTC has already tested and rejected. The pattern Glassnode describes is a classic bear-market rally structure: price rallies to the breakeven zone for recent buyers, those holders distribute into strength, and incoming demand fails to absorb the supply at that level.
Spot $BTC trading near $75,900 puts it below that resistance band and close to $76,000, which Glassnode flags as a downside short-gamma zone.
At that level, dealer hedging flows carry a structural bias to amplify price movement in either direction, selling into any further weakness or buying into any break higher, turning $76,000 into a volatility trigger.
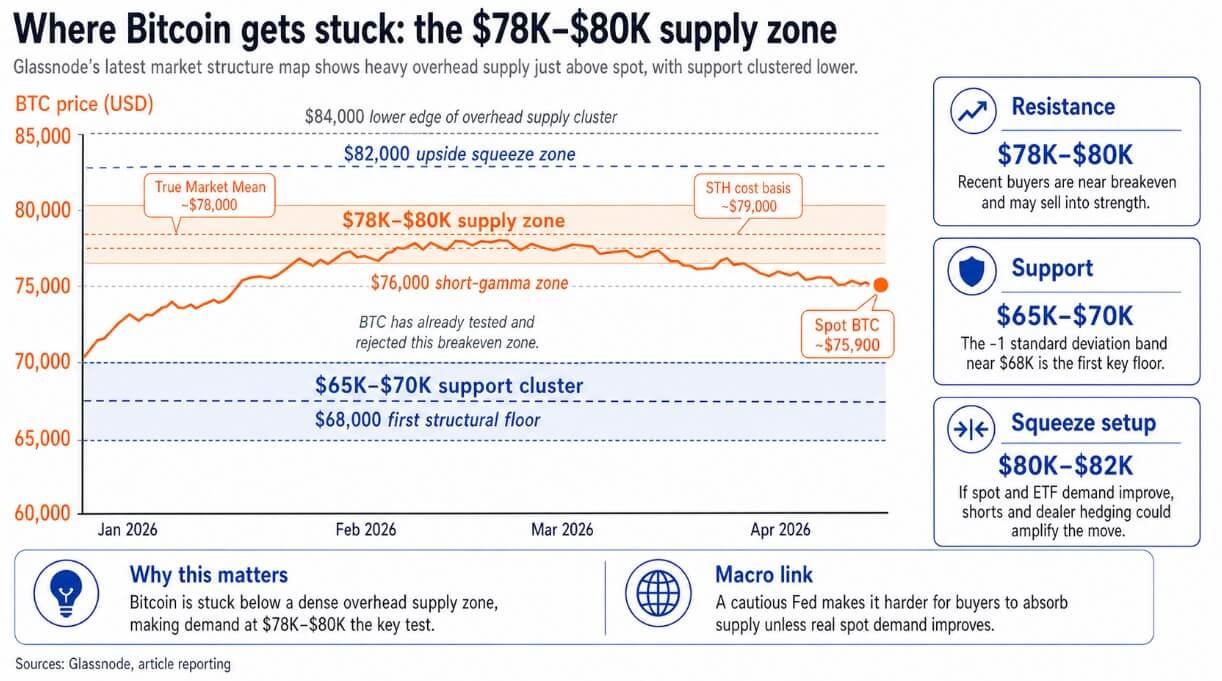
The main support sits between $65,000 and $70,000, with the -1 standard deviation band near $68,000 as the first meaningful structural floor.
A test of $68,000 would put the short-term market structure on trial, with the threshold Glassnode identifies as the level below which distribution accelerates, and the broader base weakens.
Two outcomes
In the bull case, oil follows the EIA’s base path lower through the second half of 2026, headline inflation cools, and the Fed’s one implied cut becomes more credible again.
If that repricing begins and $BTC clears $80,000, Glassnode says the $82,000 short-gamma zone could force dealers to buy into strength, amplifying the move.
Perpetual futures positioning has already flipped to its most negative level on record, building deep fuel for a squeeze. A sustained break above $80,000, with spot and ETF flows confirming the move, would pull the market toward the lower band of Glassnode’s overhead supply cluster near $84,000.
In the bear case, oil stays elevated through the EIA’s second quarter peak and keeps headline inflation sticky enough to push any cut into late 2027.
Bitcoin keeps failing at the True Market Mean and short-term holder cost basis, and the market retreats toward the $65,000-$70,000 support cluster.
The $68,000 band then becomes a waypoint. If ETF flows fail to stabilize and spot demand remains thin, the structure below $68,000 deteriorates, opening a path toward the deeper accumulation zone from which the current rally launched.
| Factor | Bull case | Bear case |
|---|---|---|
| Oil path | Brent follows the EIA base path lower after the Q2 peak | Brent stays elevated through the Q2 peak and remains sticky for longer |
| Inflation path | Headline inflation cools as energy pressure fades | Headline inflation stays sticky because energy keeps pushing prices higher |
| Fed outlook | The Fed’s implied cut becomes more credible again | Cuts get pushed further out as the Fed stays constrained |
| Powell / macro tone | Inflation scare begins to plateau | Inflation uncertainty stays dominant |
| $BTC at $78K–$80K | Bitcoin reclaims and holds the resistance band | Bitcoin keeps rejecting at the True Market Mean and short-term holder cost basis |
| Positioning / gamma effect | A break above $80K pushes into the $82K short-gamma zone and can trigger dealer buying | Price stays pinned near $76K or weakens, with hedging flows amplifying downside volatility |
| ETF / spot demand | Spot and ETF flows improve enough to absorb overhead supply | ETF flows fail to stabilize and spot demand remains too thin |
| Next upside / downside level | Market can extend toward the lower end of the overhead supply cluster near $84K | Market drifts back toward the $65K–$70K support cluster |
| Key structural level | $80K becomes the breakout trigger | $68K becomes the key floor under pressure |
| Takeaway | Oil softens, the Fed problem eases, and Bitcoin gets room to squeeze higher | Oil stays hot, the Fed stays boxed in, and Bitcoin remains vulnerable to another leg lower |
Between those two outcomes, the oil path is the deciding variable.
Powell stated that the committee cannot calibrate away an external energy shock the way it manages a domestic demand cycle, so Bitcoin bulls need oil to cooperate at least as much as they need Powell to soften his tone.
Glassnode’s positioning data adds asymmetry to an otherwise cautious picture, as perpetuals are at a record net-short level, suggesting the market has already priced in considerable pain.
Even a plateau in the inflation narrative, with oil stalling below its second-quarter peak, or a single cooler PCE print, could be enough to trigger a sharp upside move from that positioning.
Glassnode also says spot selling is easing, and ETF AUM has begun to stabilize, two early signs that distribution at current levels is losing momentum.
The breakout and retest scenarios both hinge on real demand arriving in the $78,000-$80,000 zone before macro uncertainty forces another leg lower.