The leading cryptocurrency is up by nearly 2% in the last 24 hours.
Significant outflows from Bitcoin ETFs, including approximately $648 million in net redemptions on May 18, led by BlackRock’s IBIT, affected Bitcoin’s price earlier this week.
However, the outflow has declined over the past few days as buyers have absorbed the pressure.
The momentum indicators are improving, suggesting that the bulls are regaining control of the market.
Spot Bitcoin ETF outflows decline
Bitcoin recorded massive losses earlier this week, dropping below the $77,000 level on Monday.
The bearish performance was prompted by massive outflows from Bitcoin ETFs.
Bitcoin ETFs recorded an outflow of $648 million on Monday, with total ETF sales exceeding $1 billion since the start of the week.
However, the ETF sales have declined over the past 24 hours, with only $70.5 million in outflows recorded on Wednesday, led by BlackRock’s IBIT and Fidelity’s FBTC.
In addition to that, retail demand is improving, thanks to the latest price increase.
According to CoinGlass, Bitcoin’s future Open Interest (OI) now reads $56.92 billion, up nearly 2% in the last 24 hours.
The rising OI indicates increasing retail participation, which could push $BTC’s price higher in the near term.
The OI-Weighted Funding Rate is also positive, now at 0.0032%.
The positive funding rate means that the longs are paying the shorts, adding further confluence to the bullish narrative.
Bitcoin price forecast
The $BTC/USD 4-hour chart remains bearish despite Bitcoin adding 2% in the last 24 hours.
The leading cryptocurrency by market cap is trading around $78,000 on Thursday after finding support around the 50-day EMA at $76,762.
This key technical area is roughly above the previously broken horizontal channel at $75,719, making it a key support zone.
The momentum indicators are improving, pointing to a potential rally in the coming days. The Relative Strength Index at 53 is above the neutral 50, suggesting a fading bearish trend.
The negative Moving Average Convergence Divergence (MACD) is approaching zero, hinting that downside momentum is waning.
If the price recovery continues, initial resistance will be met at the $78,573 swing high, ahead of the 200-day EMA at 81,536.
A daily candle close above these levels would allow $BTC to extend its rally towards the resistance zone near $83,437, surpassing the $82,756 sell trap.
However, if the sellers regain control, they would encounter immediate support at the 50-day EMA at $76,762.
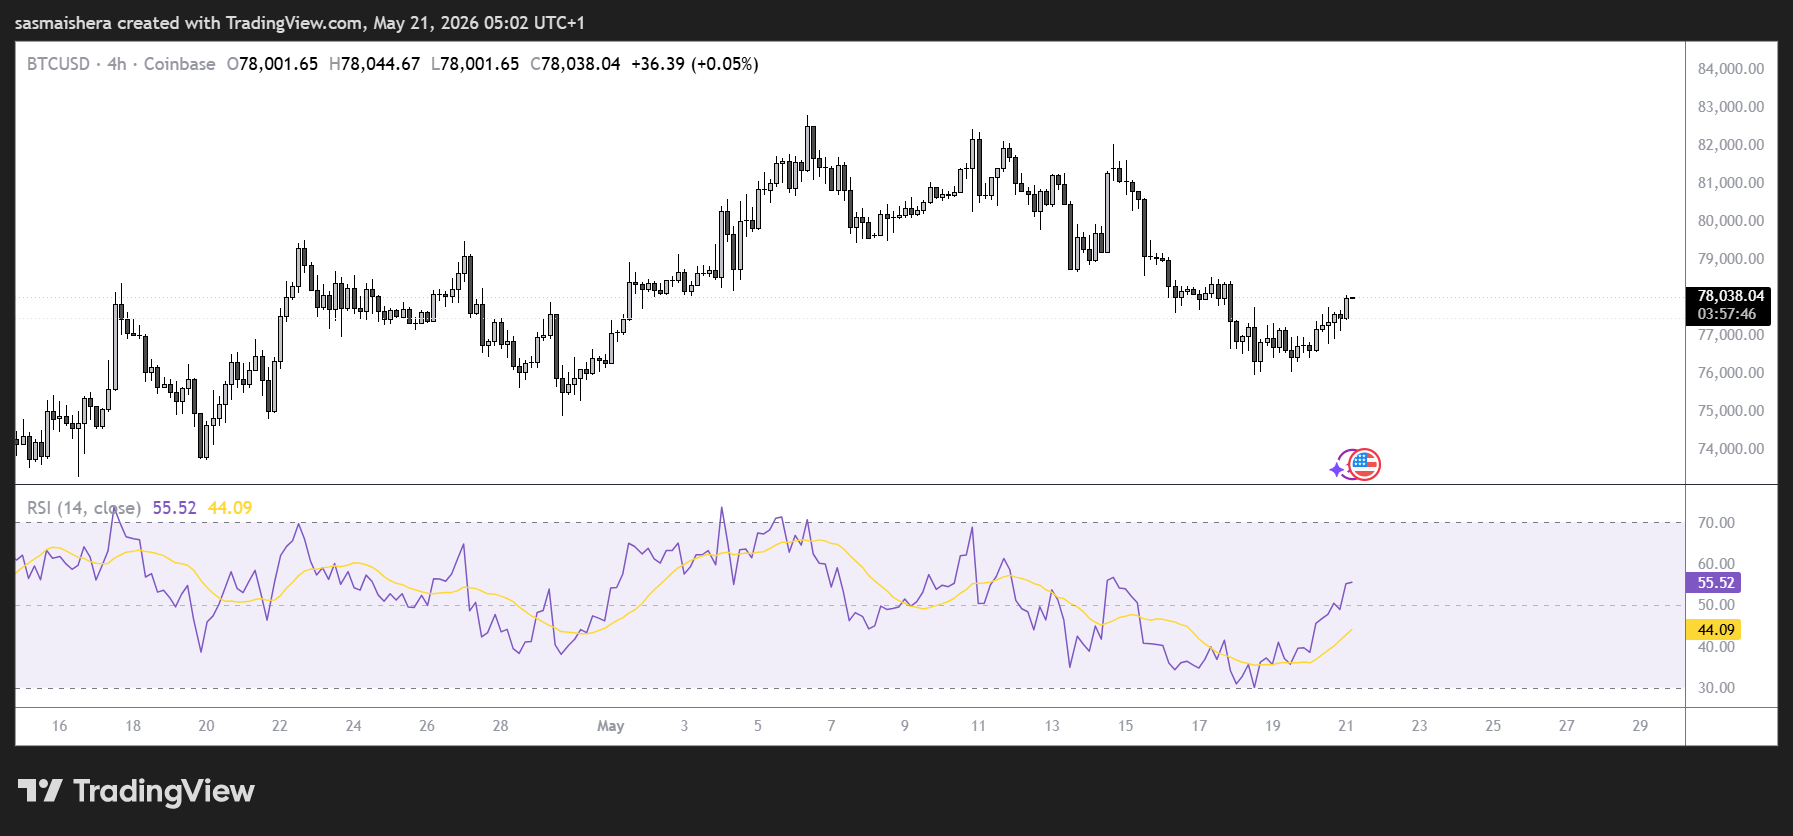
Failure to defend this level would expose lower support zones at $74,487, $70,815, and $68,950, where buyers are likely to step in.
Bitcoin’s recovery attempts would depend on whether the cryptocurrency defends the 50-day EMA support level in the near term.
Leave a Reply
You must be logged in to post a comment.