Bitcoin remains under bearish pressure after failing to sustain momentum above the critical $80K-$82K resistance region. However, recent price action suggests buyers are attempting to defend the important $75K support zone, increasing the probability of a short-term corrective rebound before the broader downtrend resumes.
While the market structure still favors sellers, the current positioning near key support and liquidity clusters could trigger a temporary bullish correction in the coming sessions.
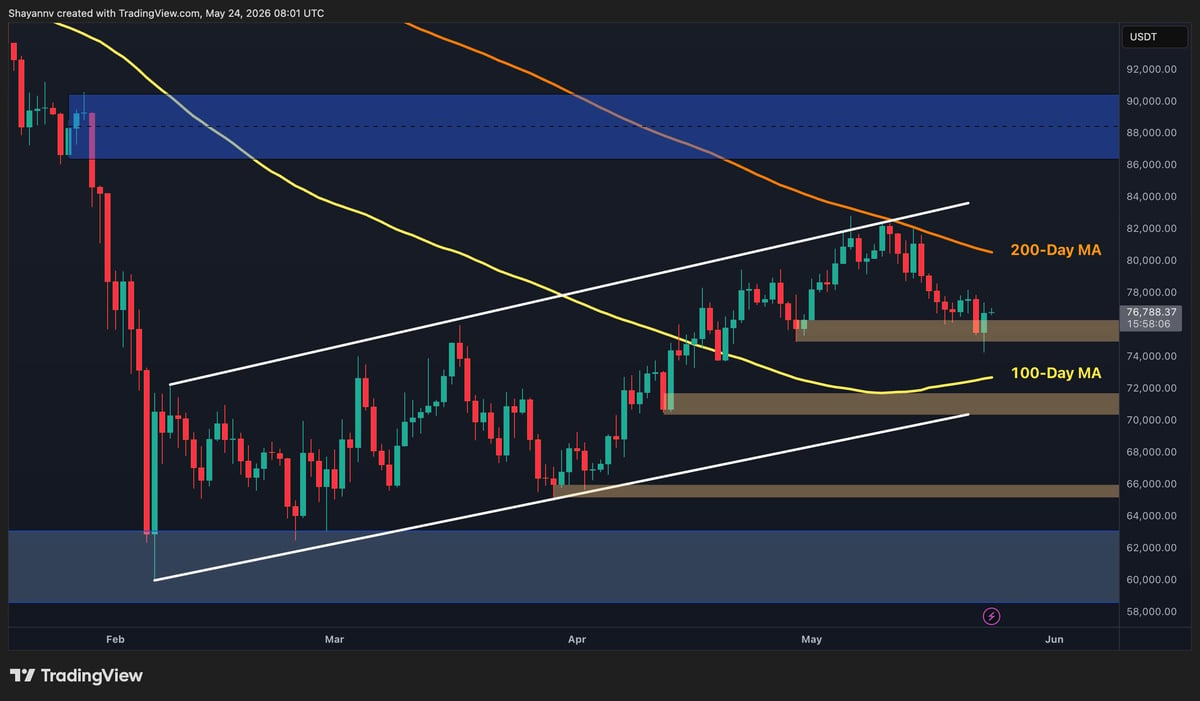
Bitcoin Price Analysis: The Daily Chart
On the daily timeframe, $BTC has entered a corrective phase after being rejected from the major supply zone around $82K-$84K, which also aligned with the upper boundary of the ascending channel. The rejection accelerated selling pressure and pushed the asset toward the important demand area at $75K-$76K.
Recently, the price swept below the $75K support region before quickly recovering, suggesting active buyer interest and potential liquidity collection beneath local lows. This recovery has led to a modest bullish reaction, with $BTC currently attempting to stabilize above the $76K area.
Despite this rebound, the broader structure remains cautious. Bitcoin is still trading beneath previous support turned resistance, and as long as Bitcoin remains below the $80K-$82K region, any upside movement may simply represent a corrective pullback within a larger bearish retracement.
The first upside target for a relief rally sits around $78K-$80K, while stronger resistance remains at $82K-$84K. Failure to reclaim these levels could increase the probability of another bearish leg toward the next major daily demand zone around $70K-$71K. A deeper breakdown may eventually expose the lower support area near $65K-$66K.
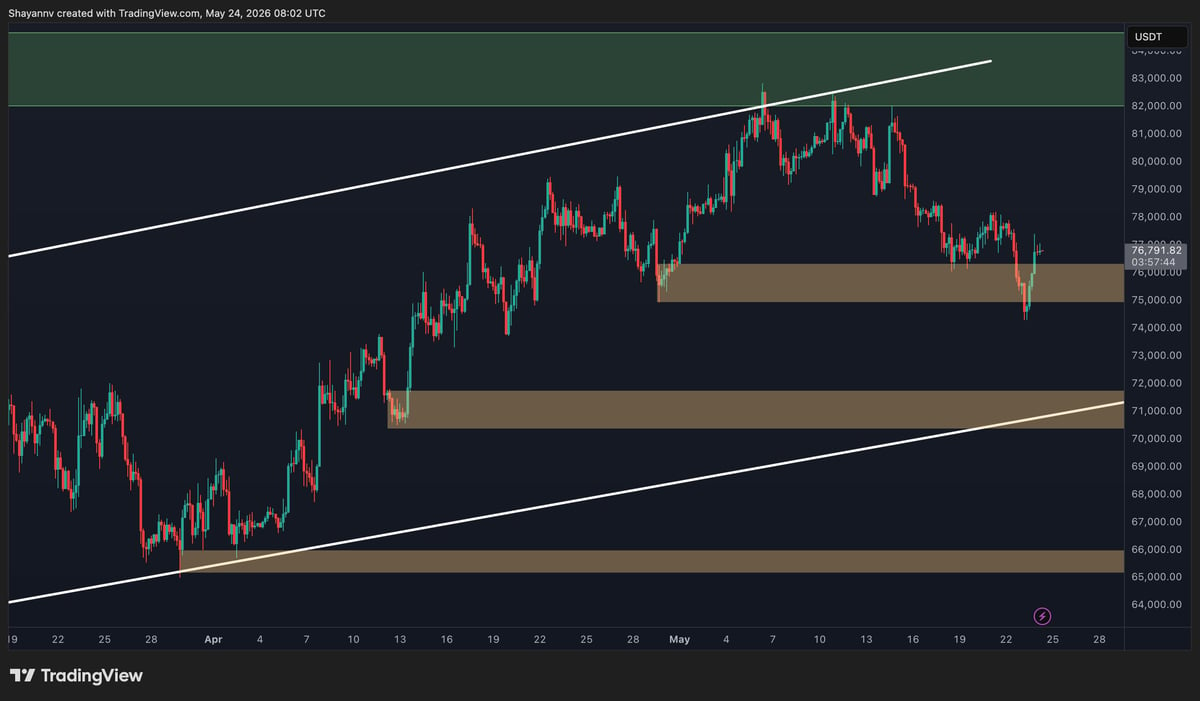
$BTC/USDT 4-Hour Chart
The 4-hour chart highlights a clearer short-term recovery attempt. After reaching the $75K-$76K order block, Bitcoin generated a sharp bounce and is now consolidating around $76K-$77K.
This reaction indicates that buyers are defending the local support area, potentially setting the stage for a corrective move higher. If momentum persists, the first pullback target lies near the $78K-$79K range, followed by the more significant resistance zone around $80K-$82K.
However, the broader lower-high formation remains intact, and recent price action still reflects weakening bullish momentum compared to earlier recovery phases. As a result, the current rebound could evolve into a classic bearish continuation setup, where price revisits resistance before initiating another decline.
For bulls to regain control, Bitcoin would need to reclaim the $80K-$82K region convincingly. Otherwise, the current move is more likely to be interpreted as temporary relief rather than a trend reversal.
Sentiment Analysis
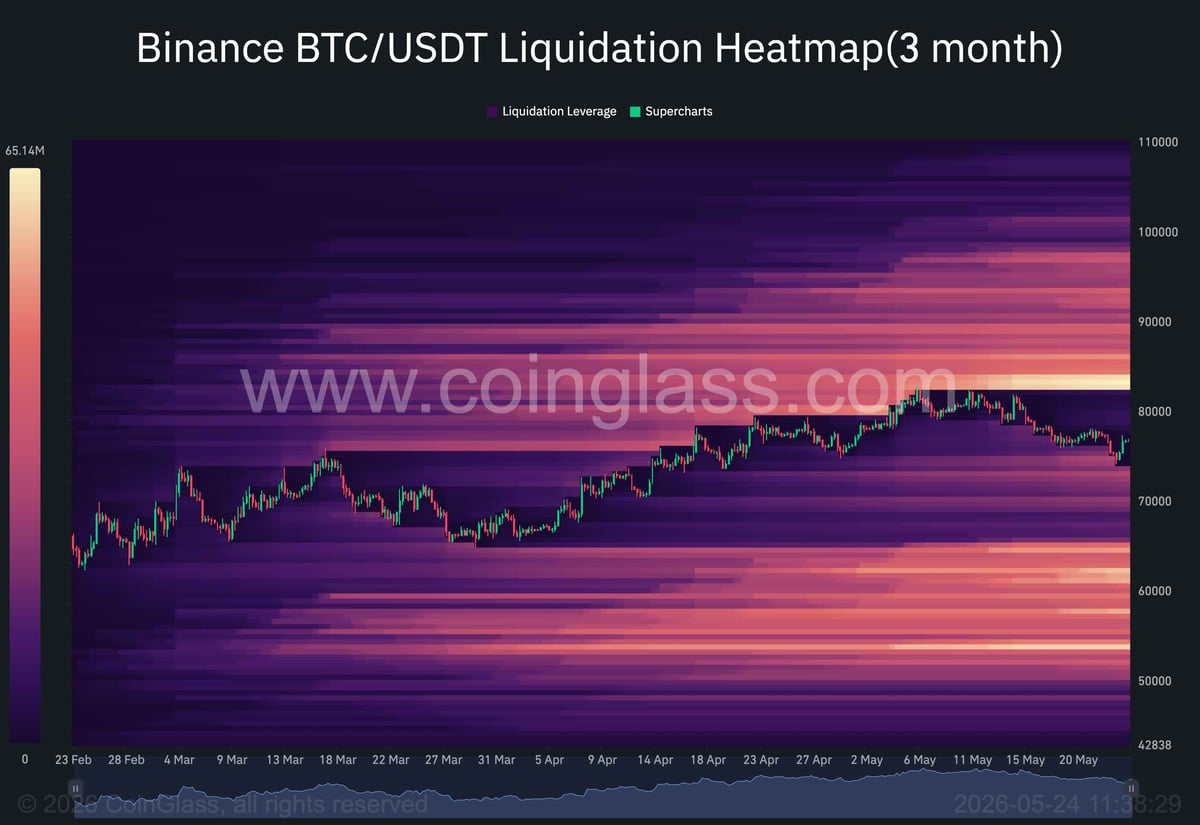
The liquidation heatmap provides additional context supporting the corrective-bounce scenario. A notable concentration of short liquidations has accumulated above the current price, particularly within the $80K-$85K region.
Markets often gravitate toward nearby liquidity pools before resuming the prevailing trend. Therefore, Bitcoin may first move higher to absorb these leveraged short positions, potentially fueling a squeeze toward the $80K-$82K resistance area.
At the same time, substantial liquidity clusters remain below price around the $60K-$63K region, indicating that downside targets continue to exist if bearish momentum returns after the correction.
This creates a two-step scenario: an initial bullish retracement driven by liquidation hunting toward $80K-$82K, followed by renewed selling pressure and another bearish leg toward lower support levels. The interaction between price and these liquidity zones will likely determine Bitcoin’s next major move.