As Bitcoin ($BTC) continues to find a pathway to $80,000, economist and market analyst Henrik Zeberg has warned that the asset could face a severe collapse after what he believes will be a temporary bullish rebound.
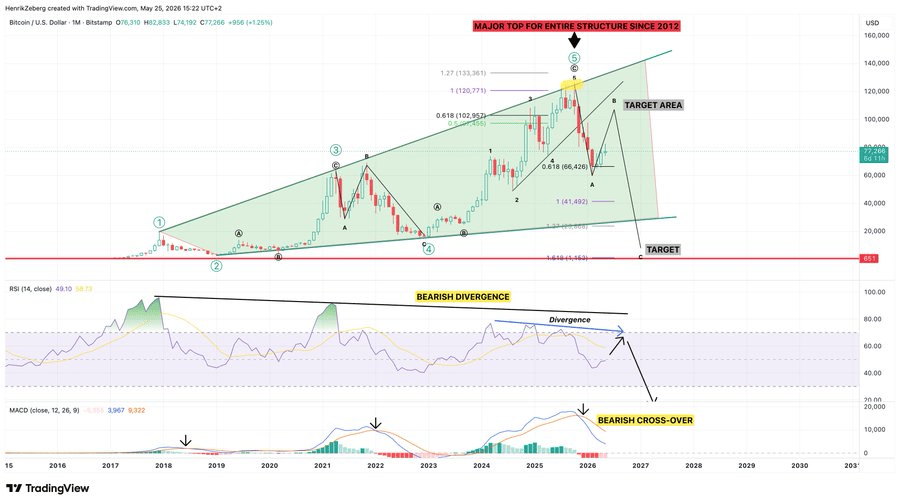
He argued that the current recovery phase represents a “B-wave” bounce within a broader bearish cycle.
According to his analysis shared in an X post on May 25, investor sentiment is likely to turn extremely bullish during the rebound before the market eventually experiences a sharp reversal.
The outlook was based on an Elliott Wave structure dating back to Bitcoin’s early market cycles.
$BTC Bounce = B-wave.
Sentiment will be extremely Bullish!
The Crash will be horrendous.
Enjoy the Bounce! But get out in due time. pic.twitter.com/ijMItwyNfu
— Henrik Zeberg (@HenrikZeberg) May 25, 2026
Zeberg pointed to what he described as a “major top” forming in the broader structure since 2012, suggesting Bitcoin may have completed a long-term fifth wave near its recent highs above $110,000.
Notably, the analysis projects a short-term rebound after Bitcoin retraced to the 0.618 Fibonacci level around $66,426, with upside targets above current prices.
However, the broader setup signals a deeper correction afterward, with downside targets near the $41,492 support region and potentially lower over time.
At the same time, the relative strength index (RSI) is showing bearish divergence, where prices continued rising as momentum weakened, a pattern that has historically preceded major reversals.
The monthly MACD indicator is also nearing a bearish crossover, similar to signals seen before Bitcoin bear markets in 2018 and 2022.
Despite the warning, Zeberg said Bitcoin could still see a strong near-term rally, potentially reigniting bullish sentiment across the crypto market before a broader downturn unfolds.
Bitcoin price possible crash target
Additional technical indicators shared by analyst TradingShot reinforced the bearish outlook. In a TradingView post on May 24, the analyst noted that Bitcoin’s monthly RSI showed bearish divergence, with prices rising as momentum weakened, a pattern historically linked to major reversals.
Additionally, the MACD appeared close to a bearish crossover similar to signals seen before the 2018 and 2022 bear markets.
A separate cycle-based chart combining Bitcoin’s four-year market structure, halving events, and Fibonacci time levels suggested the asset is now in the bearish phase of the current cycle.
The analysis projected a possible decline toward $50,000, aligning with the weekly 350 moving average that marked previous bear market bottoms.
By press time, Bitcoin was trading at $77,513, up about 1.5% over the past 24 hours.