The institutional bid under bitcoin is running on fumes.
U.S. spot bitcoin ETFs have absorbed a net 4,500 BTC since the start of the year, an unusually thin number given the products were the structural buyer that powered the 2025 rally, per Swissblock data shared on X Tuesday.
March and April produced steady accumulation that helped lift bitcoin off lows near $65,000, while May has flipped the other way with just three days to go before the month ends.
“After strong accumulation in March and April, May has flipped back into distribution,” Swissblock said in its post. “The Risk Index is now moving into high-risk territory while ETF flows are deteriorating simultaneously. That tells us spot ETF demand is no longer absorbing selling pressure effectively.”
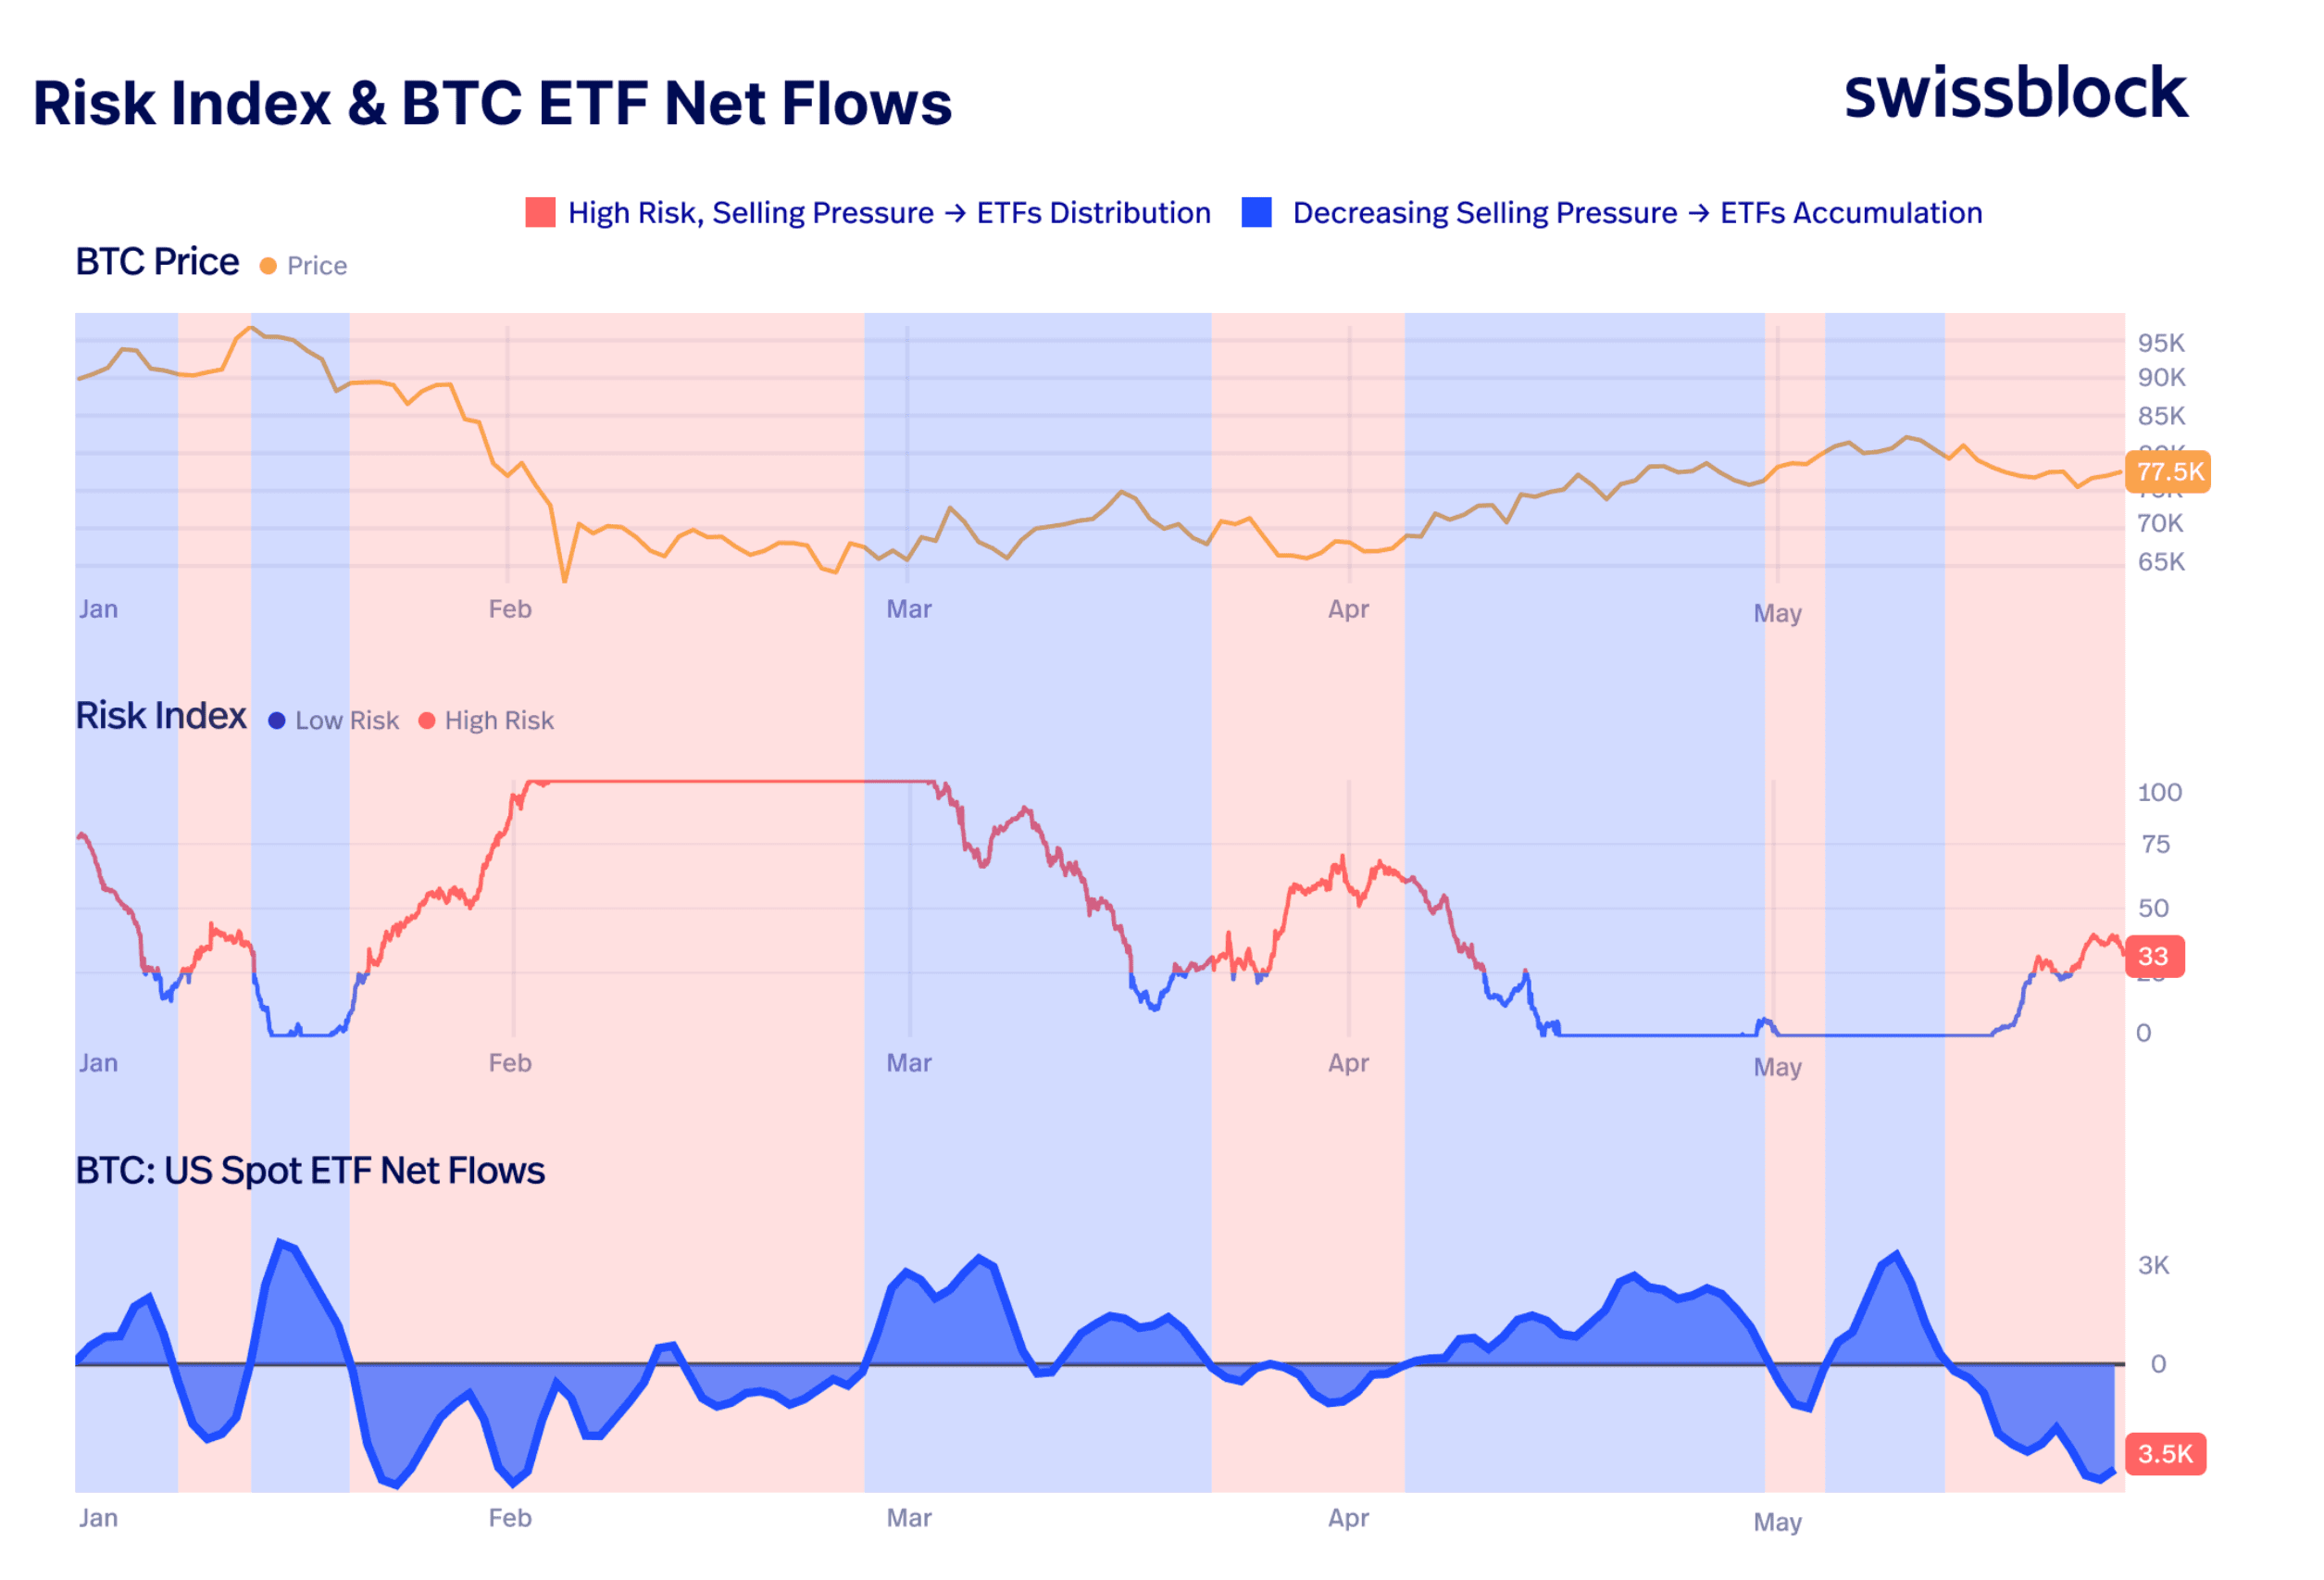
The reversal matters because the previous several rallies in bitcoin needed ETF buying to clear the supply coming from miners, long-term holders, and short-term traders taking profit.
When that bid thins, the supply has to find a different buyer or the price drops to a level where buyers show up. Swissblock’s argument is that the Risk Index, which measures structural selling pressure against absorption, can keep climbing as long as the ETF channel stays in distribution.
Bitcoin traded at $75,808 in Asian hours Tuesday, down 2.6% over the past month and sitting near the bottom of its May range. The cryptocurrency had briefly traded above $82,000 earlier in May before the producer price index print and the subsequent run of macro stress pulled it back below $80,000. ETH, XRP, and Solana were all in the red, with Zcash leading the slide at 9% down on the day.
The Swissblock reading is the latest in a run of on-chain data pointing the same way.
Apparent demand, which measures how much bitcoin the market is absorbing relative to new supply, has slid back to its weakest level since December, as CoinDesk reported Tuesday.
CryptoOnchain noted $1.74 billion in U.S. spot ETF withdrawals over the past two weeks alongside retail traders adding leverage in anticipation of a reversal, a combination that has historically preceded sharp liquidation cascades when the market moves against the crowd.
What the data does not yet tell traders is whether this is a pause or a turn.
ETF buying has dropped off before during this cycle without leading to deeper drawdowns. Meanwhile, equity markets globally are at record highs, and FXPro’s Alex Kuptsikevich said bitcoin’s 50-day and 200-day moving averages are on track to cross in the coming weeks, a setup known as a golden cross that is generally read as bullish.
But ETF demand is the channel that brought the new money in. If that channel stays in distribution, the structural case for the rally that began in April starts looking thinner.