
Bitcoin continued its strong rally on Aug. 7, 2025, pushing to a high of $116,848 amid strong trading volumes and improving sentiment. With a market capitalization of $2.32 trillion and 24-hour trading volume at $35.09 billion, bullish momentum appears to be building across multiple timeframes.
Bitcoin
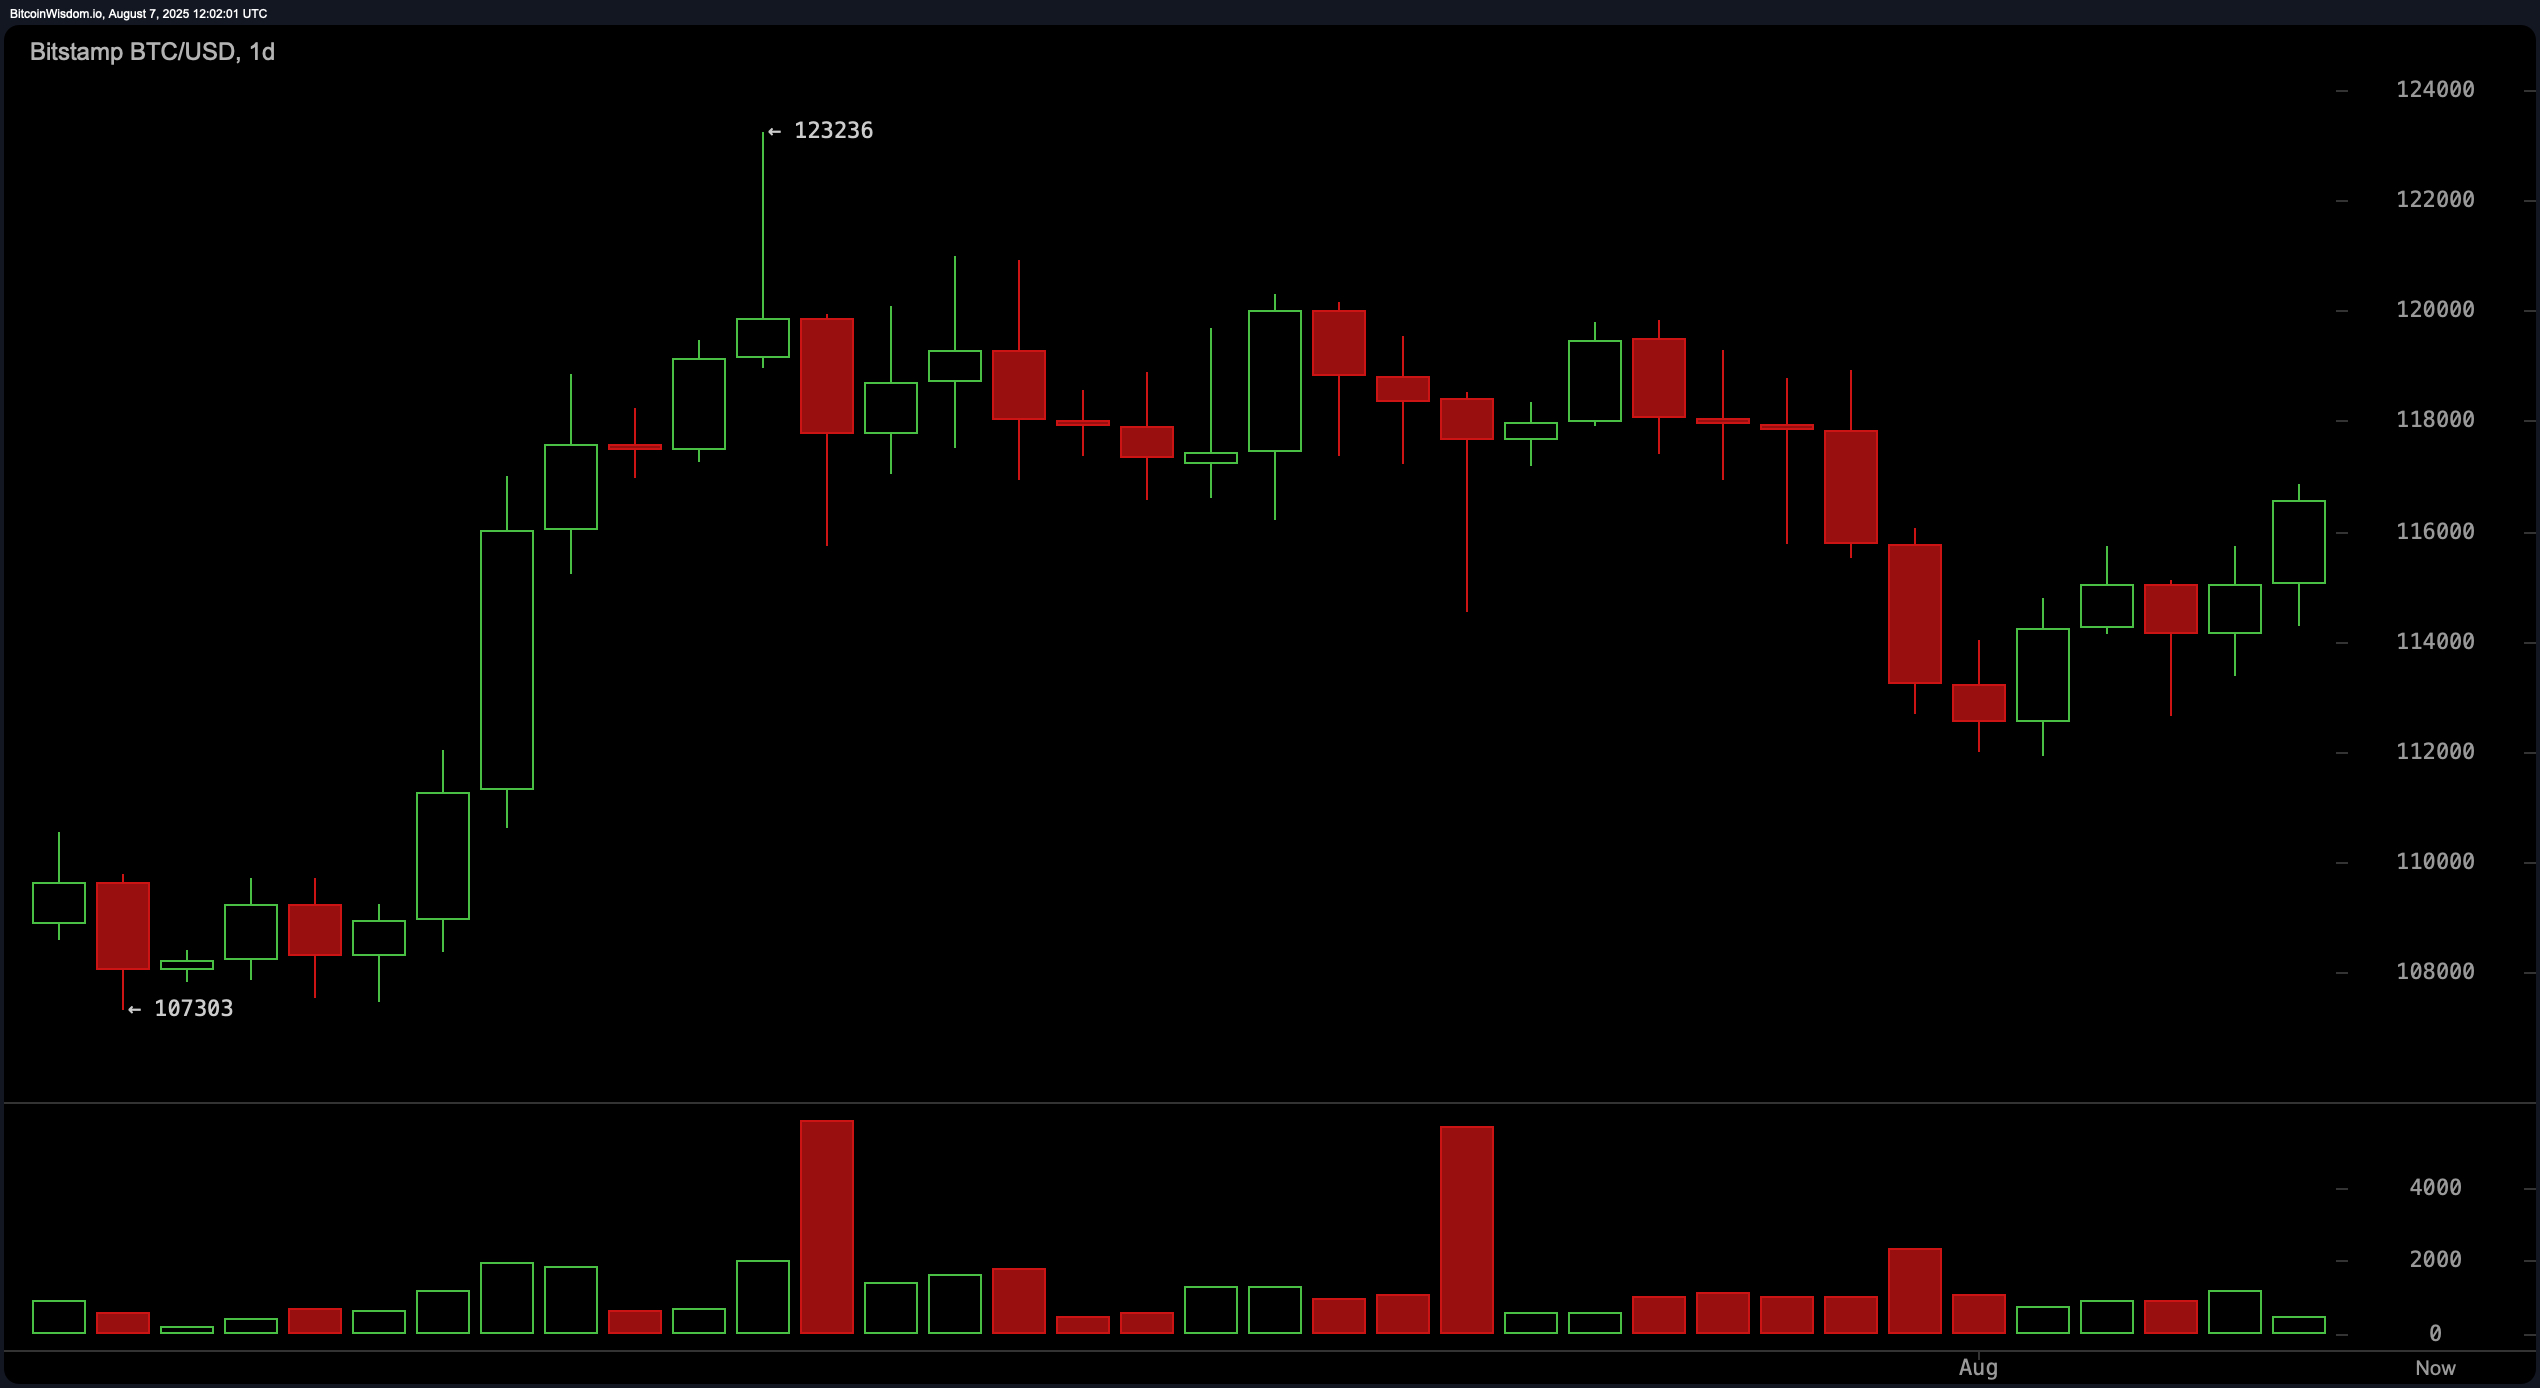
On the daily chart, bitcoin has begun to show signs of recovering from a previous downtrend, as higher lows establish a constructive technical base. Notably, increasing volume on green candlesticks suggests buyers are regaining control, particularly near the $112,000 support zone. A recent series of strong daily candles indicates that the trend may be shifting upward, supported by positive sentiment. However, until bitcoin closes above $117,000 with conviction, the trend remains cautiously optimistic.
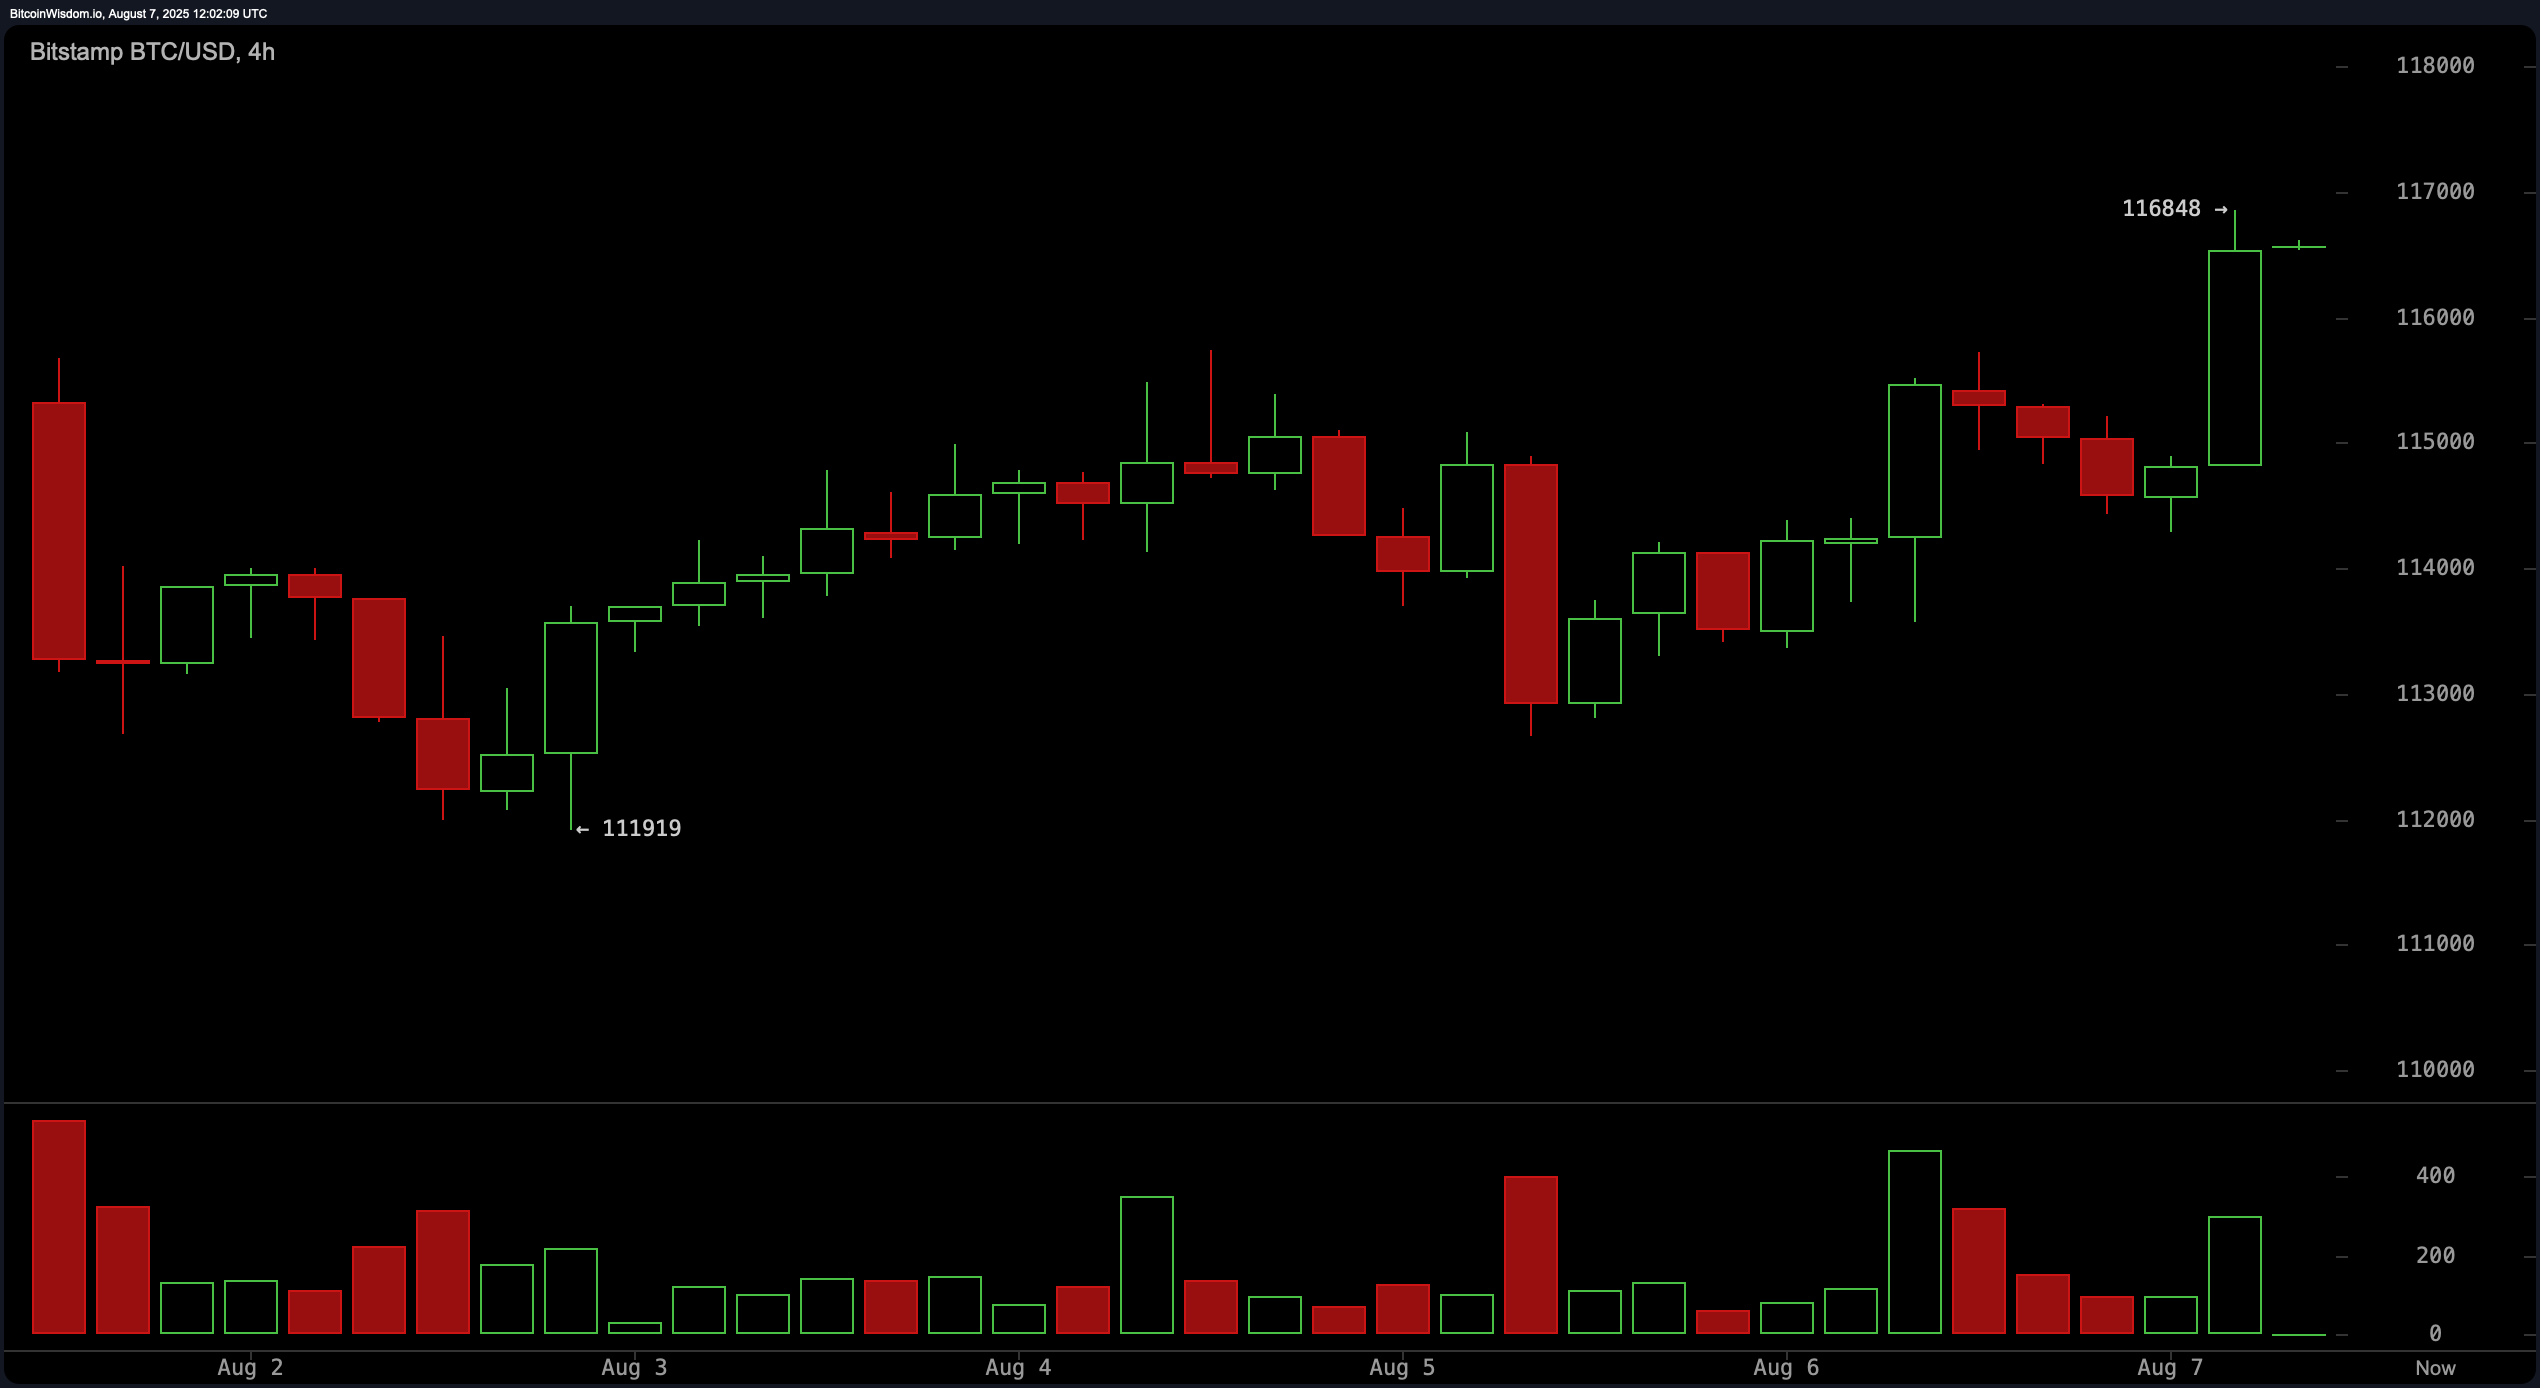
The 4-hour bitcoin chart reveals an established short-term uptrend, marked by a clear move from approximately $112,000 to the current trading range. Volume has surged on bullish moves, confirming the strength of the breakout. Resistance at $116,800 has been tested multiple times, and a sustained move above this level would likely target the $118,500 to $120,000 zone. A failure to breach that resistance could, however, invite short-term selling pressure, especially if volume declines.
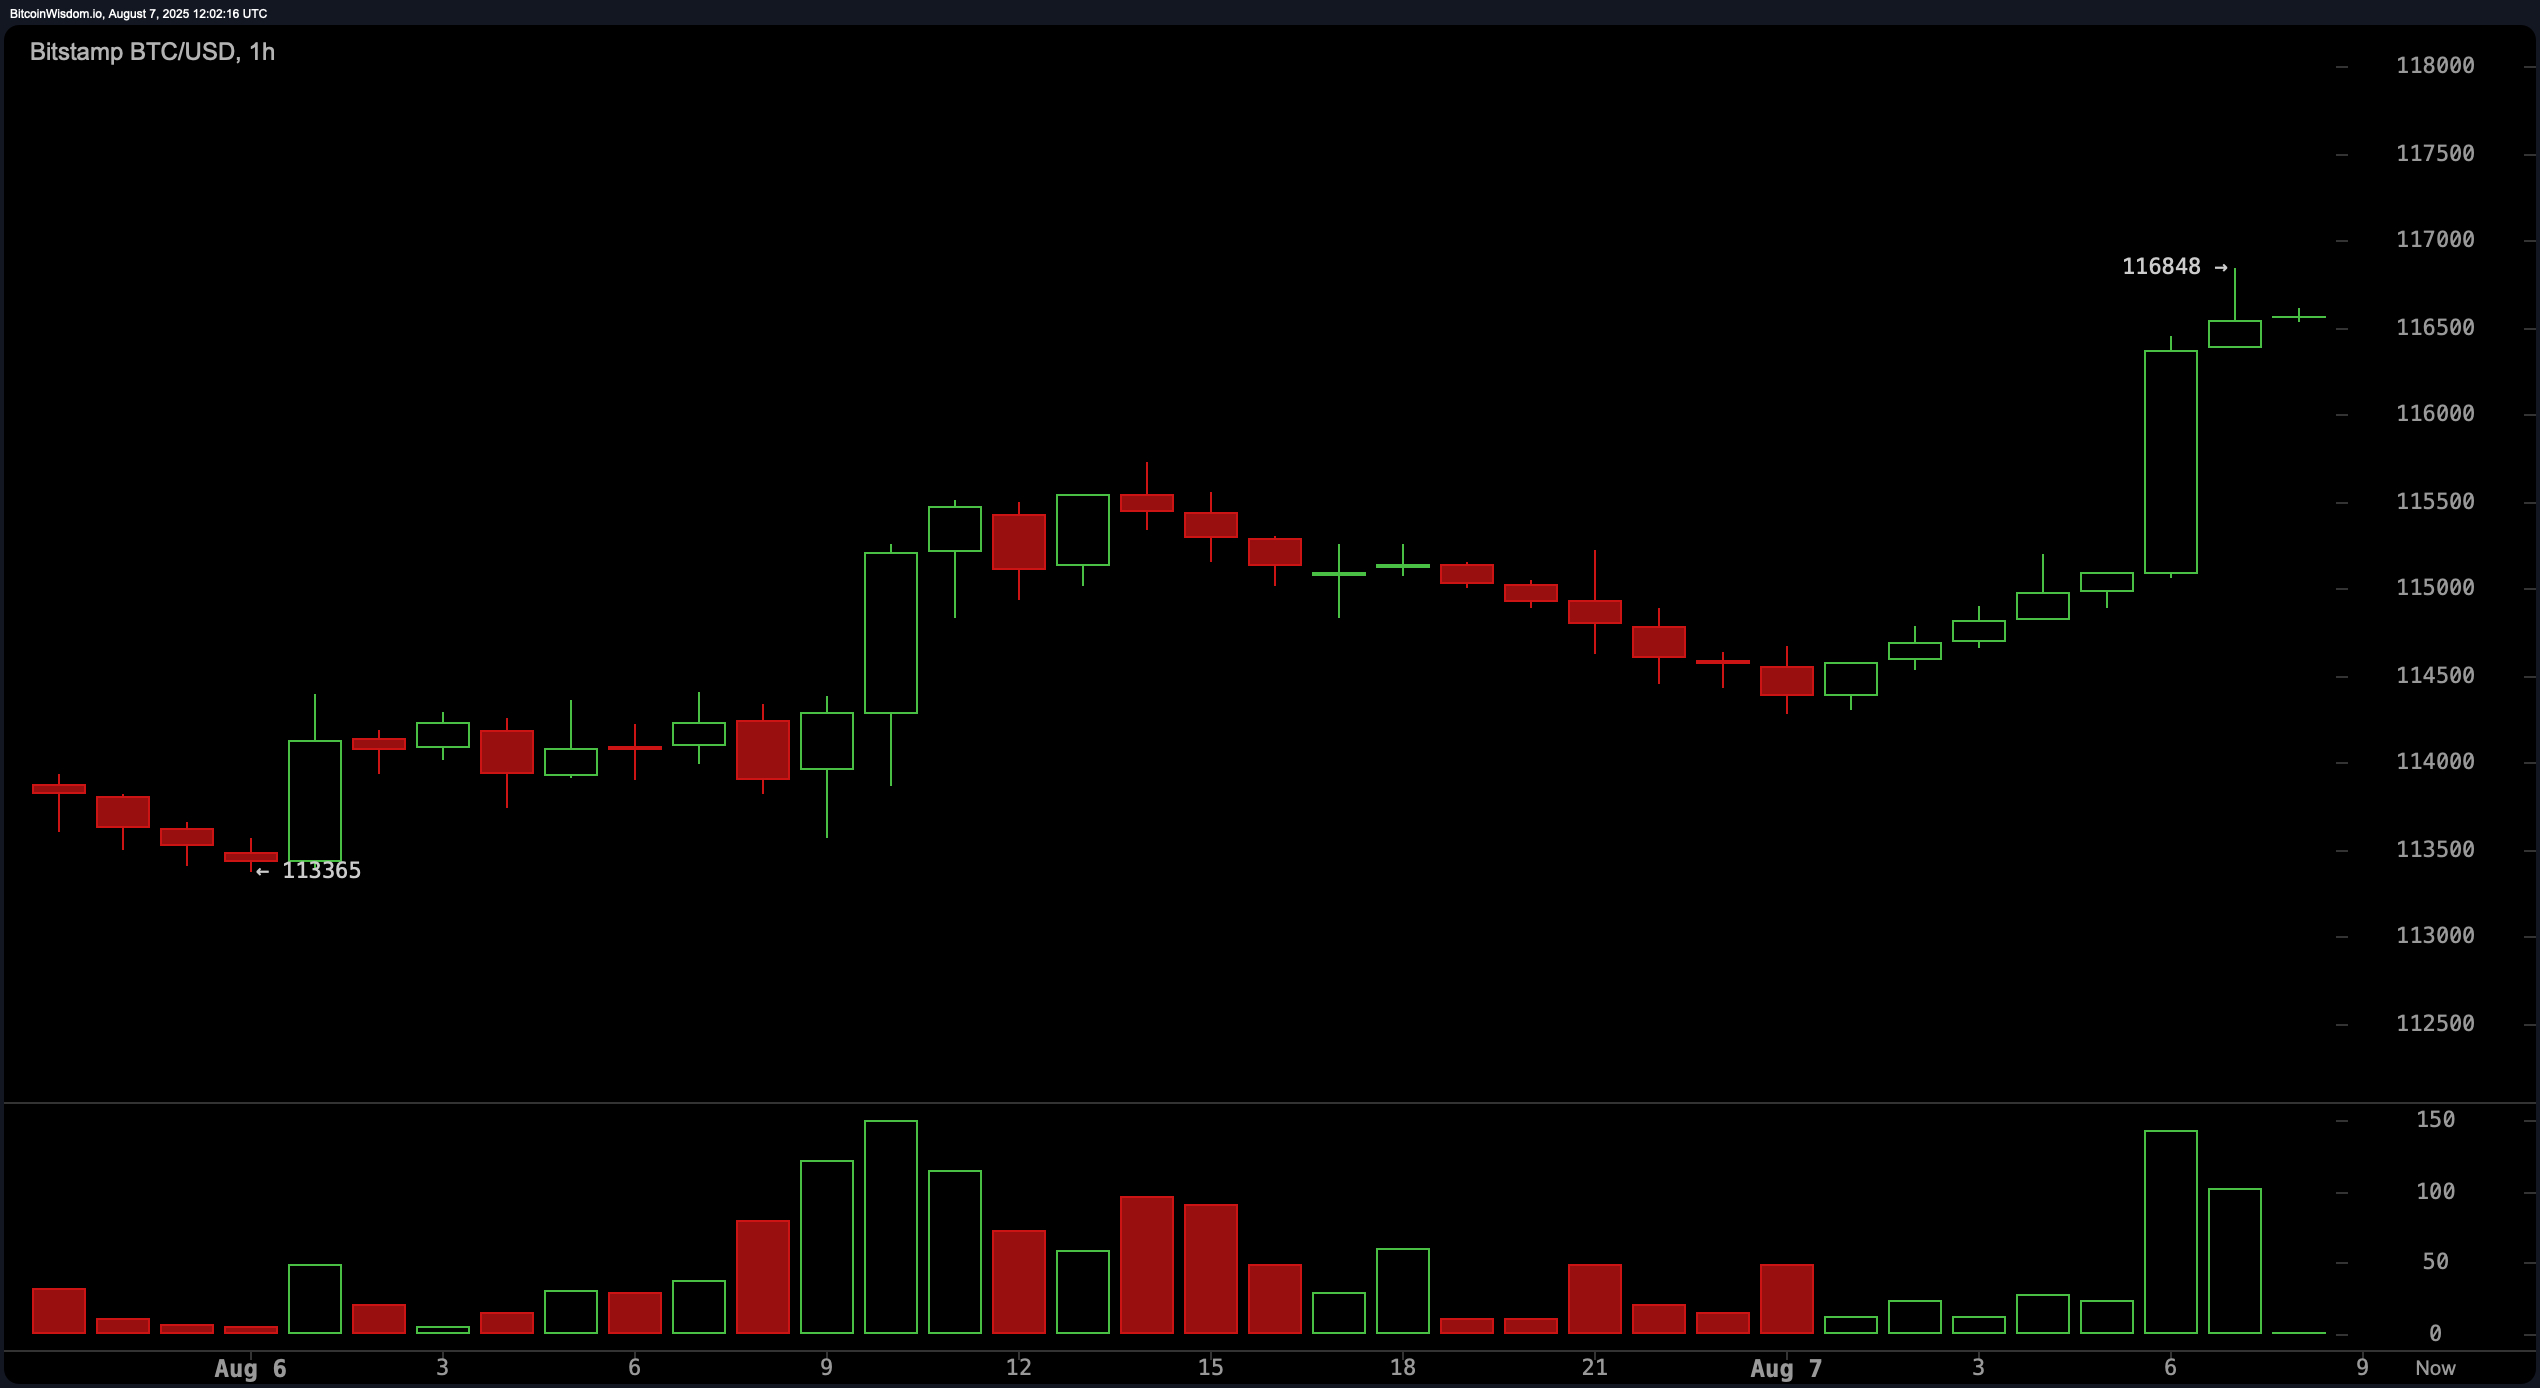
On the 1-hour chart, bitcoin recently printed a bullish engulfing candle, coupled with a significant spike in buying volume—an indication of strong near-term demand. This breakout from consolidation suggests bullish control in the immediate term, though traders should monitor for potential false breakouts, particularly near the $117,000 level. If price sustains above this zone, it would reinforce confidence in the bullish setup forming on the higher timeframes.
Oscillator indicators remain largely neutral, suggesting the market is in a wait-and-see mode. The relative strength index (RSI) at 54, stochastic at 42, commodity channel index (CCI) at −31, and average directional index (ADX) at 18 all point to a balanced market without extreme momentum. The Awesome oscillator reads −1,419, also neutral, while momentum at −1,475 surprisingly signals a bullish trend. In contrast, the moving average convergence divergence (MACD) level at 200 indicates a bearish trend, highlighting the mixed nature of momentum indicators currently.
Moving averages (MAs) are showing increasing divergence, favoring the bullish side overall. The 10-period exponential moving average (EMA) and simple moving average (SMA) are both flashing bullish signals, joined by the 20-period EMA and 30-period EMA. However, the 20- and 30-period SMAs are in a bearish territory, indicating some near-term resistance. Longer-term moving averages, including the 50-, 100-, and 200-period EMAs and SMAs, all remain firmly bullish, showcasing a broader upward trend that supports continued appreciation if current resistance levels are cleared.
Bull Verdict:
If bitcoin sustains a close above $117,000 on strong volume, it will likely confirm a bullish continuation, with price targets extending toward $118,500 and potentially $120,000. Higher lows, improving volume profiles, and favorable long-term moving averages support the case for upward momentum.
Bear Verdict:
Should bitcoin face rejection at the $117,000 resistance and close below $114,500, a retracement to $112,000 or even $110,000 is likely. Volume inconsistencies and the possibility of a lower high formation on the daily chart suggest the rally could be a bull trap in disguise.