Bitcoin has defended the $64,000-$65,000 support zone after a sharp selloff wiped out over $1.8 billion in positions. The next test is whether buyers can turn this bounce into a stronger recovery.
Bitcoin Tests Major Support Zone as Analysts Watch for Relief Rally
Bitcoin has dropped into a key high-timeframe support area near $65,000-$67,000, a zone that previously helped establish a market bottom in February, according to analyst Cryptic Trades.
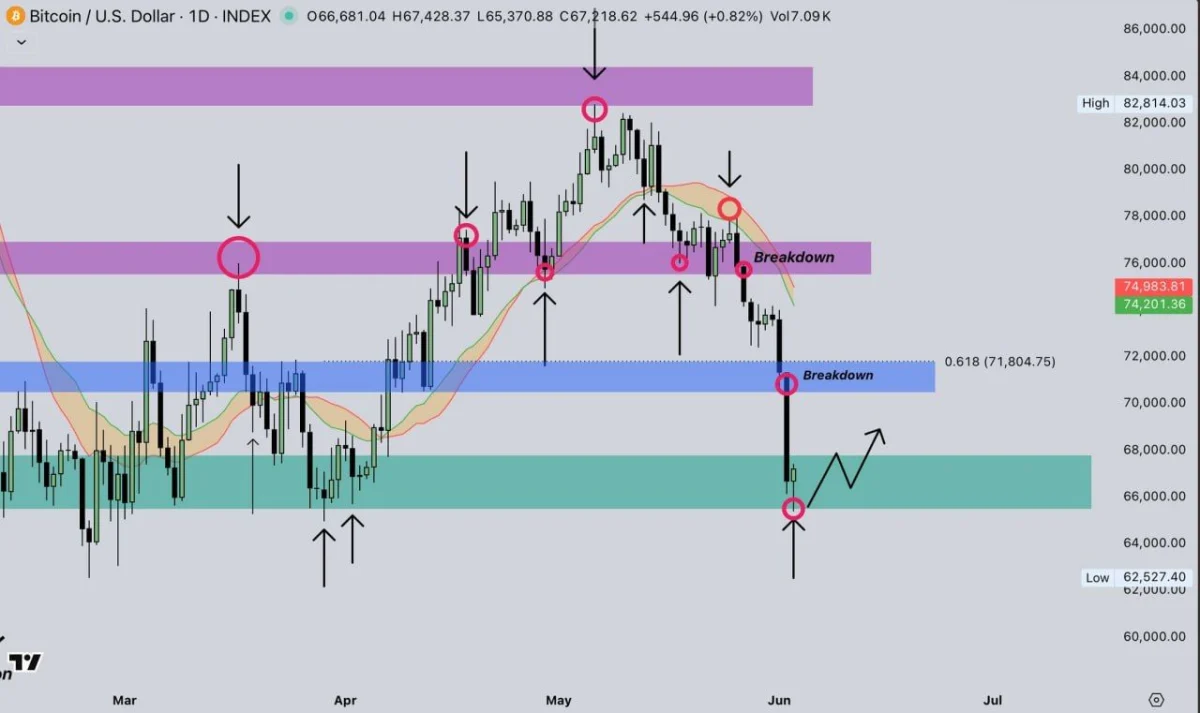
Bitcoin High-Timeframe Support Analysis. Source: Cryptic Trades on X / TradingView
The chart shows $BTC breaking below several important support levels, including the $75,000-$76,000 range and the 0.618 Fibonacci retracement level at $71,804. After losing those levels, Bitcoin declined sharply before reaching the current support zone.
According to the analysis, the $65,000-$67,000 area represents one of the most important regions on the chart. Previous reactions from this zone led to strong rebounds, making it a key level for traders watching for signs of stabilization.
The chart also highlights a possible relief rally scenario from current levels. Cryptic Trades noted that funding rates have moved deeply negative, suggesting many traders are positioned on the short side after the recent decline. Such conditions can sometimes create short squeezes that push prices higher in the short term.
However, the analyst cautioned that a relief rally and a full trend reversal are different outcomes. For Bitcoin to improve its broader structure, it would need to reclaim the 0.618 Fibonacci level near $71,800, which now acts as a major resistance zone.
Until $BTC recovers that level, any rebound may be viewed as a counter-trend move within the current downtrend. A successful move back above $71,800 would strengthen the case for a larger recovery, while continued rejection below it could keep downside risks in focus.
Bitcoin Defends $64K-$65K Zone After Heavy Liquidations
Bitcoin briefly tested the $64,000-$65,000 support area before buyers stepped in, according to Lucas. The move followed a sharp selloff that liquidated more than 277,000 traders and wiped out over $1.8 billion in positions.
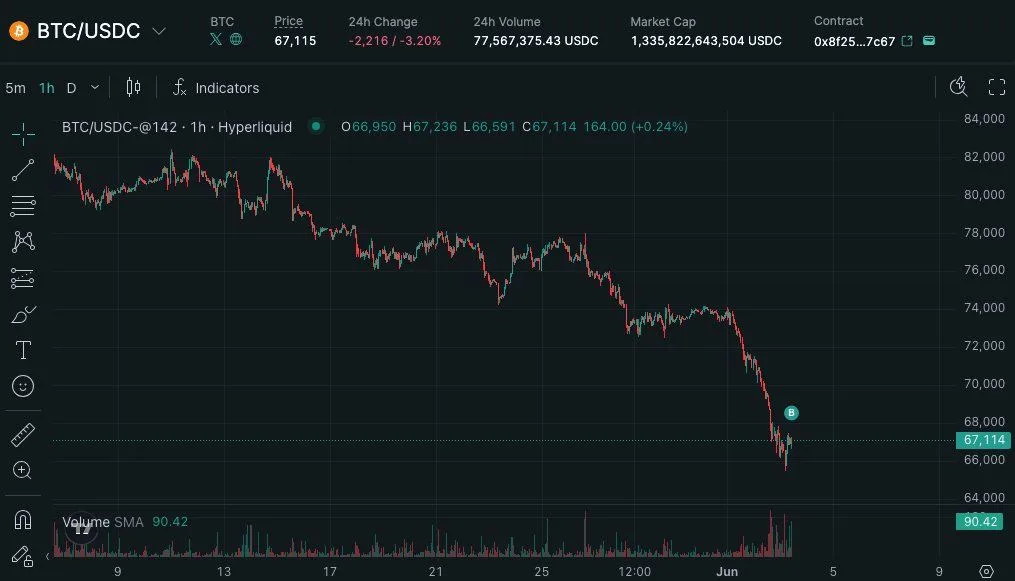
Bitcoin $65K Support Retest. Source: Lucas on X / Hyperliquid
The chart shows a steep decline into the lower support range, followed by a quick rebound. That reaction suggests buyers defended the zone despite heavy market pressure.
Lucas noted that longs took most of the damage during the selloff. This kind of move can reset leverage because weak positions get cleared from the market.
However, the next test is demand. A short-covering bounce can push price higher for a short time, but sustained upside needs stronger spot buying.
If buyers continue to step in, the move could become a healthy leverage reset. If demand fades, Bitcoin may need more time before a stronger recovery attempt.
Leave a Reply
You must be logged in to post a comment.