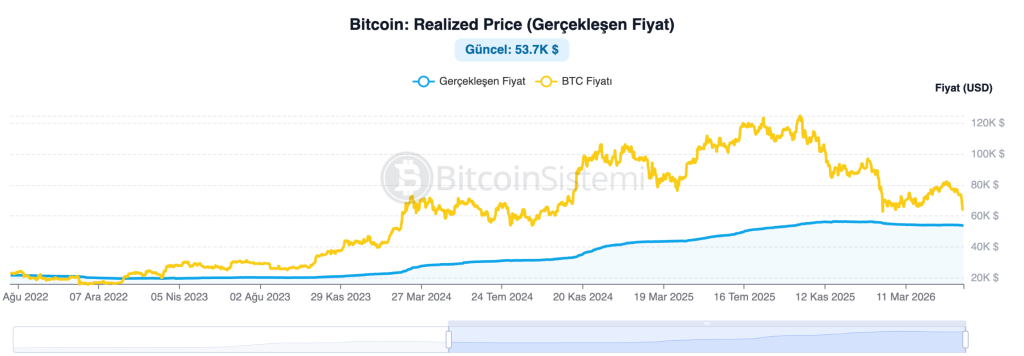
While the spot price of Bitcoin ($BTC) is engaged in a sideways battle around $60,900, on-chain data is providing investors with a crucial roadmap. According to Bitcoinsistemi.com’s on-chain data, the Realized Price, which represents the average cost basis for all investors in the market, is currently at $53,700.
What is the Actual Price, and Why is it So Important?
The spot price we see at that moment ($60,900) is the value of Bitcoin on exchanges at that specific second. However, the Realized Price ($53,700) is the average of the prices at which each Bitcoin last changed hands between wallets on the network. In simpler terms, it’s the average cost of purchase for all investors in the market.
Şu an piyasa genel olarak kârda (60.900$ > 53.700$) olsa da, aradaki farkın kapanması piyasa psikolojisinde muazzam bir kırılıma işaret ediyor.
Eyes on the $53,700 Threshold: Why the Current Price Drop is a “Historic Buying Opportunity”?
Looking at the history of cryptocurrencies, the spot price approaching or falling below this average cost line has always coincided with “cyclical bottom” periods. Analysts summarize the current situation in two scenarios:
Major Psychological Support: Even if the Bitcoin price corrects, as it approaches the $53,700 level, investors are hesitant to sell because they believe it has reached the “break-even” point. This makes this level a very difficult support to overcome.
Capitulation Period: If Bitcoin retreats to or briefly falls below the $53,700 level due to global macroeconomic pressures, this transforms into a “historic discount” and “absolute buying opportunity,” where weak hands are eliminated and whales and long-term investors (HODLers) place massive buy orders. In all past cycles, those who accumulated $BTC at the prevailing price were the ones who reaped the biggest profits at the peak of the bull season.
What Should Investors Do?
While Bitcoin continues to search for direction around the $60,900 mark, the main factor determining risk appetite will be the on-chain cost line of $53,700. As long as it remains above this line, the bull trend can be considered to be consolidating healthily. Potential pullbacks, rather than creating fear, may signal “accumulation areas” for smart investors.
*This is not investment advice.
Leave a Reply
You must be logged in to post a comment.