Bitcoin’s supply in loss has crossed 10.46 million $BTC, a level that has appeared near past market bottoms. At the same time, new buy walls around $59,400-$61,100 suggest buyers are defending support as traders watch a possible move toward $68,500.
Bitcoin Supply in Loss Hits 10.46M $BTC as Bottom Signal Returns
Bitcoin’s supply in loss has reached 10.46 million $BTC, crossing a level that analyst Ali Charts says has historically appeared near major market bottoms. The chart, sourced from Glassnode, shows that Bitcoin often entered bottom-forming phases when more than 10 million $BTC were held at a loss.
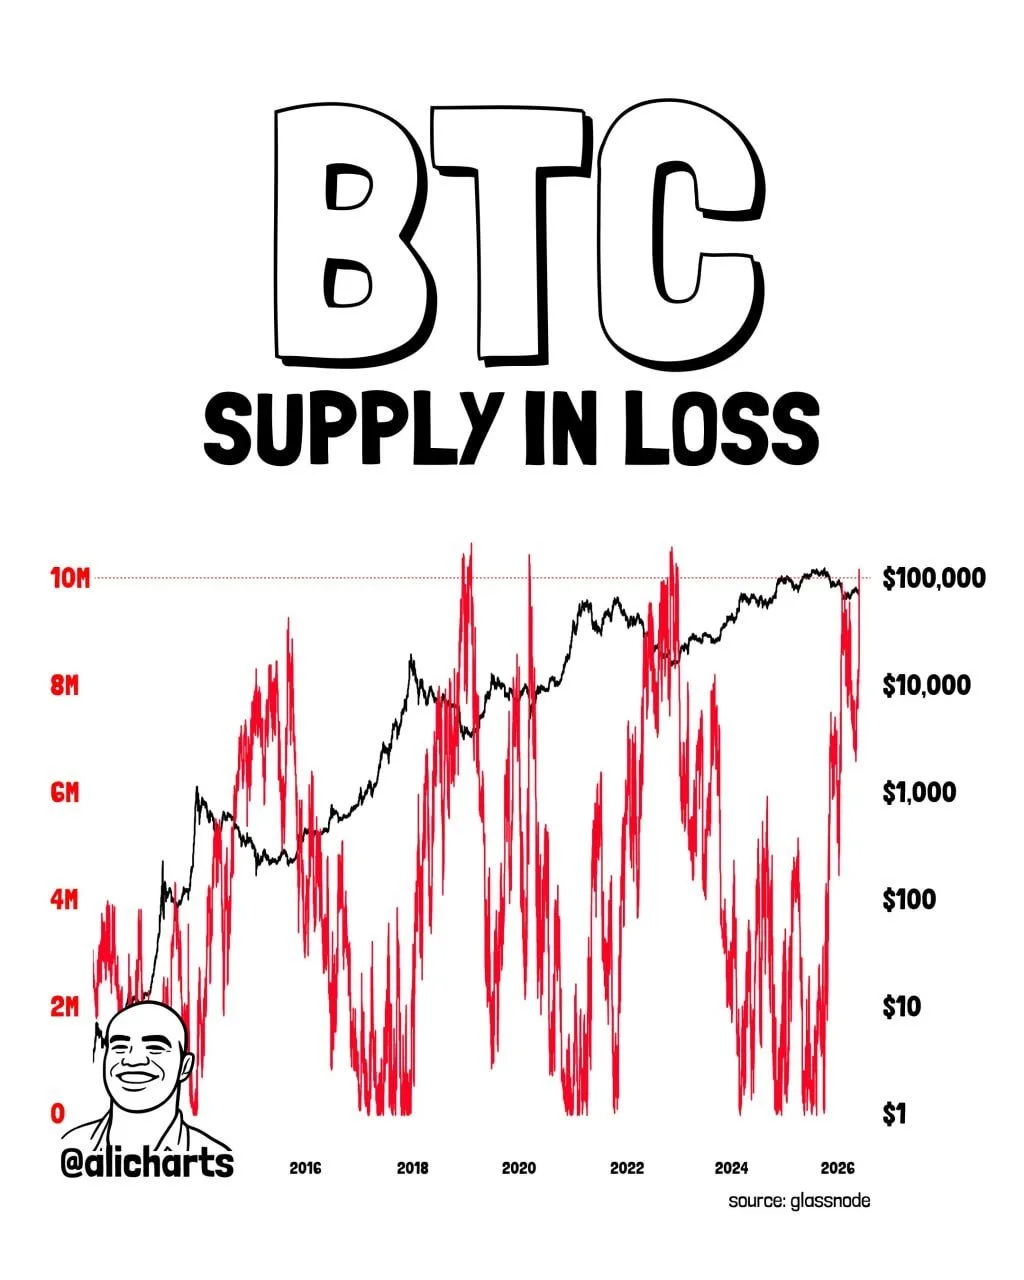
Bitcoin Supply in Loss Chart. Source: Ali Charts on X / Glassnode
The metric tracks how many coins are held below their purchase price. When this number rises sharply, it shows that a large part of the market is underwater.
According to the analysis, selling pressure can begin to fade at these levels because fewer holders want to realize losses. That can reduce forced selling and increase the chance of a market bottom forming.
However, this does not confirm an immediate recovery. The signal shows market stress and possible bottom formation, but Bitcoin may still move sideways or remain volatile before a clear reversal.
Bitcoin Buy Walls Grow as Analysts Eye Potential Move Toward $68.5K
Bitcoin is showing early signs of demand returning after a sharp decline, with new buy walls appearing across multiple price levels. At the same time, liquidity data suggests limited sell-side resistance remains until the $68,500 region, placing focus on whether buyers can extend the current recovery.
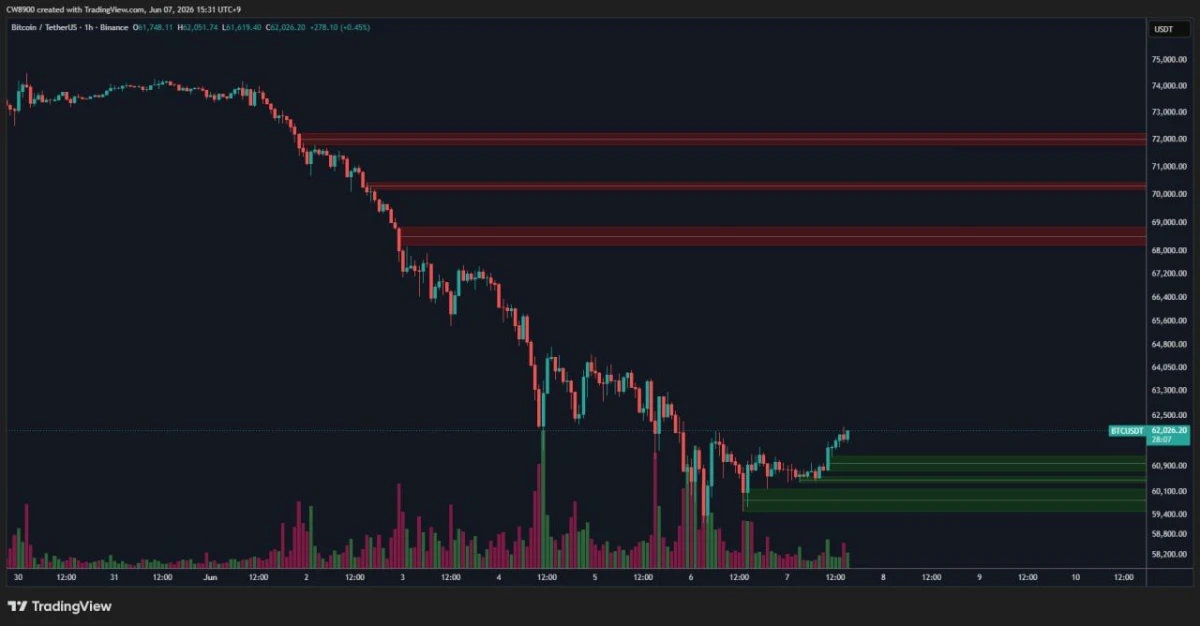
Bitcoin 1-Hour Chart ($BTC/USDT). Source: CW on X / TradingView
According to analyst CW, additional buy walls have formed between roughly $59,400 and $61,100. These green liquidity zones represent areas where large buy orders are concentrated, potentially providing support if Bitcoin experiences another pullback.
The chart shows Bitcoin rebounding from the recent low and climbing back above the clustered buy-wall region. The presence of multiple stacked support zones suggests buyers are actively defending lower levels after the recent market-wide selloff.
On the resistance side, the analysis highlights a lack of significant sell walls between the current price area and approximately $68,500. The nearest major liquidity clusters appear around $68,500, $70,000, and $72,000, where sellers could become more active if Bitcoin continues higher.
From a market structure perspective, Bitcoin remains below several key resistance zones created during the recent decline. However, the combination of growing buy-side liquidity and relatively thin overhead resistance could support further upside if buying momentum continues.
For now, traders are watching whether Bitcoin can maintain support above the newly formed buy walls. A sustained hold could strengthen the recovery attempt and increase the probability of a move toward the next major liquidity area near $68,500.
Leave a Reply
You must be logged in to post a comment.