While Bitcoin has recovered slightly following the latest price drop, market data suggests the premier crypto asset remains in the danger zone.
Bitcoin (BTC) is seeing renewed selling pressure in recent weeks, dropping from about $73,000 at the start of the month to below $60,000. While the crypto asset has since recovered above $63,000, data shows weakness remains.
This is according to the latest weekly report from Glassnode. Specifically, data confirms that bearish sentiment has spread across key areas of the market, including spot trading, derivatives, ETFs, and on-chain activity.
Bitcoin Sees Weakness in Spot and Derivatives Market
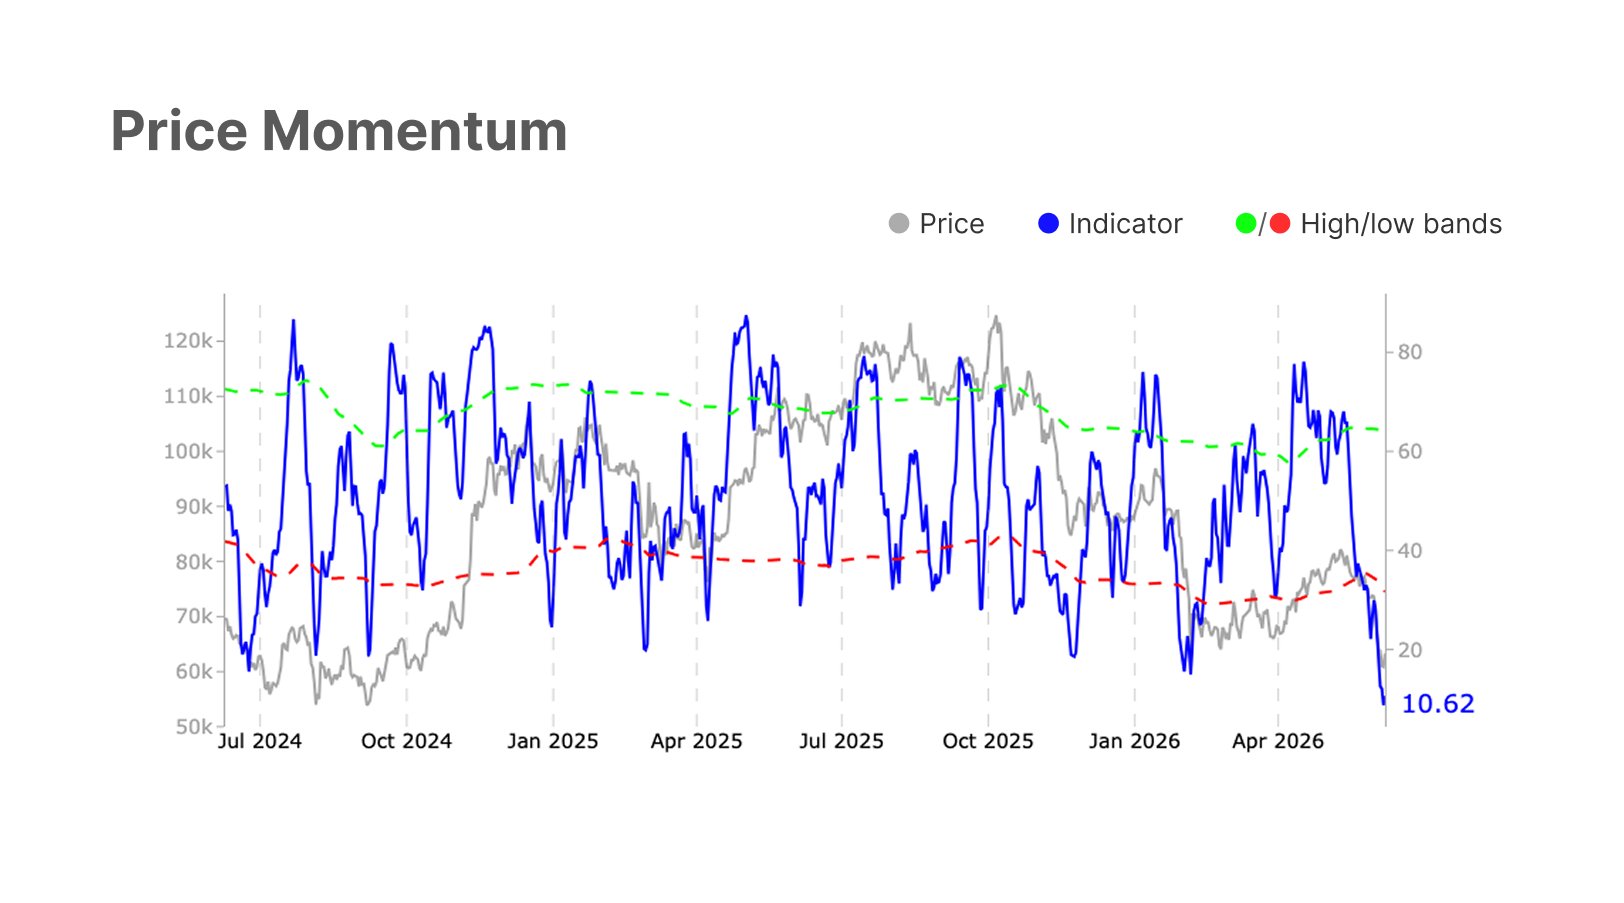
First, Glassnode noted that Bitcoin’s Price Momentum has fallen. The metric currently stands at 10.6, well below the lower statistical band of 31.6. This decline shows that buying strength has weakened considerably and that short-term price action has moved deeper into oversold territory.
Moreover, spot CVD dropped to -$168.8 million, moving close to the lower statistical threshold of -$200.9 million, as traders on centralized exchanges continue to sell aggressively and choose to exit positions.
Despite the decline in price, trading activity has remained elevated. Spot Volume climbed to $7.8 billion, placing it between the lower band of $5.3 billion and the upper band of $10.3 billion. The increase indicates that investors remain active and are responding to the recent volatility.
The futures market also shows signs of caution. Specifically, futures Open Interest declined to $32.5 billion, although it remains within the statistical range of $30.0 billion to $38.0 billion. The drop suggests that traders have reduced leveraged positions and that speculative interest has cooled.
Meanwhile, Long-Side Funding Payment fell to $0.97 million, remaining near the upper statistical band of $1.2 million. Also, perpetual CVD reached -$876.8 million, falling below the lower statistical threshold of -$469.3 million.
Options Market Turns More Defensive
The options market also shows similar bearish sentiment. For instance, Options Open Interest dropped below the lower statistical band of $33.0 billion, as traders have reduced exposure by closing positions or taking profits.
Meanwhile, Bitcoin’s Volatility Spread remains high and continues to trade above the upper statistical band of 22.15%.
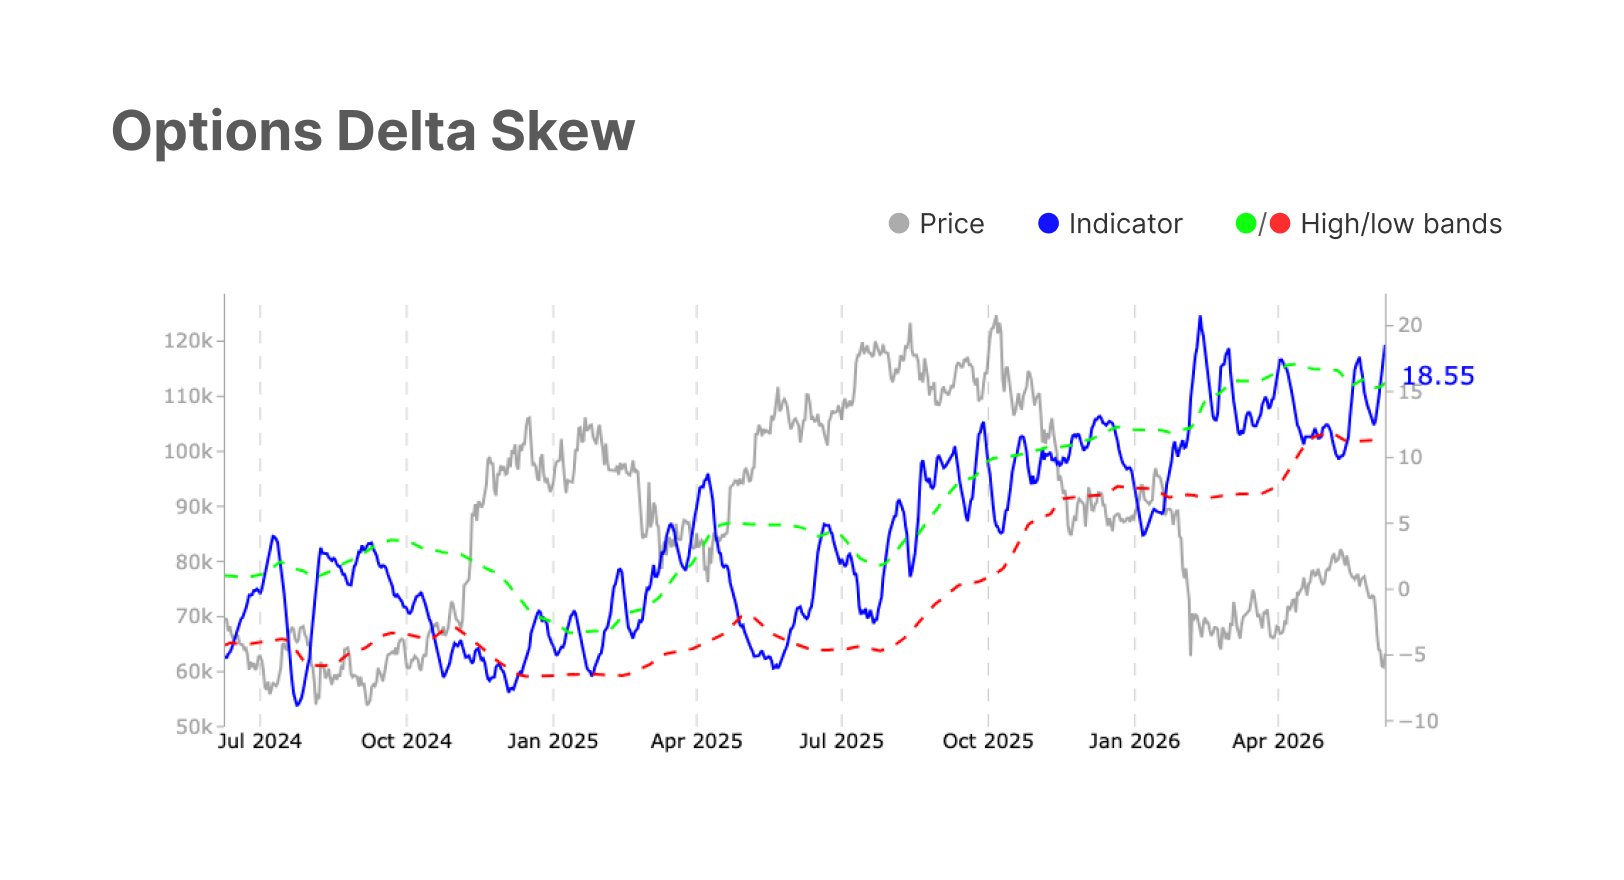
The Options 25-Delta Skew has also risen beyond the upper statistical band of 15.68%. This increase shows that traders are paying more for put options, confirming the growing demand for downside protection and a more cautious market outlook.
Bitcoin ETF Investors Continue to Pull Capital
Institutional investors have also shown signs of caution. Glassnode reported that U.S. Spot Bitcoin ETFs recorded $1.4 billion in weekly outflows, remaining below the lower statistical bound.
However, trading activity within these products remains strong. U.S. Spot ETF Trade Volume jumped to $18.2 billion on the weekly timeframe.
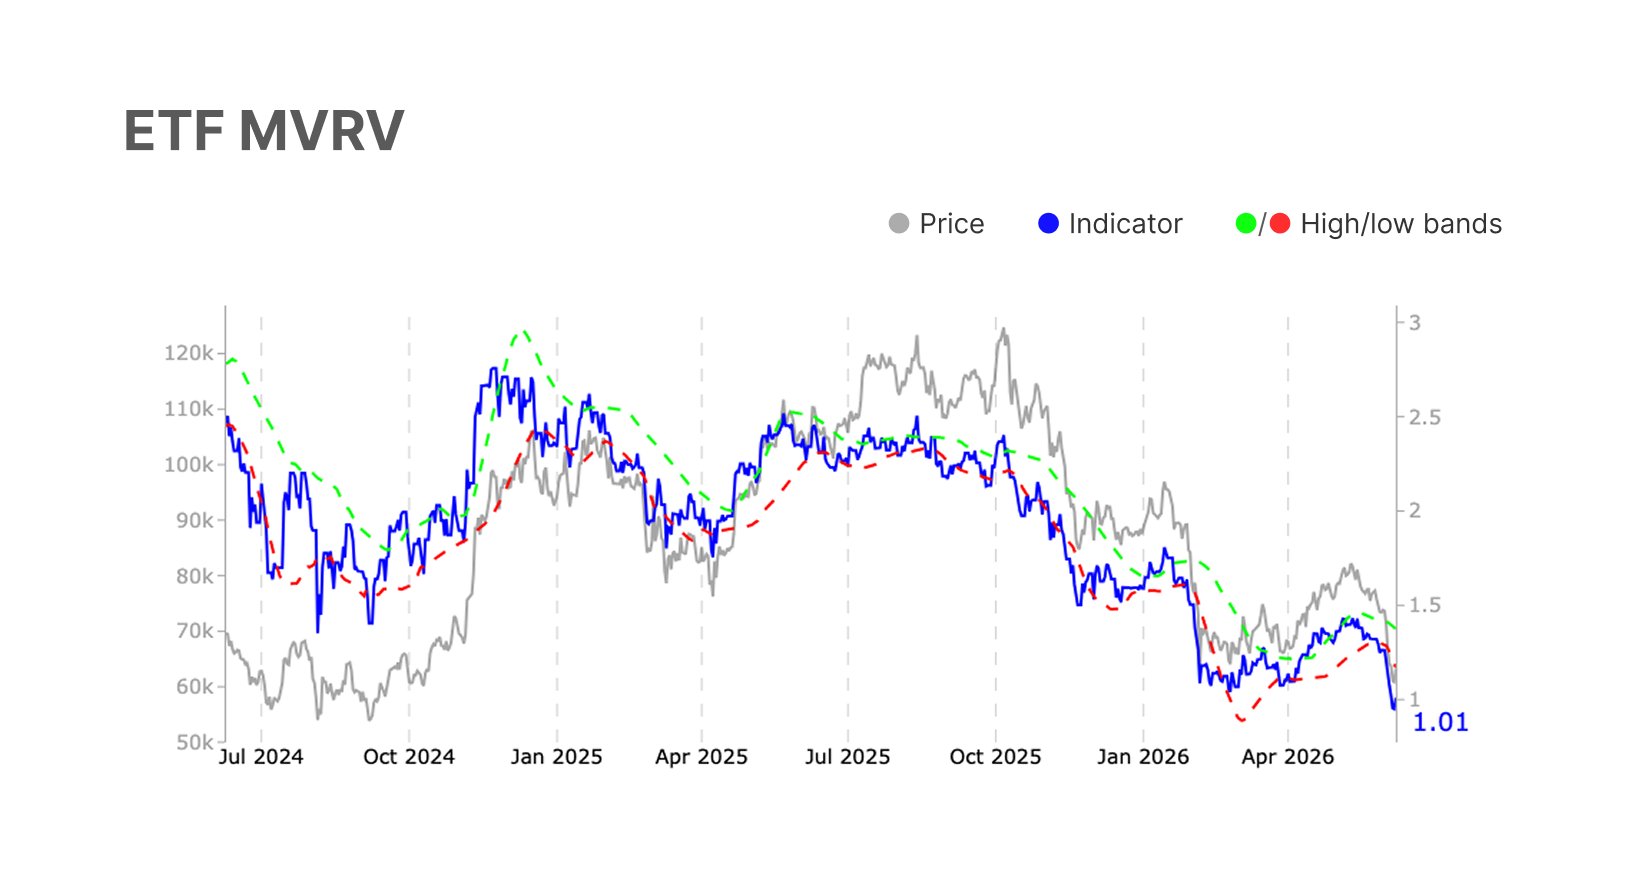
Meanwhile, U.S. Spot ETF MVRV fell to 1.01, close to the lower statistical bound of 1.0, indicating that the average institutional investor now holds Bitcoin at a value close to their original purchase price, which could limit near-term profit-taking.
On-Chain Data Shows Mixed Signals
While market sentiment remains weak, some on-chain metrics show sustained network activity. Daily Active Address Count rose to 661,100, remaining within its statistical range.
In addition, Entity-Adjusted Transfer Volume climbed to $7.2 billion, approaching its statistical high band. By contrast, Total Fee Volume declined while remaining within normal ranges.
Glassnode also reported that Realized Cap Change turned negative at -0.7%. Despite this, long-term holders continue to maintain a strong presence in the market. The STH-to-LTH Supply Ratio rose slightly to 14.0% but remained below the lower statistical threshold of 14.7%.
Leave a Reply
You must be logged in to post a comment.