Bitcoin’s demand structure has deteriorated sharply into late 2026. The combined growth of spot and perpetual futures demand has fallen toward -650,000 $BTC, a level reached only three times since 2019.
This matters because weakness now extends beyond leveraged traders and into organic market demand.
Historically, similar contractions appeared before major periods of instability.
First, demand collapsed ahead of the March 2020 crash. Later, a comparable deterioration emerged during the 2022 bear market. In both cases, extreme readings signaled structural exhaustion rather than immediate recovery.
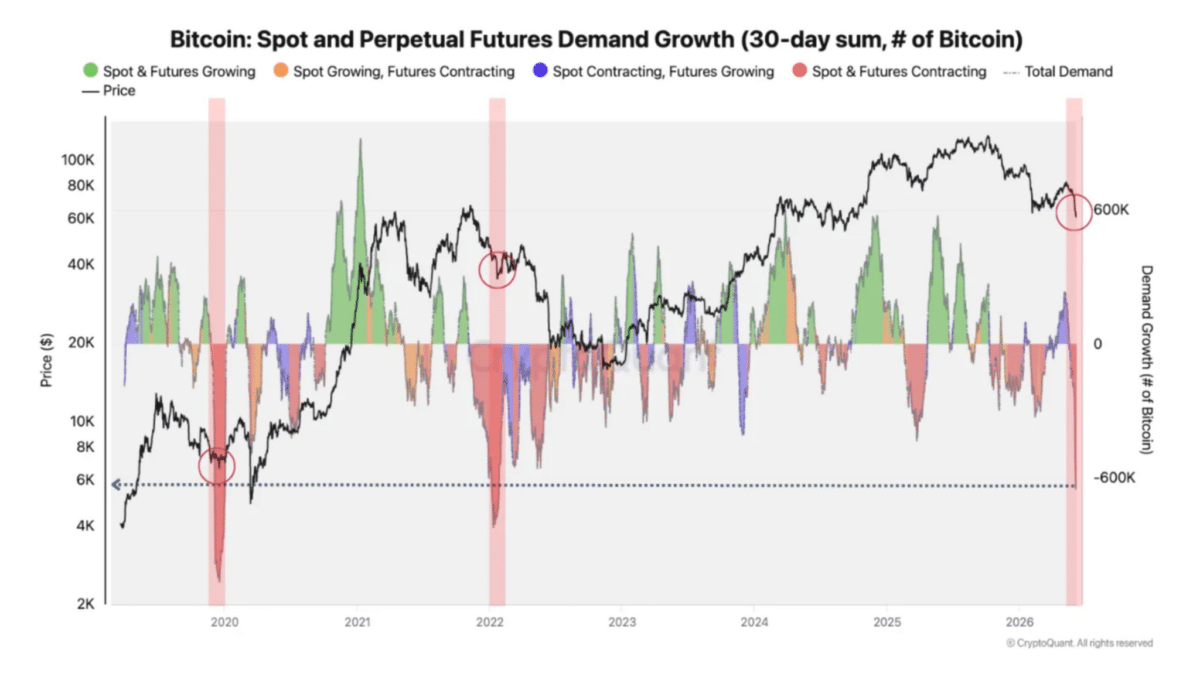
Now, Bitcoin faces a similar test. Fewer spot buyers are entering, while derivatives exposure continues shrinking. As a result, the market has less capacity to absorb fresh selling pressure.
Yet this does not automatically imply another sharp decline. Instead, history suggests volatility may expand first. Thereafter, Bitcoin could enter a prolonged phase of weak momentum and subdued participation.
Until demand begins recovering from these extreme levels, price action may remain fragile despite approaching long-term value zones.
CVDD Ratio climbs toward cycle-bottom thresholds
Bitcoin’s weakening demand profile continues weighing on sentiment.
However, valuation metrics are beginning to offer a different perspective.
The (Cumulative Value-Days Destroyed) CVDD to price ratio has climbed to 0.73, moving closer to the historical cycle-bottom threshold near 0.85.
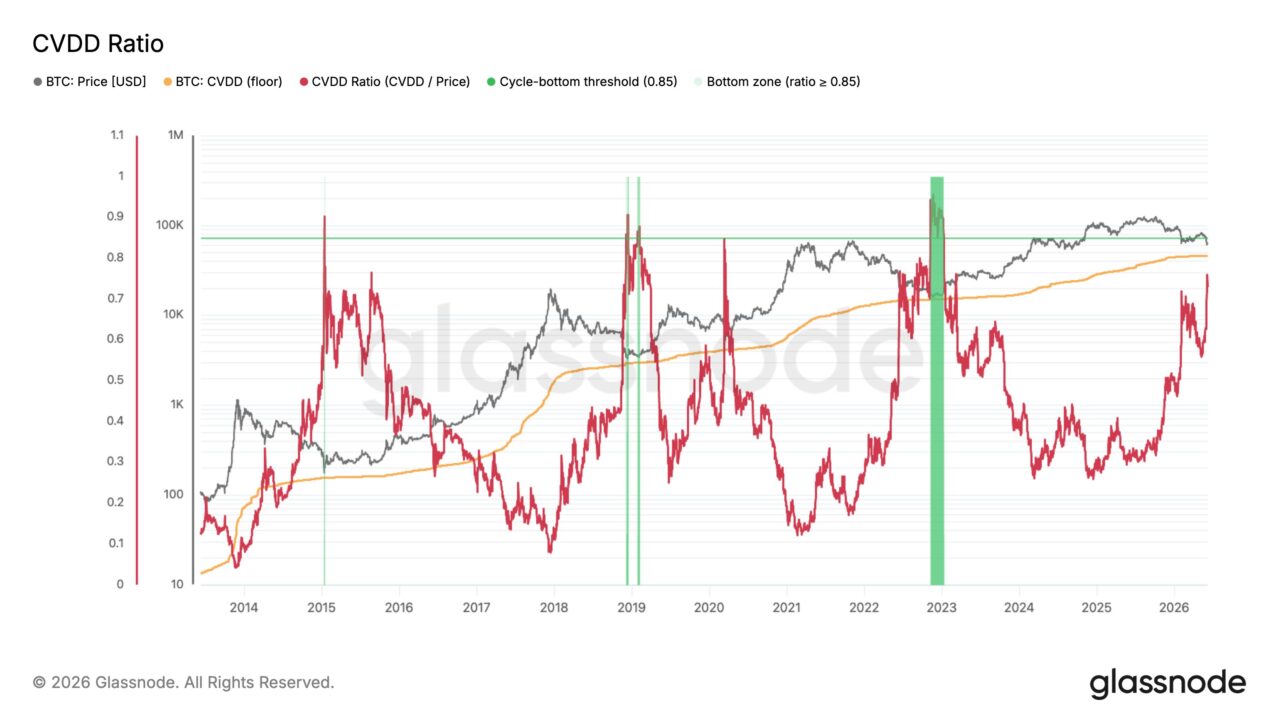
This matters because previous bear markets followed a similar path. In 2015, 2018, and 2022, the ratio approached bottom-zone levels as price converged toward the CVDD floor.
On the 9th of June, that floor sat near $46,000.
Historical projections place potential bottoming zones between $52,000 and $59,000. Therefore, Bitcoin appears closer to long-term value territory, though demand recovery remains essential before a durable bottom can form.
Liquidity drains across crypto markets
Bitcoin’s approach toward historical value zones reflects weakening demand beneath the surface. Now, broader liquidity indicators are reinforcing that signal. Over the past week, crypto ETFs recorded more than $1.8 billion in net outflows, with Bitcoin accounting for most withdrawals.
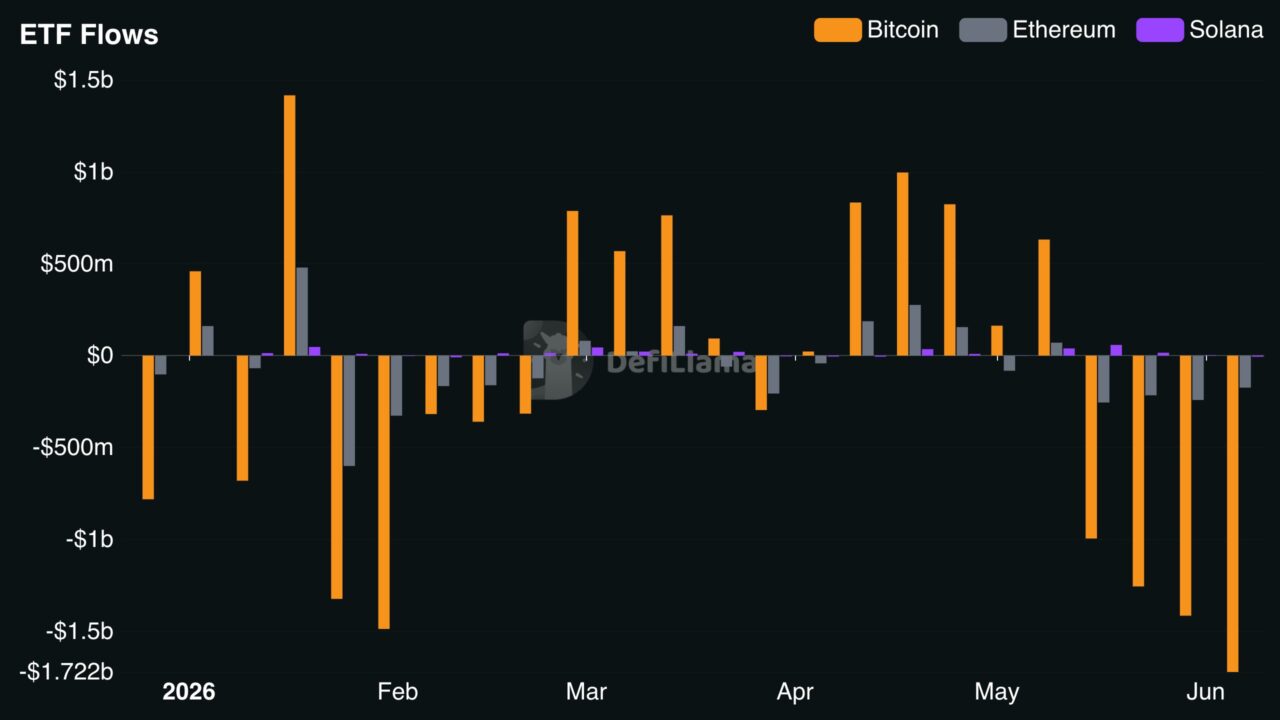
The latest reading approached $1.7 billion, highlighting a sharp shift in institutional positioning.
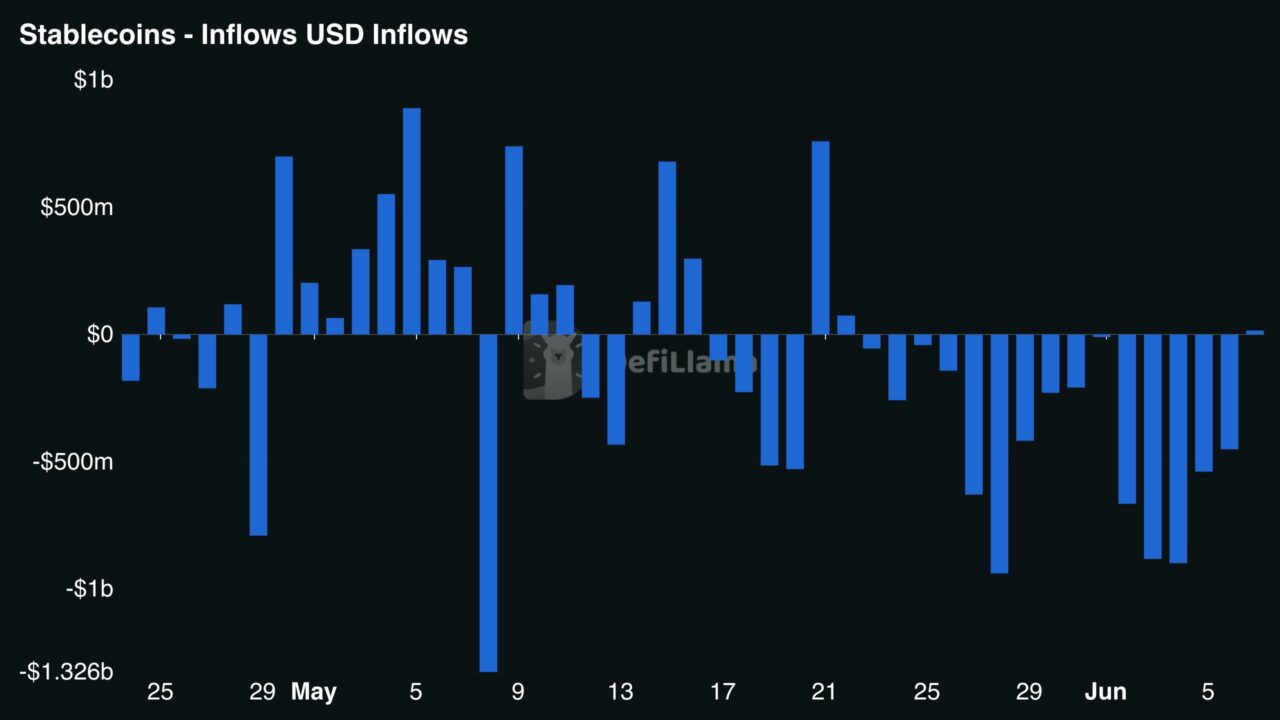
The pressure extends further. Stablecoin supply contracted by more than $3 billion, continuing a negative trend that emerged in late May. Together, these flows suggest capital is leaving rather than rotating within crypto markets.
Unless liquidity conditions improve, risk appetite may remain weak despite increasingly attractive valuations.
Final Summary
- Bitcoin [$BTC] is approaching historical value zones, but weakening demand and liquidity continue delaying bottom confirmation.
- Bitcoin remains vulnerable to volatility as ETF outflows and stablecoin contraction weigh on recovery prospects.
Leave a Reply
You must be logged in to post a comment.