According to Lookonchain, a Bitcoin [$BTC] whale recently withdrew 2,341 $BTC worth $144.68 million from OKX. This outflow from a centralized exchange might not have been an isolated incident though.
Exchange reserves have been shrinking lately, with flow data pointing to persistent accumulation. And yet, on the other hand, demand conditions have been “deeply unfavorable,” too, according to a crypto on-chain analyst.
For instance – The 200-week moving average and the 200WMA quantile metric revealed that Bitcoin may be nearing the depths of the current bear market, despite the accumulation.
A comparison of the press time price action with that of November 2025 indicated that another sell-off and a flush towards the $53K-level may be possible too.
November and the ongoing decline have some factors in common
The price action in recent days has been firmly bearish. The bounce did not attract as much trading volume as the decline did. Structurally, it seemed to be similar to the crashes that came in early February and late November 2025.
The price action in November had one key similarity with the recent days’ trading though.
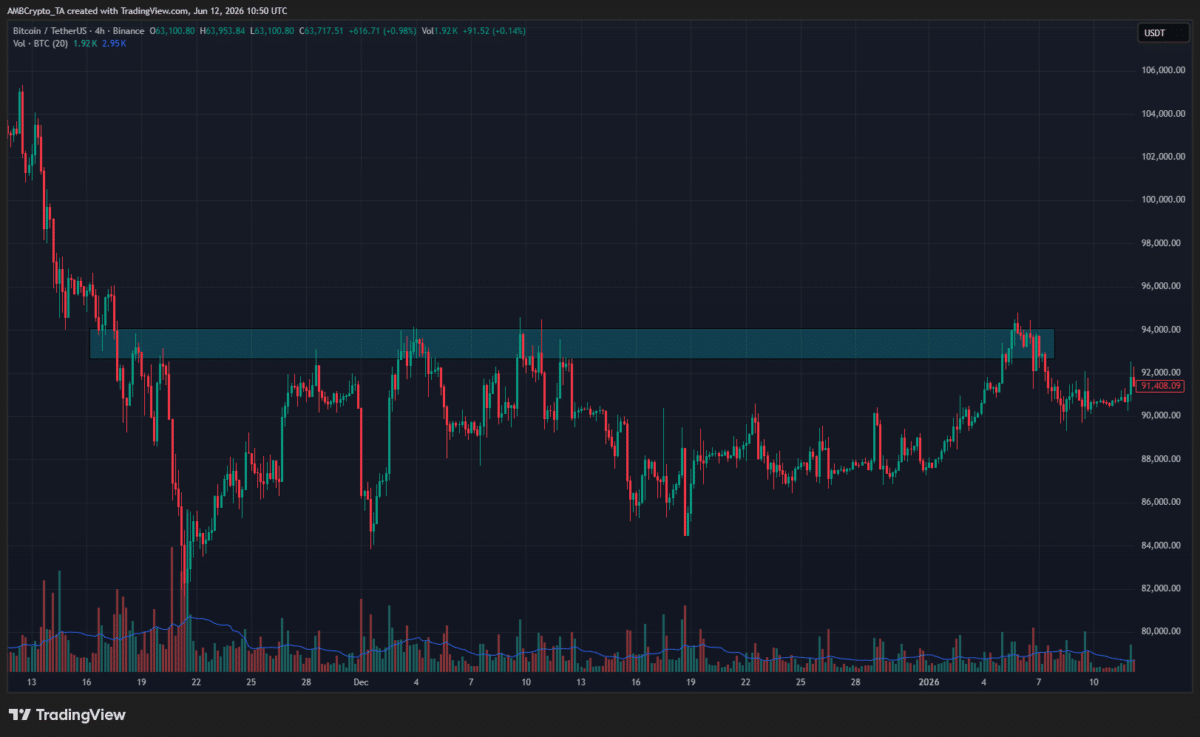
Within a few weeks of falling to the $80,600-low, Bitcoin bounced to the local supply zone at $93K. This area also marked the internal structure’s latest high.
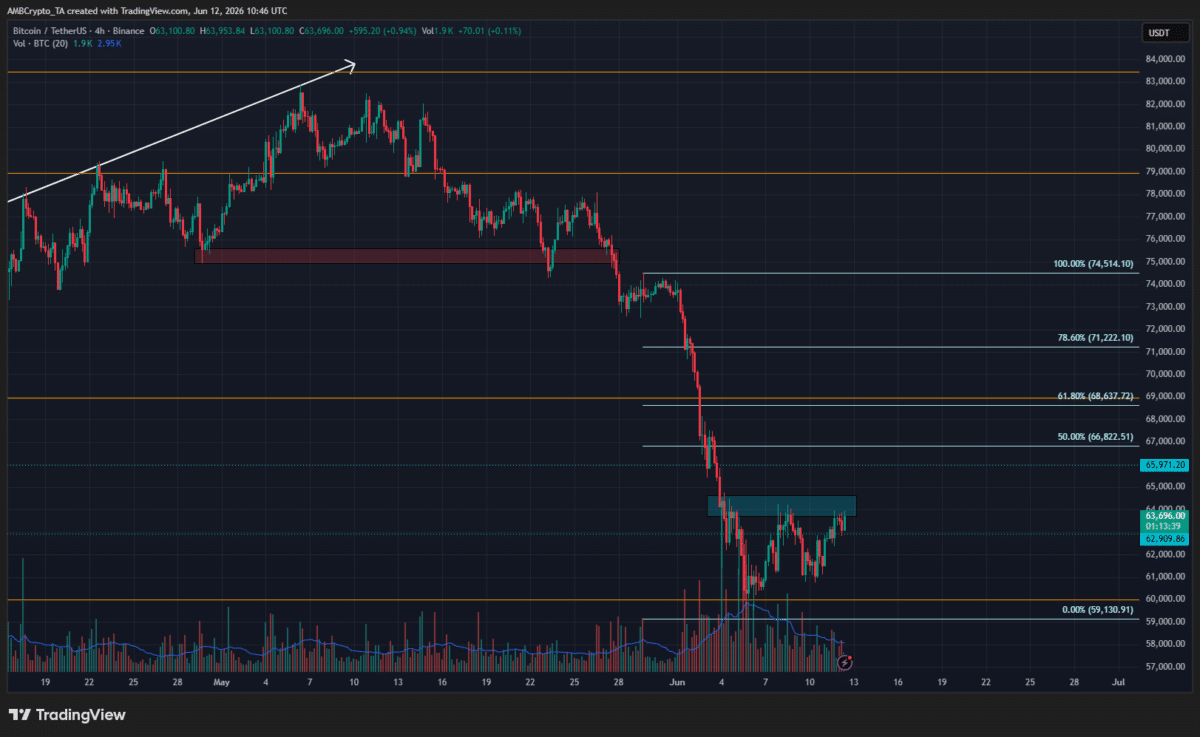
The situation may be the same for Bitcoin in June 2026. At the time of writing, the internal structure’s local high was at $64.5K – An area that the leading crypto has not breached in almost a week after the bearish impulse move.
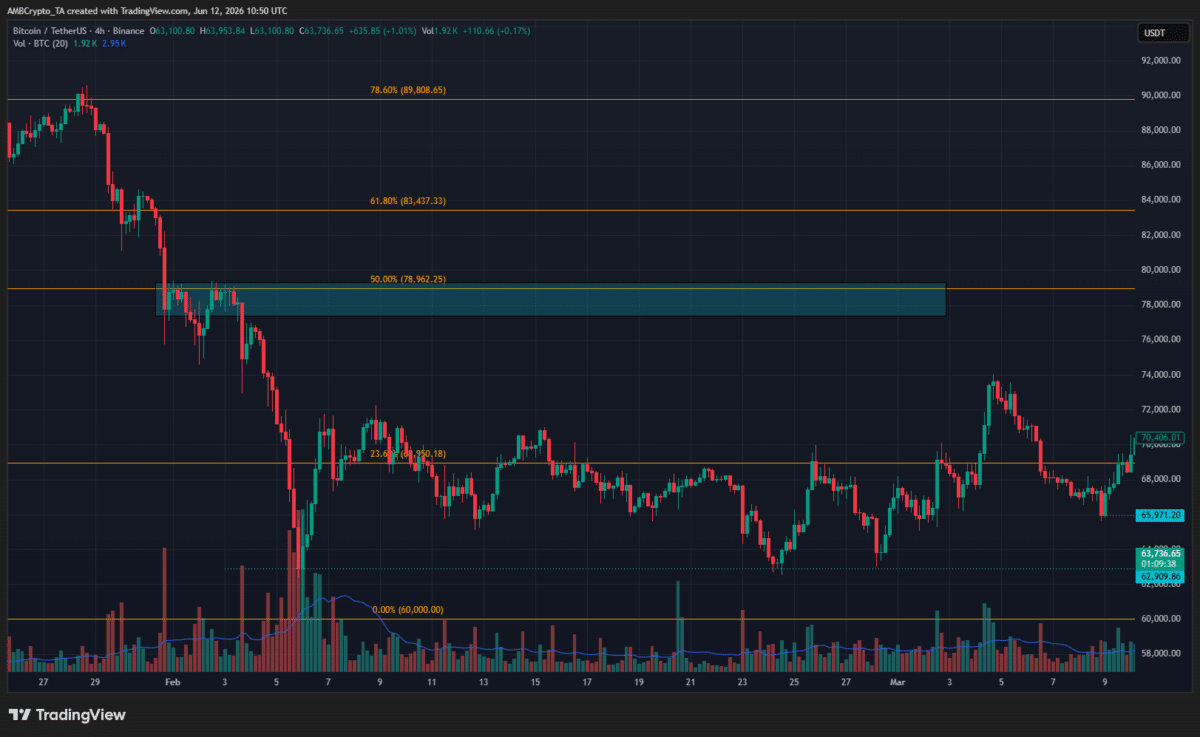
By comparison, the February crash was far more volatile and panicked, and it took two months for a relief rally to breach this level.
What does this mean for traders and investors?
In November-December 2025, after sinking to $80.6K, Bitcoin traded sideways for almost two months. It did not fall below the $80.6K-low, but tried to climb past $94K. It briefly succeeded in mid-January, reaching a high of $97,924.
The similarities between the price action then and now mean that a similar outcome could come about now.
We have established that the on-chain metrics did not show utter capitulation from market participants yet. There may be room for $BTC to go lower. However, after the recent sell-off, a few weeks of boring, sideways price action is a possibility.
However, traders should remember that even in the case of a relief rally towards $66K-$68K, new lows below $59K could be likely to occur later this year.
Final Summary
- Bitcoin’s on-chain metrics showed deteriorating market conditions and sentiment .
- Price action similarities between late-November 2025 and the past week suggest some consolidation and a brief bounce may be possible before next sell-off.
Leave a Reply
You must be logged in to post a comment.