Bitcoin ($BTC) is “compressed” at low levels but its classic cycles remain intact, say new research.
Key points:
- Bitcoin is acting just like in prior cycles as it circles a key four-year trend line.
- Analysis says that $BTC price action is currently “compressed” as it trades below a $76,400 target.
- A new estimate put the bear market as just over 70% complete.
Analysis on $62,000 $BTC price: Bitcoin “not broken”
In an X post on Wednesday, analyst David Eng said that $BTC price action still “runs on two clocks.”
“400-day clock, $BTC looks cyclical. ~4-year clock, the cycle noise gets filtered out and the adoption structure appears,” he summarized.
Marking time for Eng are the 400-day simple moving average (SMA), as well as its four-year equivalent. The former is notable for its ability to act as support throughout Bitcoin bull markets, seeing no daily candle closes below it this cycle or last.
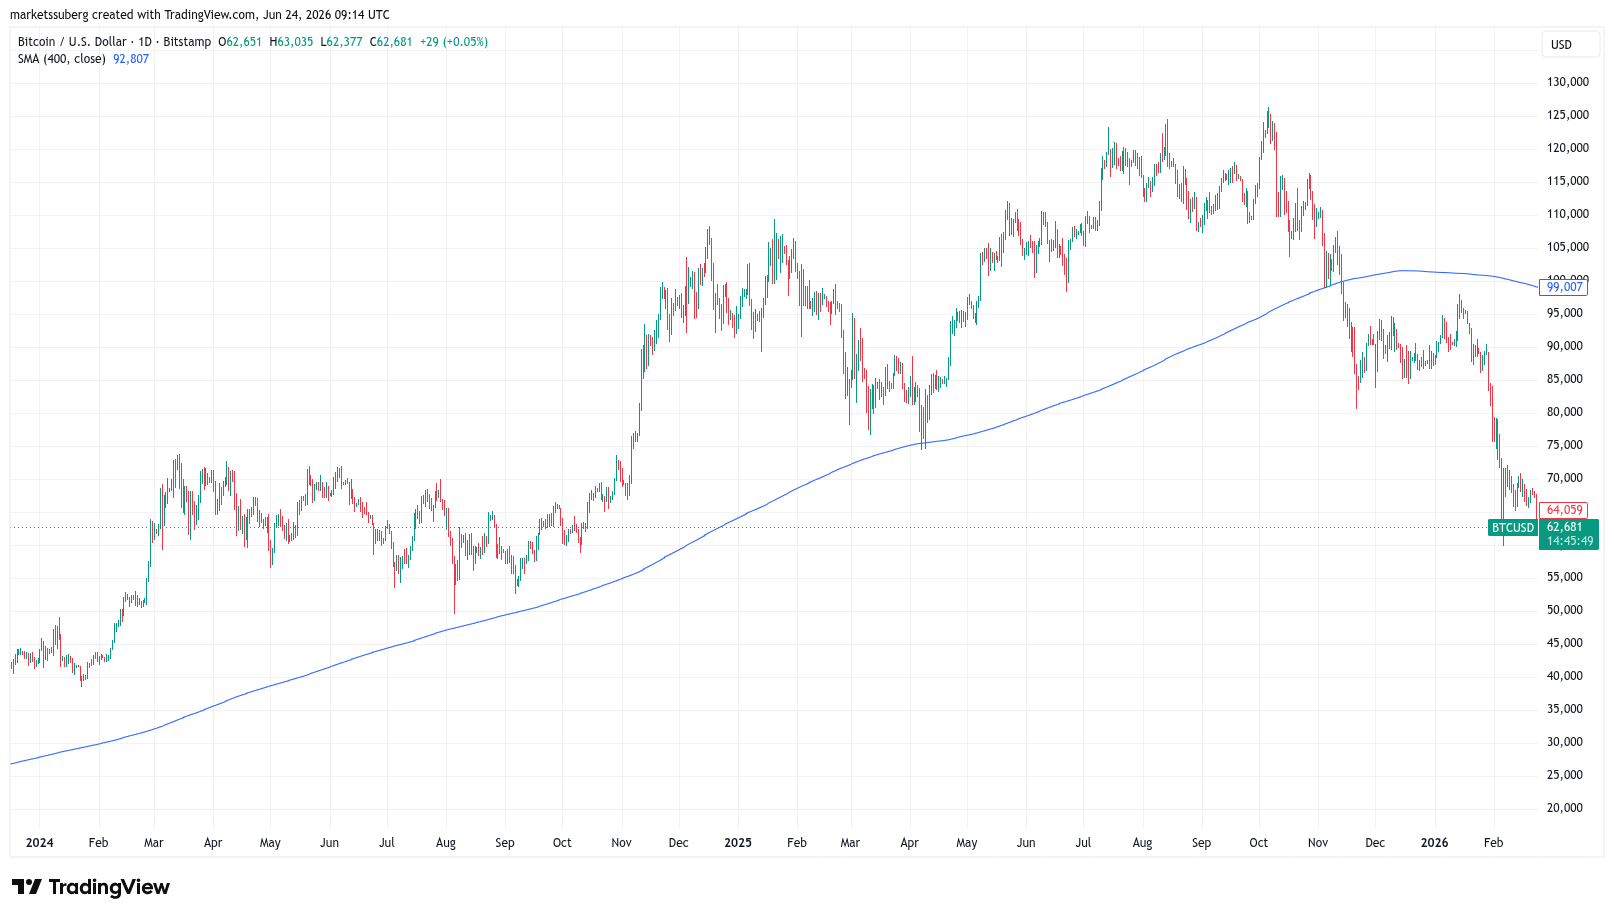
$BTC/USD one-day chart with 400SMA. Source: Cointelegraph/TradingView
On four-year time frames, meanwhile, a cleaner uptrend emerges, with price fluctuating above and below the trend line depending on its position in the cycle.
“The point is that Bitcoin keeps stretching away from this adoption structure and then reverting back toward it,” Eng summarized.
Currently, the four-year trend line suggests a fair price of around $76,400, making $BTC/USD undervalued by around 20%. A chart uploaded by Eng also shows Bitcoin’s Power Law price, this now well into uncharted territory at nearly $135,000.
“$BTC is not broken,” he concluded.
“It is compressed below its adoption structure.”
Bitcoin bear market losses could resume in August
As Cointelegraph reported, historical comparisons suggest that Bitcoin’s current bear market will continue for some months yet.
Related: US dollar strength hits highest since May 2025: Five things to know in Bitcoin this week
The latest estimates from trader and analyst Rekt Capital put the current downtrend at around 71% complete.
His analysis continues to focus on the fate of the 50-month exponential moving average (EMA), currently at $63,900.
“At this stage, if June Monthly Closes just like this at $62k then that would confirm the breakdown from the 50-Month EMA. So it July turns into a green month, then that could see price turn the 50 EMA into new resistance,” he told X followers.
“Then August would cancel out July and send Bitcoin into downside continuation.”
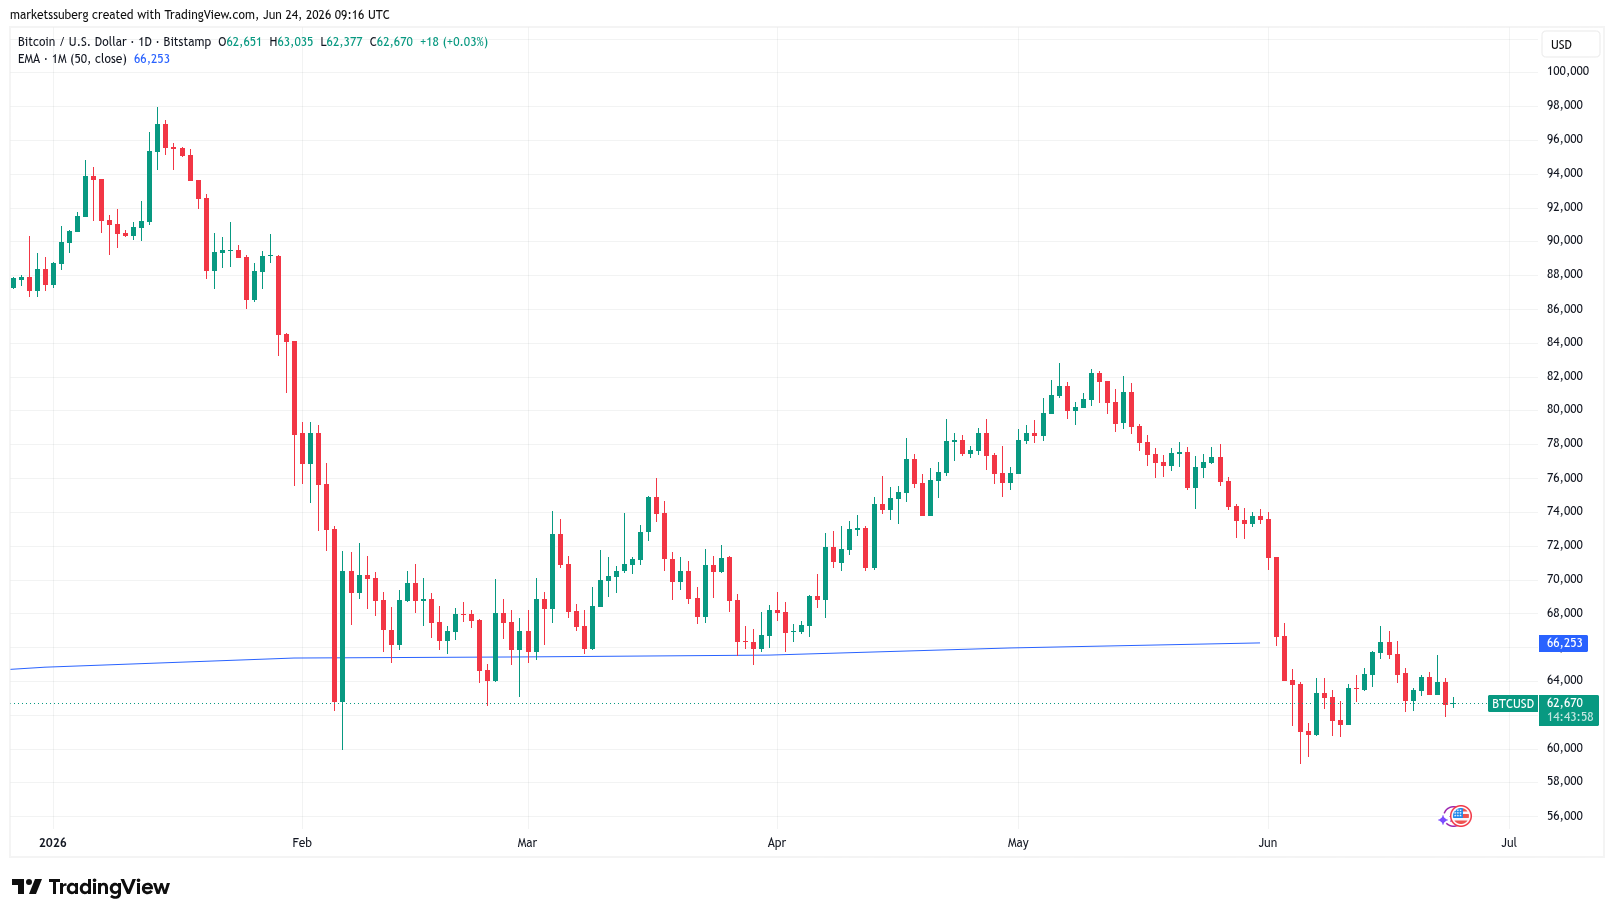
$BTC/USD one-day chart with 50-month EMA. Source: Cointelegraph/TradingView
Leave a Reply
You must be logged in to post a comment.