A Winning Streak Snaps
Bitcoin is trading near $65,300 as U.S. spot bitcoin exchange-traded funds (ETFs) posted $465 million in combined outflows on July 23 and July 24. Redemptions hit $225.1 million on the first day and $240.08 million on the second, ending a seven-session run that had pulled in nearly $1 billion over the prior week.
The withdrawals were not enough to flip the broader trend negative despite a small $33.79 million in net inflows for the week overall, meaning the late selling erased most, but not all, of the prior momentum. Bitcoin itself absorbed the outflows without much drama, spending the stretch bouncing between $63,700 and $65,400 before settling near $65,000.
Moreover, it bears mentioning that U.S. spot bitcoin ETFs have shed more than 160,000 BTC since their October 2025 peak, the largest annual drawdown since the products launched in January 2024.
Leverage, Not an Exit, Behind the Drop
Ethra Invest chief executive Saeed Al-Marri addressed a similar pattern earlier this month, telling Forbes that bitcoin’s pullbacks have been driven by forced selling rather than a broad retreat from the asset. He added:
“Right now, longs are being liquidated six times as often as shorts (6 to 1), which tells you this is bullish bets getting wiped out, not a broad exit from the asset.”
The numbers back him up given that a mid-July drawdown wiped out $73.15 million in bitcoin positions in a single day, with $62.63 million of that coming from long traders against just $10.52 million in shorts, a roughly six-to-one split that matches Al-Marri’s read.
The macro picture complicates the bearish read even further since U.S. net liquidity, a measure of the cash available to flow into risk assets once the Federal Reserve’s balance sheet, the Treasury General Account and reverse repo (RRP) operations are netted out, has climbed to roughly $5.92 trillion, up more than 3% over the past 12 weeks.
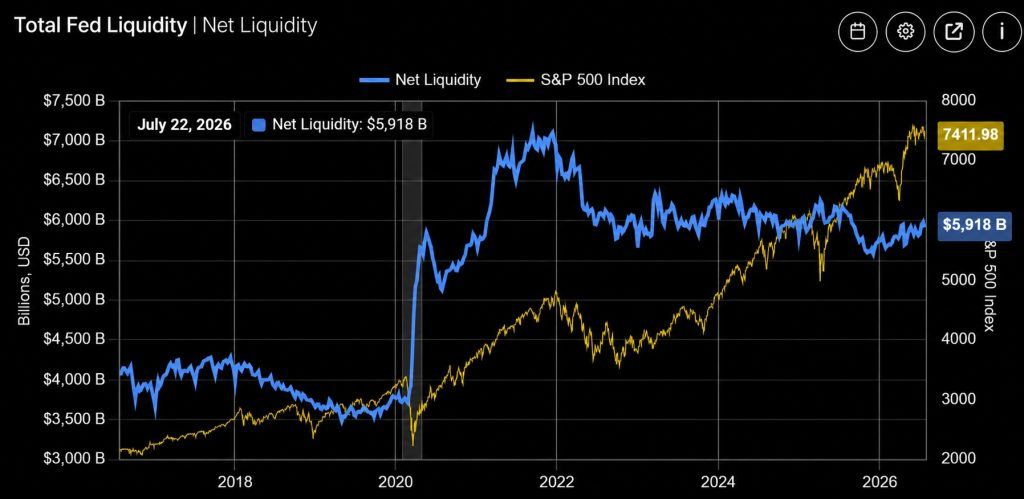
Analysts who track the metric weekly put the current reading in the 80th percentile of every weekly observation since 2003, a level historically associated with looser, not tighter, financial conditions.
The reverse repo facility, once a buffer that could absorb trillions in excess cash, has nearly emptied out. Overnight RRP volumes have fallen to a few hundred million dollars in recent operations, a fraction of the $2.37 trillion peak the facility held in September 2022. With that cushion gone, additional liquidity now has nowhere to go but directly into markets, including bitcoin and other risk assets, rather than parking at the Fed overnight.
The next scheduled test for that posturing lands August 12, when the Bureau of Labor Statistics releases its Consumer Price Index (CPI) report for July. Traders have flagged the print as the more likely catalyst for bitcoin’s next real move, since a hot inflation number would pressure the Federal Reserve to hold rates higher for longer, tightening the same liquidity conditions that have cushioned the market throughout this month.