Bitcoin is testing a crucial support zone after losing momentum above $65,000. The charts point to a possible rebound if buyers defend $62,000, but a rejection near $65,000 could send $BTC toward $60,000.
Bitcoin’s $62,000-$65,000 Support Faces a Critical Test
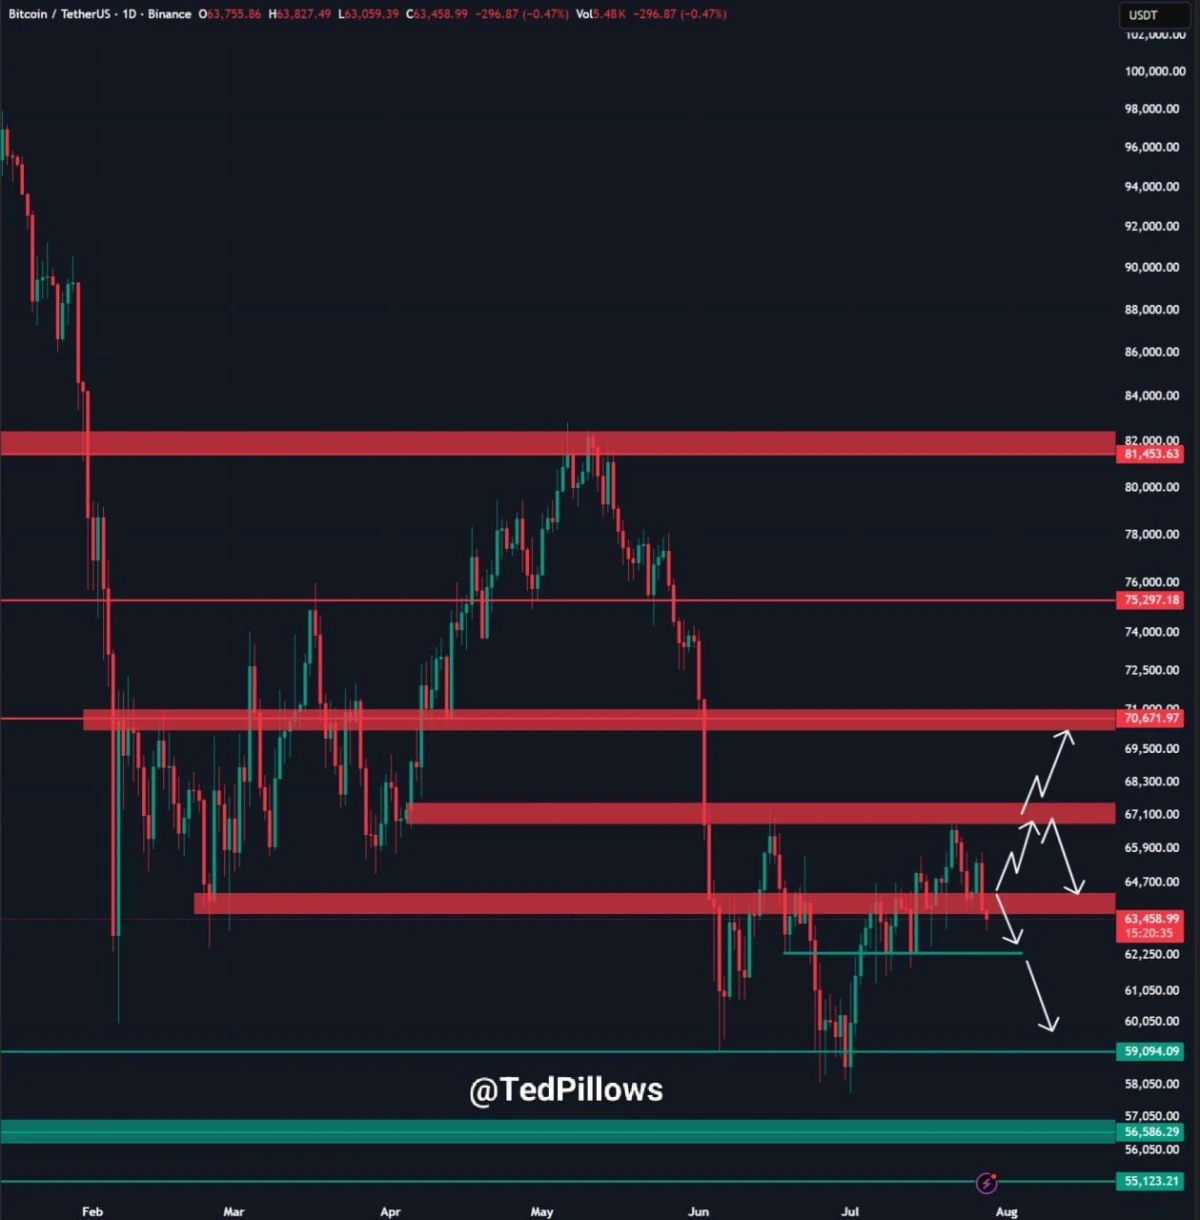
Ted’s daily Bitcoin chart shows $BTC trading near $63,459 after failing to hold above $65,000. The analyst links the latest weakness to uncertainty surrounding the Clarity Act and identifies the $62,000-$65,000 range as the key support zone.
$BTC Support Test. Source: Ted (@TedPillows)
Bitcoin now needs to defend the lower part of this range to prevent a deeper correction. A sustained rebound above $65,000 would improve the short-term structure and could bring resistance near $67,100 into focus, followed by the larger supply zone around $70,672.
However, a confirmed daily close below $62,000 would weaken the recovery case. The chart then points to support near $59,094, while a sharper decline could expose the $56,586-$55,123 area.
The practical signal is clear: Holding $62,000-$65,000 could support another recovery attempt, while losing the zone would increase the risk of Bitcoin surrendering more of its recent gains.
Bitcoin Faces a Possible FOMC Rejection Toward $60,000
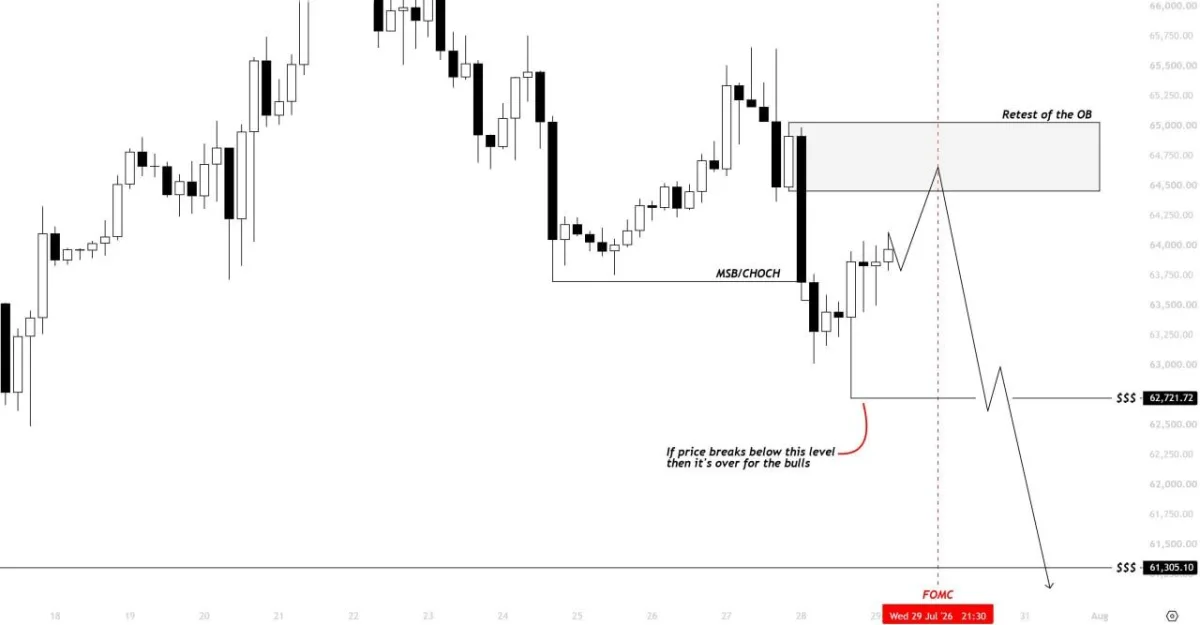
Kaz’s chart shows Bitcoin rebounding toward a resistance zone between roughly $64,500 and $65,000 ahead of the Federal Reserve decision. The analyst expects $BTC to form a lower high in that area before falling toward $60,000 to $62,000.
$BTC FOMC Setup. Source: Kaz (@XBTkaz)
The chart marks the $64,500-$65,000 range as an order-block resistance zone, where earlier selling pressure emerged. A rejection from this area would support Kaz’s bearish scenario and shift attention toward liquidity near $62,722.
Bitcoin must hold above that lower level to avoid a deeper decline. A confirmed breakdown could expose the next liquidity zone near $61,305 and bring the broader $60,000-$62,000 target into focus.
However, the forecast remains conditional. A sustained breakout above $65,000 would weaken the lower-high setup and challenge the expected sell-off, while rejection below resistance would keep downside risk elevated.