
Bitcoin’s price is trading at $120,677, with a market capitalization of $2.40 trillion and a 24-hour trading volume of $50.93 billion. Over the past day, the intraday range has spanned from $118,020 to $122,312, as traders navigate a technically bullish environment supported by recent breakouts and favorable momentum readings.
Bitcoin
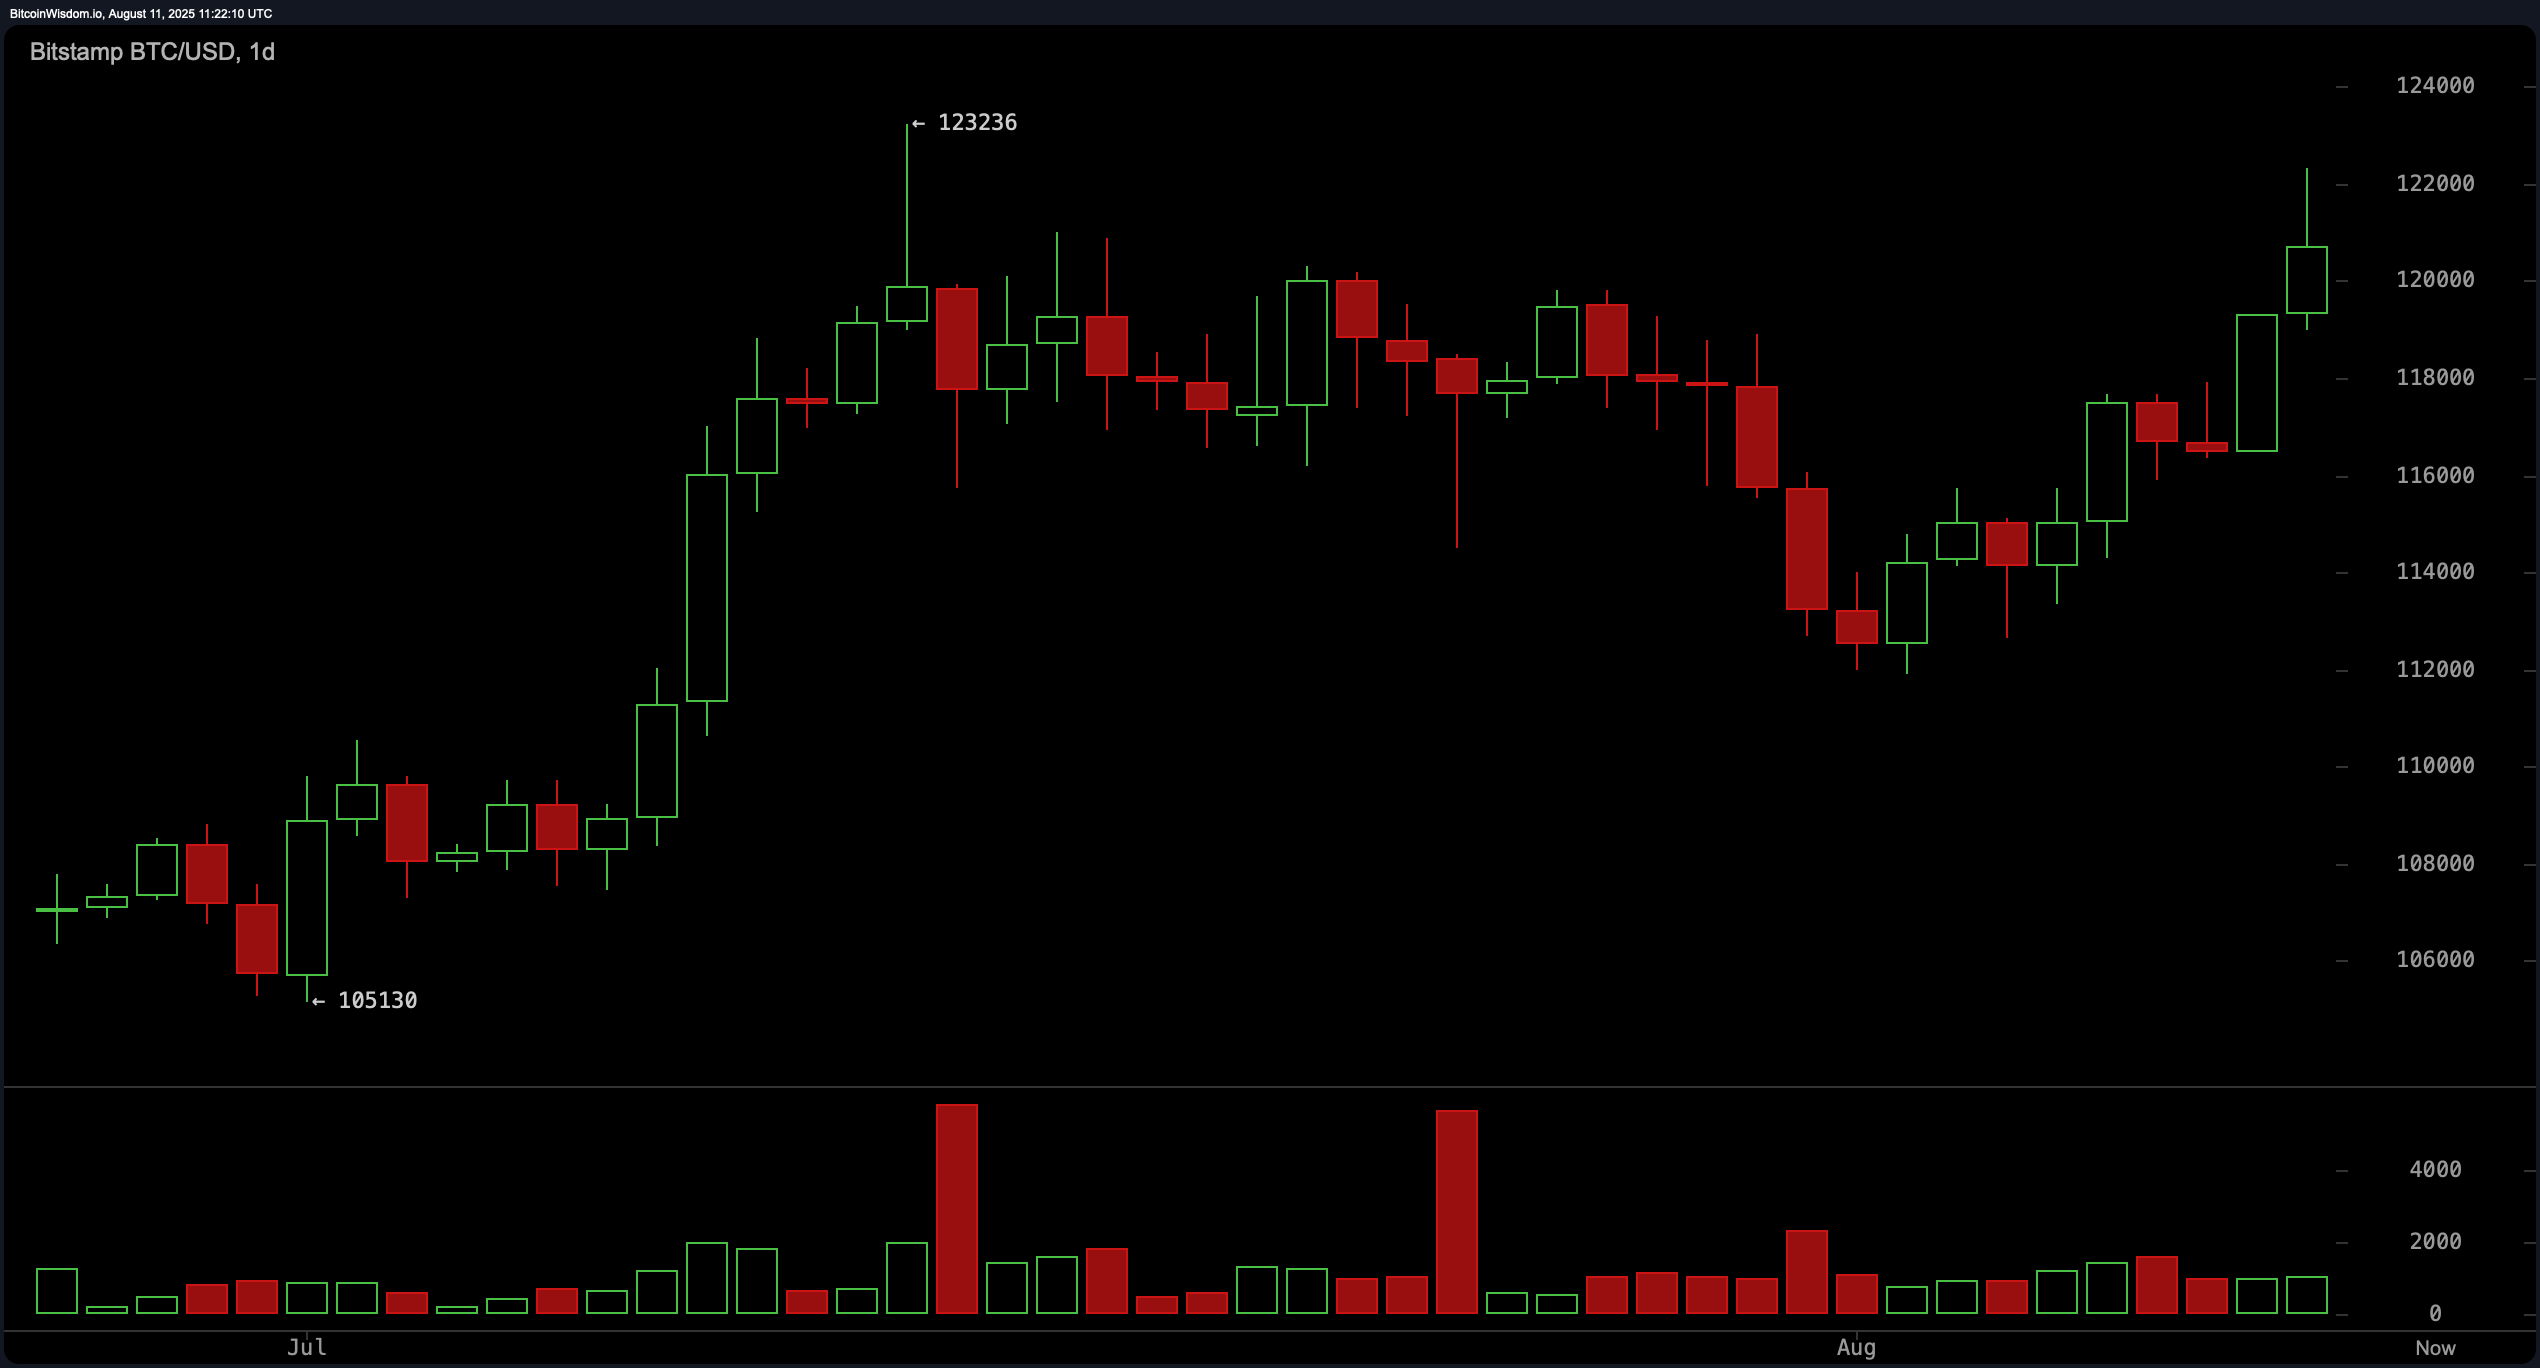
On the daily chart, bitcoin maintains a robust uptrend that began in early July, rallying from approximately $105,130 to a recent peak at $123,236. Price action has since consolidated before breaking upward once more, with immediate resistance set at $123,200 and critical support around $114,000 to $116,000. The moderate but consistent volume accompanying recent bullish candles reinforces the sustainability of this trend, although a decisive close above resistance remains crucial for continuation. A rejection here could see price retest the lower support band.
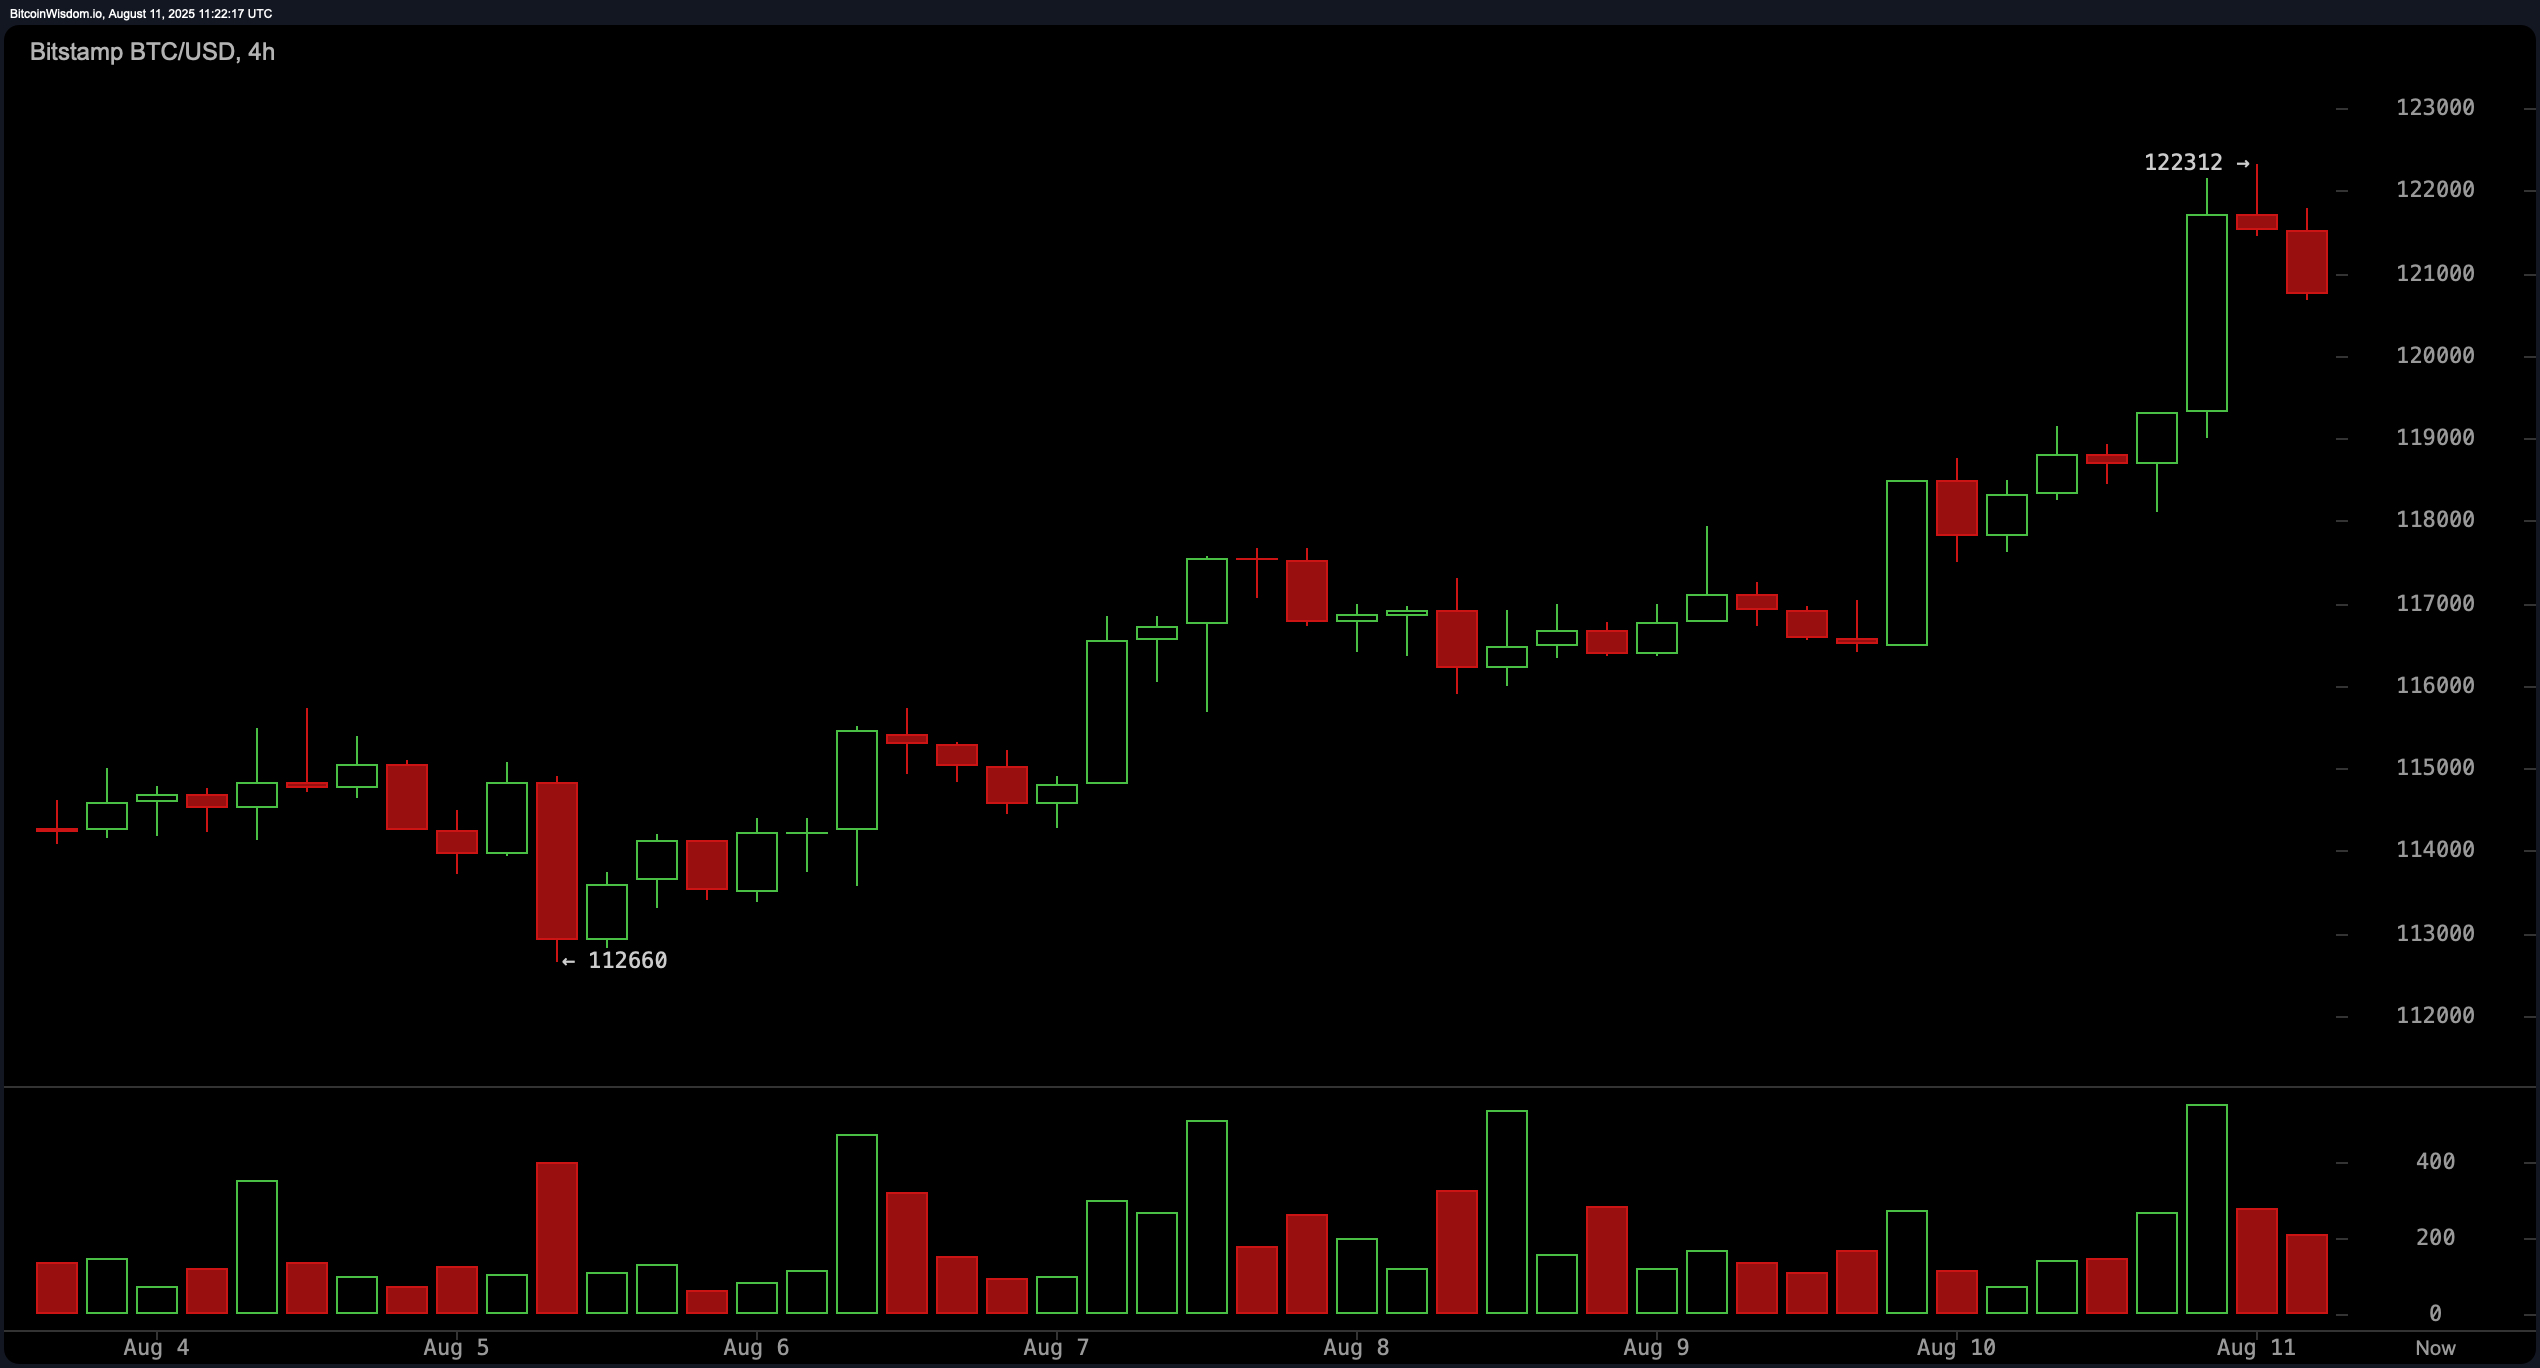
The 4-hour bitcoin chart confirms an intermediate bullish structure, marked by higher highs and higher lows. The latest breakout to $122,312 drew notable volume, followed by reduced activity during the pullback—often a constructive signal for buyers. The $120,000 to $120,500 zone emerges as a significant short-term support area, where bulls may attempt re-entry. Should momentum reassert, the next upside targets remain $123,200 to $123,500, with $125,000 as an extension.
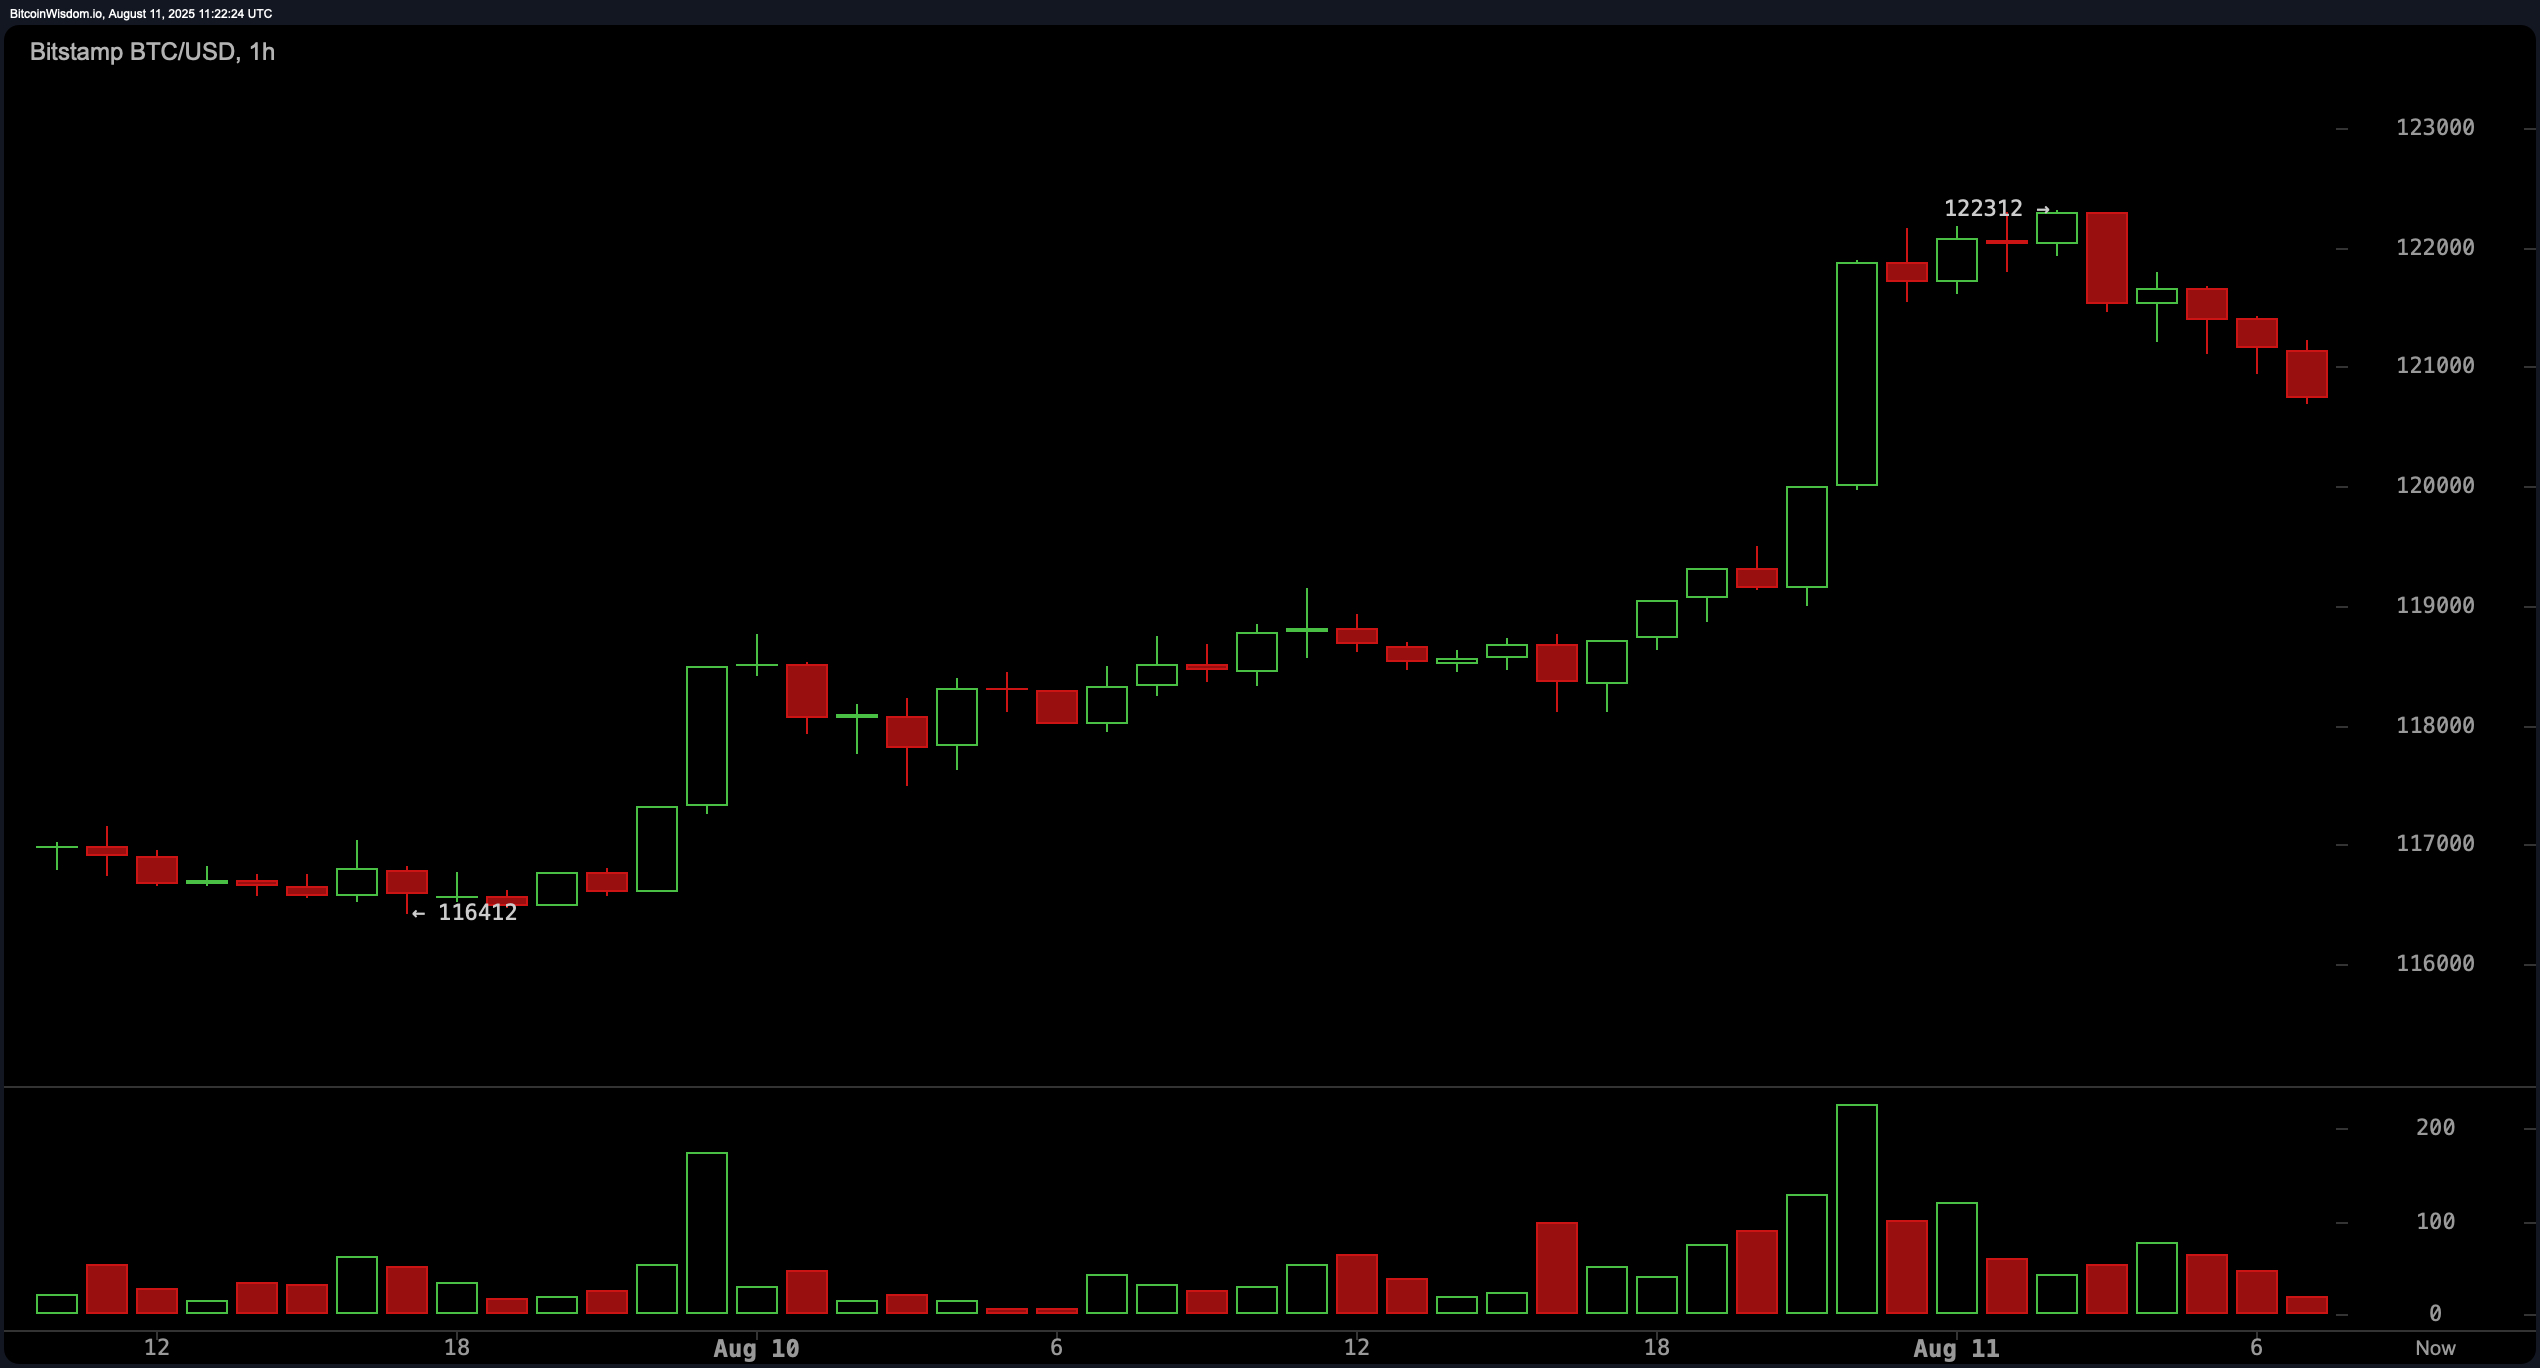
On the 1-hour timeframe, bitcoin shows a rapid climb from $116,412 to $122,312, followed by a corrective phase potentially forming a bull flag pattern. Holding above $120,500 would be a positive technical development, setting up for a retest of resistance levels. A breakout from this flag with accompanying volume could invite aggressive long entries, while a break below $119,800 may shift the near-term bias to defensive positioning.
Oscillator readings present a predominantly neutral stance: the relative strength index (RSI) is at 64, stochastic at 79, commodity channel index (CCI) at 158, and average directional index (ADX) at 17. However, the awesome oscillator, momentum, and moving average convergence divergence (MACD) all indicate bullish signals, aligning with the broader positive trend. Moving averages reinforce this bias, with all key measures—from the exponential moving average (EMA) and simple moving average (SMA) at 10, 20, 30, 50, 100, and 200 periods—issuing bullish signals, suggesting underlying strength across multiple time horizons.
In the broader market context, bitcoin is at a pivotal juncture. The confluence of bullish signals from oscillators and moving averages, combined with the recent breakout structure, favors continuation if key resistance is cleared. However, the $120,000 support remains vital; losing this level could open the door to deeper retracements toward $118,000. Traders are likely to monitor volume closely for confirmation, as the balance between bullish momentum and overhead resistance will determine bitcoin’s next decisive move.
Bull Verdict:
Bitcoin’s multi-timeframe uptrend, combined with universal buy signals from key moving averages and bullish indications from the awesome oscillator, momentum, and moving average convergence divergence (MACD), suggests that a sustained push above $123,200 could trigger a rally toward $125,000 and beyond. Holding above $120,500 would further reinforce bullish sentiment and attract additional buying interest.
Bear Verdict:
Failure to defend the $120,000 support zone could shift sentiment sharply, with a breakdown likely sending price toward $118,000 to $118,500. In this case, neutral oscillator readings may tilt bearish, undermining the current bullish structure and opening the door to a deeper correction.