Bitcoin price recovered above $64,000 on Aug. 12 after a leveraged-position flush drove $BTC into the $63,200 support zone ahead of key U.S. inflation data.
Bitcoin price action today
According to data from crypto.news, Bitcoin ($BTC) price was trading near $64,130 at the time of writing, up 0.83% on the daily candle after moving between $63,534 and $64,218.
$BTC had fallen toward $63,200 earlier in the session as sellers pushed the price below the psychologically important $64,000 level. Buyers entered near the lower end of the recent range, allowing Bitcoin to retake $64,000 without reversing the broader consolidation.
The recovery followed a sharp reduction in leveraged exposure. Yahoo Finance reported that Bitcoin’s cumulative longs and shorts delta dropped from more than $400 million to $226 million, representing a decline of about $174 million.
The $174 million figure measures the contraction in positioning rather than confirmed long liquidations alone. Separate CoinGlass data showed $174 million in total crypto liquidations over 24 hours, split between $86.21 million in longs and $87.99 million in shorts. Bitcoin accounted for $32.73 million in long liquidations and $30.81 million in short liquidations.
What is driving Bitcoin’s decline?
Geopolitical uncertainty and caution before the July U.S. Consumer Price Index report added pressure alongside the derivatives reset.
Bitcoin slipped as Iran maintained conditions for reopening the Strait of Hormuz and investors reduced risk before the inflation release. Rising energy costs have increased concerns that inflation could remain above the Federal Reserve’s target.
A Reuters poll showed economists expected headline CPI to rise 0.1% from June and 3.4% from a year earlier. Core CPI was forecast to increase by 0.2% monthly and 2.5% annually.
The Bureau of Labor Statistics scheduled the July report for 8:30 a.m. ET on Aug. 12. A result above forecasts could strengthen expectations that the Fed will keep rates elevated or consider another increase, while a softer reading could reduce pressure on risk assets.
Corporate selling also remained part of the market backdrop. Strategy’s official Bitcoin ledger showed the company sold 1,690 $BTC for about $109 million at an average price of $64,262 during the week ending Aug. 10.
Strategy used the proceeds to repurchase STRC preferred shares rather than add them directly to its cash reserve. The company separately raised $653.1 million through common-stock sales and directed $650 million to its U.S. dollar reserve.
Bitcoin faces resistance at $64,400 and $65,500
The 4-hour chart shows Bitcoin recovering from the lower Bollinger Band at $63,233. Price remained below the 20-period middle band at $64,394, leaving $64,400 as the first level bulls need to reclaim.
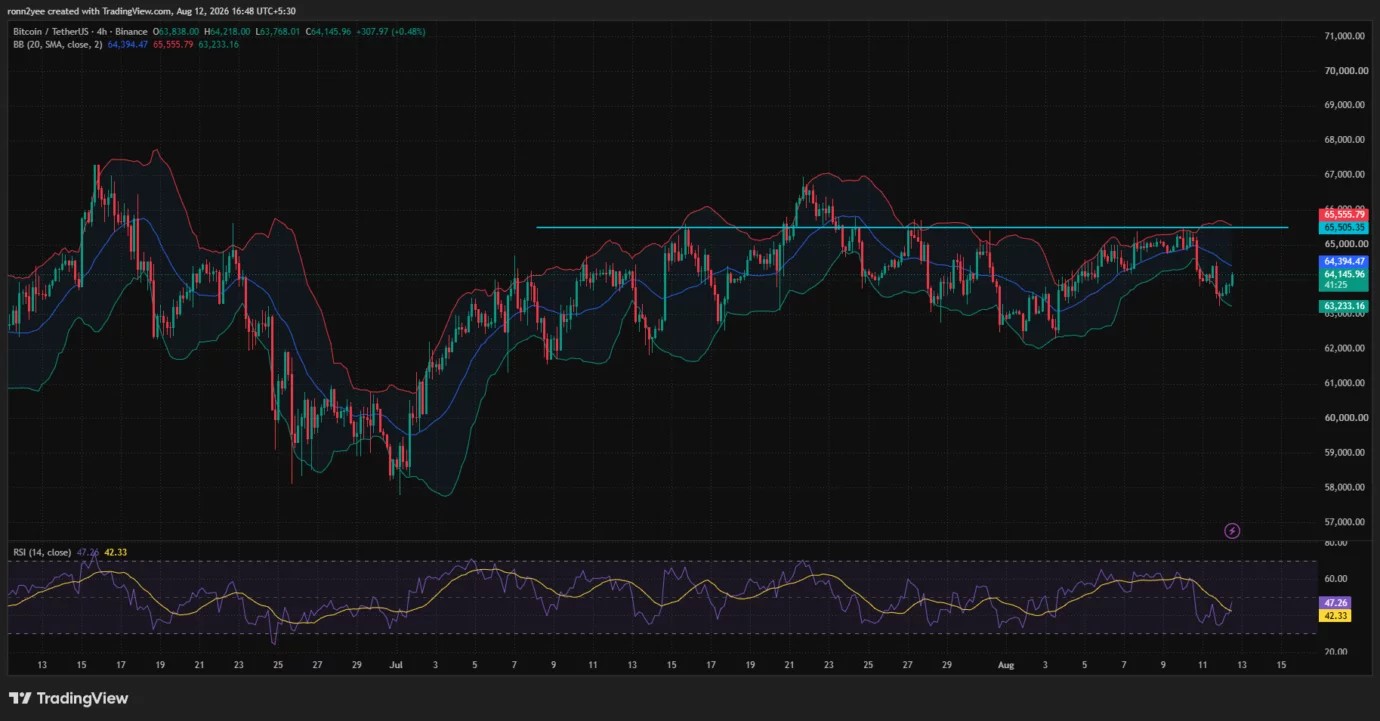
A move above the middle band could open another attempt at $65,505, a horizontal resistance level that has rejected several rallies since mid-July. The upper Bollinger Band sits close to $65,556, strengthening resistance across the $65,500–$65,600 area.
Momentum has improved without producing a confirmed bullish reversal. The 4-hour relative strength index recovered to 47.26 from near-oversold territory and moved above its signal average of 42.33. An RSI break above 50 would give buyers stronger evidence that short-term momentum has shifted.
The daily chart presents a weaker trend. Aroon Down stood at 78.57%, compared with Aroon Up at 21.43%, showing that recent downside activity remains more dominant. An average directional index reading of 16.76 indicates limited trend strength; however, this supports continued range trading rather than a strong directional move.
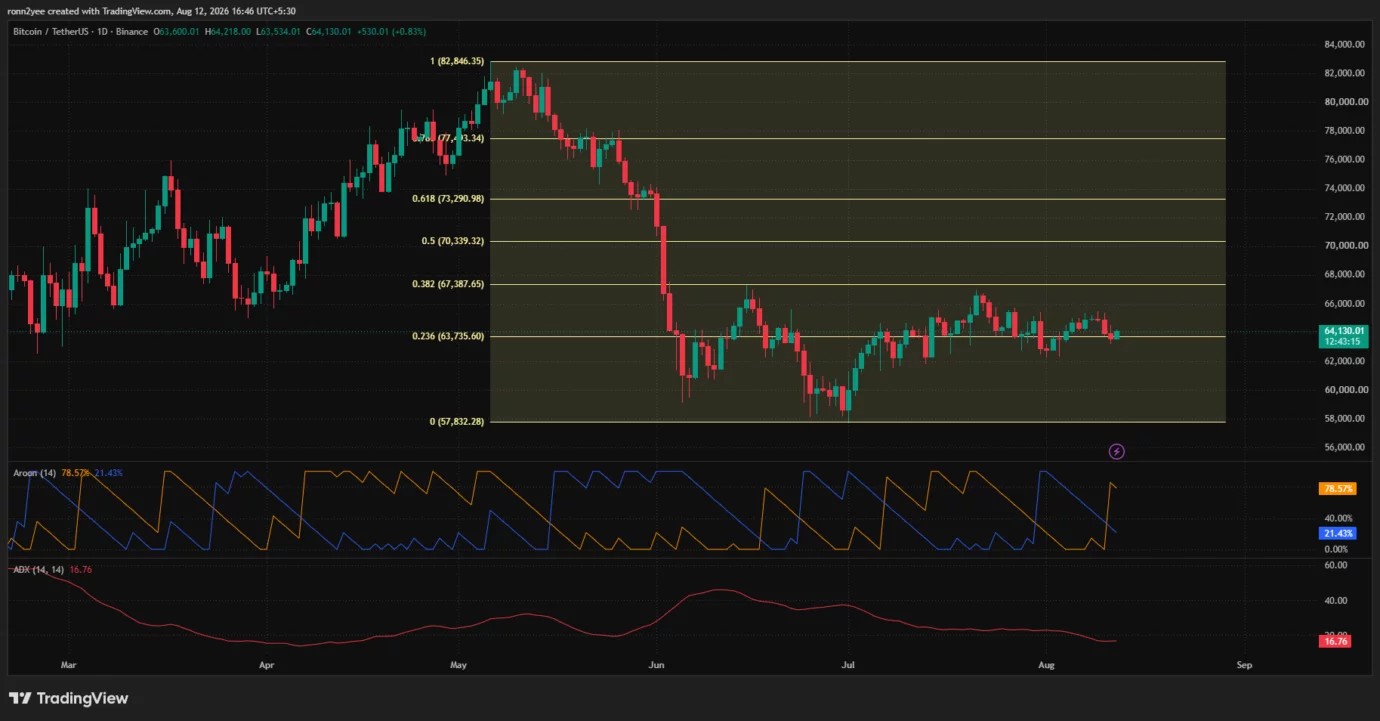
Bitcoin also remains close to the 23.6% Fibonacci retracement at $63,735, measured between the March low of $57,832 and the May high of $82,846. Holding above $63,735 would preserve a path toward $67,388, while a daily close below the level could expose $62,000 and the broader $57,800–$60,000 support region.
Liquidation heatmap maps the next $BTC targets
CoinGlass’ 3-day liquidation heatmap shows a dense liquidity cluster near $63,200–$63,400, matching the area where Bitcoin’s latest decline stopped. Additional liquidity sits around $62,700–$63,000, making the $63,000 region a likely target if sellers regain control.
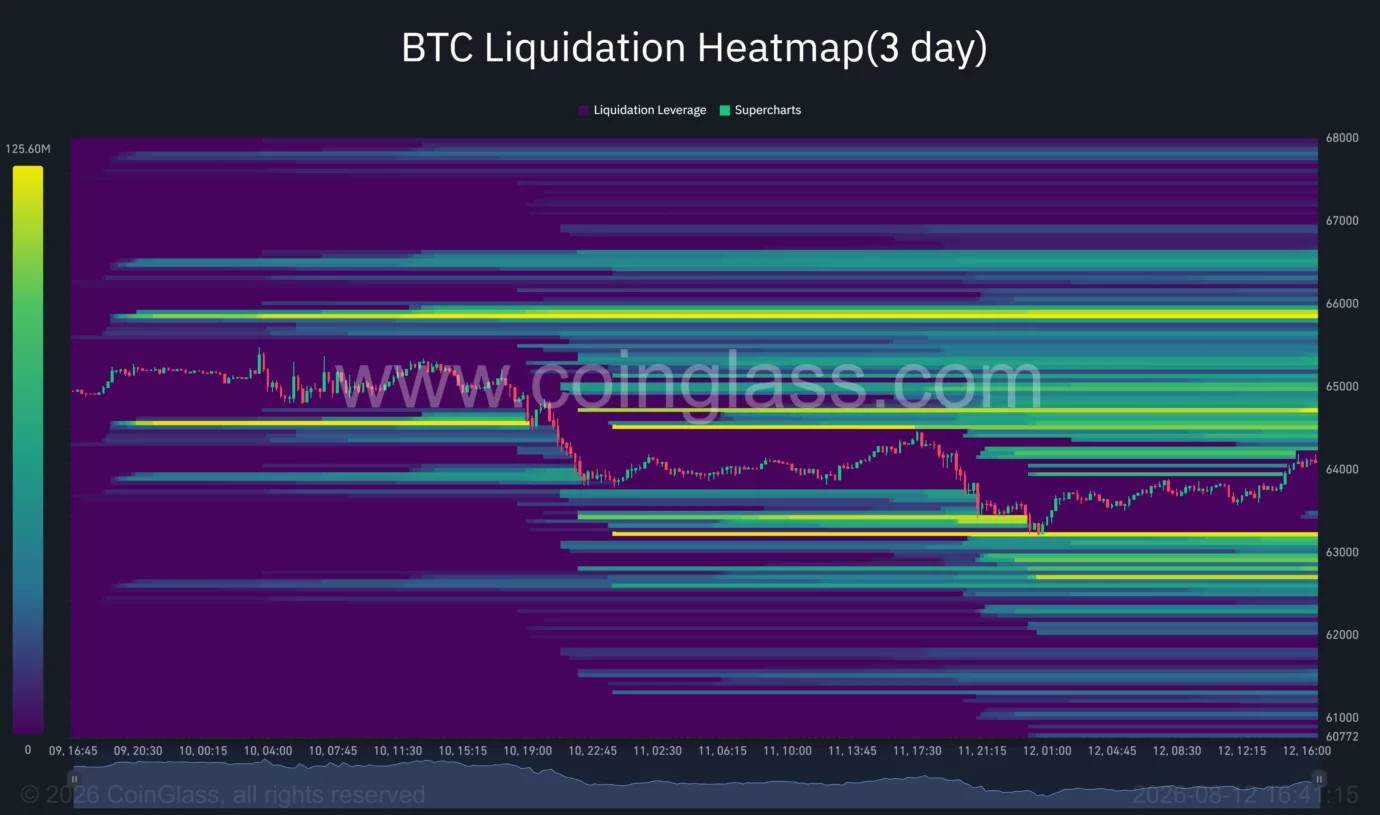
The closest upside concentrations appear near $64,600–$64,800. Larger pools sit around $65,800–$66,000, giving the market potential targets if Bitcoin clears $64,400 and builds momentum.
Trader Lennaert Snyder said Bitcoin had taken the $63,300 low and was consolidating around $64,000 after reaching his short target.
“Sellers are still in control, but the 63K region could deliver a nice hedge-long to cover short-exposure.”
Analyst Ted Pillows identified $62,000–$62,500 as the next major support zone after Bitcoin failed to reclaim $65,000. Both outlooks place the immediate risk below the current price, while the charts require a sustained break above $65,500 to weaken the bearish case.
$BTC failed to reclaim the $65,000 level.
The next key support zone for Bitcoin is $62,000-$62,5000 which might gets retested before reversal. pic.twitter.com/rasiwYjjAH
— Ted (@TedPillows) August 12, 2026
U.S. CPI data remains the main near-term catalyst. Bitcoin could challenge the $64,800 liquidity band if inflation meets or falls below expectations, while a hotter reading could bring $63,000 and $62,500 back into focus.