The Bitcoin price prediction now hinges on whether history repeats: $BTC lost its daily trendline today, and analyst notes the last time that happened, price dropped 20%, a move that would put this Bitcoin price prediction’s downside case near $50,000 to $51,000.
Bitcoin Price Prediction Today: $BTC Loses Its Daily Trendline
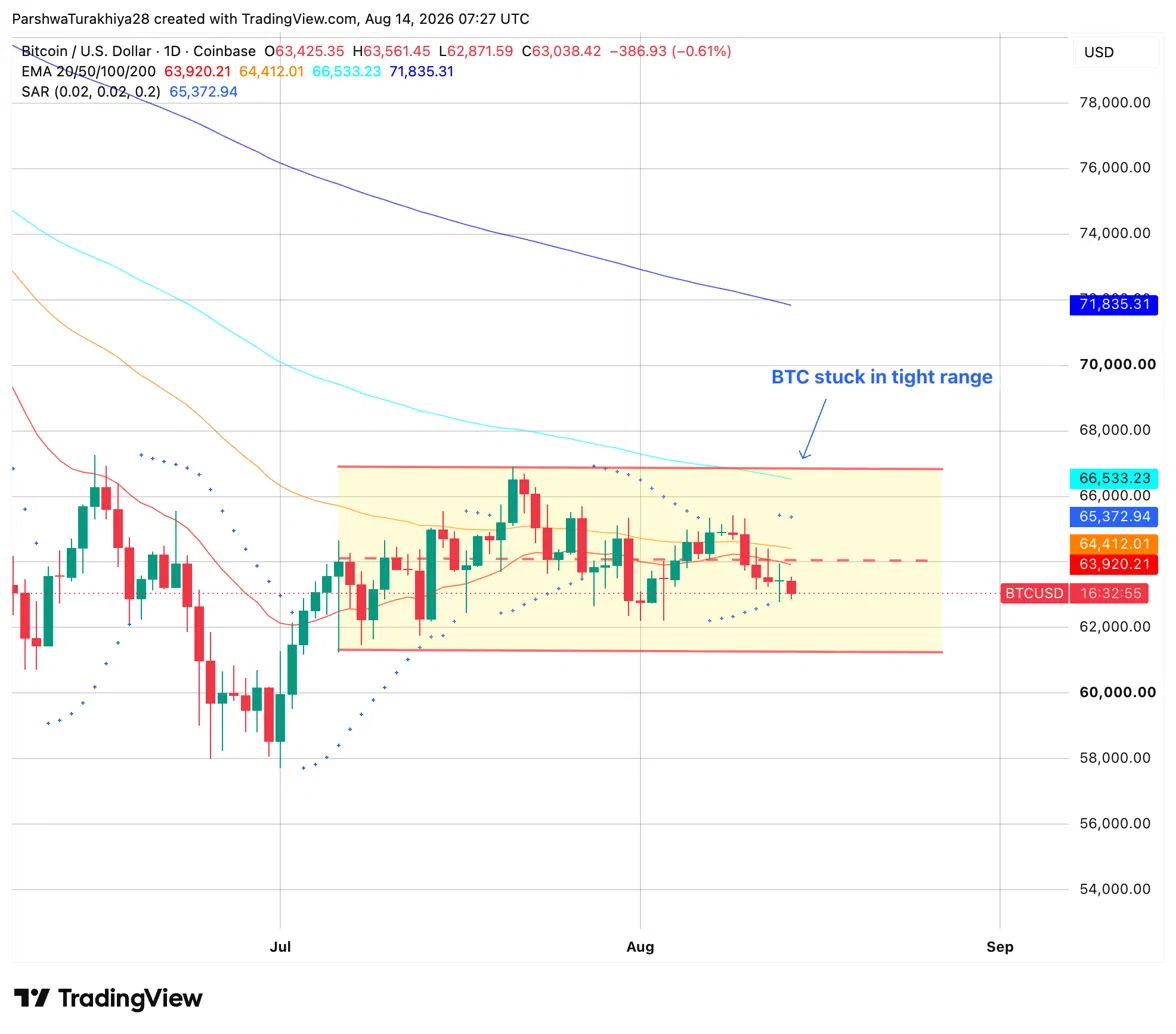
$BTC price is stuck inside a consolidation range that’s contained between roughly $61,500 and $67,000 since late June. Today’s session opened at $63,425, pushed briefly to $63,561, and slid to a low of $62,872 before settling at $63,038, sitting in the lower third of that range, exactly where a more cautious Bitcoin price prediction would expect price to sit after losing a key trendline.
All four EMAs slope downward above price. The 20-day at $63,920 is the immediate ceiling, followed by the 50-day at $64,412, the 100-day at $66,533, and the 200-day at $71,835. The Parabolic SAR, a trend-following indicator that flips bullish or bearish as momentum shifts, sits at $65,373 and remains bearish above price.
Bitcoin just lost its daily trendline
Last time this happened, $BTC dumped 20%
We’re cooked pic.twitter.com/IVFd26MD7p
— Ash Crypto (@AshCrypto) August 13, 2026
Analyst Ash Crypto flagged on X that $BTC just lost its daily trendline, a line connecting a series of rising lows that had supported each bounce since May. The last time that trendline broke, Ash Crypto notes, $BTC dropped 20%, a decline that at current levels would put price in the $50,000 to $51,000 range, a scenario worth taking seriously for any near-term Bitcoin price prediction.
Related: Cardano Price Prediction Hits Make-or-Break Level as Community Unlocks 120M ADA and OCC Opens the Floodgates
The $62,000 level and the range’s lower boundary near $61,500 are the key supports to watch. A daily close below $61,500 would invalidate the consolidation structure entirely and open a path toward lower targets, while $67,000 remains the range ceiling if buyers step back in.
$BTC Support and Resistance Levels, August 14, 2026
| Type | Price | Level |
| Resistance | $63,920 | 20-day EMA |
| Resistance | $64,412 | 50-day EMA |
| Resistance | $65,373 | Parabolic SAR |
| Resistance | $66,533 | 100-day EMA and range upper boundary |
| Support | $62,000 | Horizontal support within range |
| Support | $61,500 | Range lower boundary, must hold |
| Support | $58,000 | Cup base, last major floor if range breaks |
$BTC ETF Flows: Negative Week After the Best Week Since May
Spot Bitcoin ETFs recorded a $131.13M daily outflow on August 13, with BlackRock’s IBIT shedding $5.74M, Fidelity’s FBTC losing $55.12M, Grayscale’s GBTC dropping $36.29M, ARK’s ARKB down $58.82M, and Bitwise’s BITB losing $9.28M. The only positive products on the day were Grayscale’s $BTC mini trust at $38.93M and Morgan Stanley’s MSBT at $7.08M.
The weekly total through August 13 stands at -$332.08M, with Friday’s session still to be counted. That makes this the second consecutive negative week, coming directly after the week of August 7 which brought in $853.54M, the strongest week since early May. The reversal from $853M to -$332M in a single week is sharp and adds a meaningful flow-level reason for the price pressure at range lows.
| Week | Weekly Net Flow |
| Aug 13, 2026 (4 days) | -$332.08M |
| Aug 7, 2026 | +$853.54M |
| Jul 31, 2026 | -$61.53M |
| Jul 24, 2026 | +$33.79M |
$BTC Analysis: 228K $BTC Into Binance and a Daily Trendline Break
Analyst Ash Crypto flagged on X that $BTC just lost its daily trendline, adding that the last time this happened the price dropped 20%. At current levels, a 20% move would bring $BTC toward the $50,000 to $51,000 range, well below the consolidation structure.
🚨 #Bitcoin exchange inflows are spiking to levels not seen since the last cycle bottom.
~228K $BTC recently moved into #Binance deposit addresses, pointing to rising potential sell-side supply. But if bitcoin:native holds $60K–$64K despite elevated inflows, it could signal… pic.twitter.com/7pMXOmAlHq
— Anup Dhungana (@CryptoAnup) August 14, 2026
Analyst Anup Dhungana added a separate but related signal: approximately 228,000 $BTC recently moved into Binance deposit addresses, a level of exchange inflows not seen since the last cycle bottom. When large amounts of $BTC move to exchanges, it typically means holders are preparing to sell. Dhungana’s counterpoint is that if $BTC holds the $60,000 to $64,000 zone despite that elevated sell-side pressure, it would signal that demand is strong enough to absorb it, which would be a bullish read.
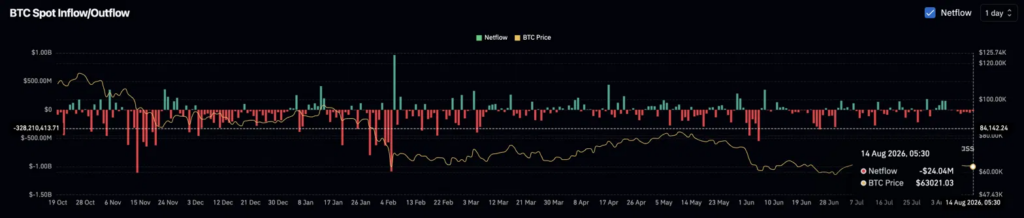
Meanwhile, $BTC spot netflow registered -$24.04M on August 14, meaning more $BTC moved off exchanges than onto them on the day itself, creating a short-term contradiction with the Binance inflow data. The divergence between the Binance deposit spike and the daily netflow going negative is worth watching as the week closes.
Related: AKEDO Price Prediction: Can $AKE Sustain Its Explosive Breakout Above $0.008?
Will $BTC Hold $61,500? Bullish and Bearish Bitcoin Price Predictions
Bullish Case, Target: $67,000 (Range Upper Boundary)
This bullish Bitcoin price prediction holds if $BTC keeps the $61,500 to $62,000 range floor on a daily close despite the trendline break, proving the consolidation structure is intact. The 228K $BTC entering Binance gets absorbed by buyers rather than sold into the market, and ETF outflows stabilize through Friday’s remaining session. Price recovers toward the 20-day EMA at $63,920 and the 50-day at $64,412, with $67,000 as the range target if momentum builds.
Bearish Case, Risk Level: $58,000 (Cup Base)
The bearish Bitcoin price prediction plays out if the range lower boundary at $61,500 fails on a daily close as the trendline break follows the prior 20% pattern Ash Crypto flagged. ETF outflows extend through Friday and exchange inflows from the 228K $BTC wave translate into sustained selling pressure. $BTC exits the consolidation range to the downside toward the cup base near $58,000 as the next meaningful support.
Conclusion
This Bitcoin price prediction comes down to a fairly narrow range: $61,500 on the downside, $67,000 on the upside, with $BTC currently sitting closer to the floor than the ceiling. The trendline break, the ETF outflow reversal, and the Binance deposit spike are three separate warning signs landing in the same session, which is unusual and worth taking seriously.
But none of them are confirmed yet: the netflow contradiction shows real ambiguity in the exchange-flow data, and Dhungana’s own framing is that $BTC holding through this pressure would actually be bullish. The next daily close relative to $61,500 is likely to settle which read was right.
FAQs Related to Bitcoin Price Prediction
$BTC trades at $63,038 after losing its daily trendline. The bullish Bitcoin price prediction targets $67,000; the bearish case risks $58,000 if the $61,500 range floor breaks.
$BTC lost a daily trendline that had supported every bounce since May, a break analyst Ash Crypto says previously preceded a 20% decline, compounding a second straight week of ETF outflows.
It removes a technical support level that had held through multiple pullbacks since May. The last comparable break, per Ash Crypto, led to a 20% drop, which at current prices would mean roughly $50,000 to $51,000.
Spot Bitcoin ETFs posted $332.08M in net outflows for the week through August 13, reversing an $853.54M inflow week just seven days earlier. Sustained outflows remove a source of buying pressure that had been supporting price.
It’s a signal worth watching, since large exchange inflows often precede selling, but it’s not confirmed bearish. Same-day market-wide netflow was actually negative, and analyst Anup Dhungana notes that if $BTC absorbs the selling and holds $60,000 to $64,000, it would actually be a bullish sign.
The Bitcoin price prediction carries real near-term risk from the trendline break and ETF outflows, but the range structure remains technically intact above $61,500. Weigh the bullish and bearish cases above against your own risk tolerance.