Bitcoin ($BTC) began the week cautiously after falling by more than 3% during the previous week.
Bitcoin is attempting to stabilize above the important $62,300 support level, while Ethereum continues to consolidate.
XRP, meanwhile, trades near the psychologically significant $1.00 mark as weakening momentum raises the possibility of further losses.
Bitcoin stabilizes above the $62,300 support level
Bitcoin has started the week positively, adding less than 1% to its value over the last 24 hours.
The leading cryptocurrency by market cap is trading above $63,300 on Monday, holding above $63,000 after finding support around the lower boundary of its recent trading range.
Despite this stabilization, $BTC maintains a bearish short-term outlook.
The largest cryptocurrency remains below the 50-day Exponential Moving Average (EMA) at $64,306 and considerably beneath the 100-day and 200-day EMAs at $66,388 and $71,800, respectively.
Trading below all three averages indicates that sellers continue to control the broader trend.
Bitcoin would need to recover above its shorter-term moving averages to signal that bullish momentum is returning.
Momentum indicators reflect continued selling pressure
Bitcoin’s technical indicators support the cautious outlook. The Relative Strength Index (RSI) stands at 43, placing it in neutral-to-weak territory.
Although the indicator remains above oversold levels, its position below the midpoint of 50 suggests that bearish momentum still outweighs buying pressure.
The Moving Average Convergence Divergence (MACD) indicator also remains in negative territory.
This reinforces the view that sellers retain an advantage despite Bitcoin’s ability to stabilize above $63,000.
Continued weakness in both indicators could make it difficult for $BTC to sustain a recovery unless fresh buying demand emerges.
Bitcoin’s first significant resistance level is the 50-day EMA at $64,306. A move above this average could encourage buyers, but $BTC would still face a stronger concentration of resistance at higher levels.
The 38.2% Fibonacci retracement of the latest price swing sits at $65,547. Above that, the 100-day EMA at $66,388 closely aligns with the horizontal resistance level at $66,500.
This creates a broad resistance zone between approximately $65,547 and $66,500. Bitcoin would need to record a decisive daily close above this region to reduce the current bearish bias.
A confirmed breakout could open the door to the 50% Fibonacci retracement level at $67,940.
On the downside, immediate support is located at the 23.6% Fibonacci retracement level of $62,586.
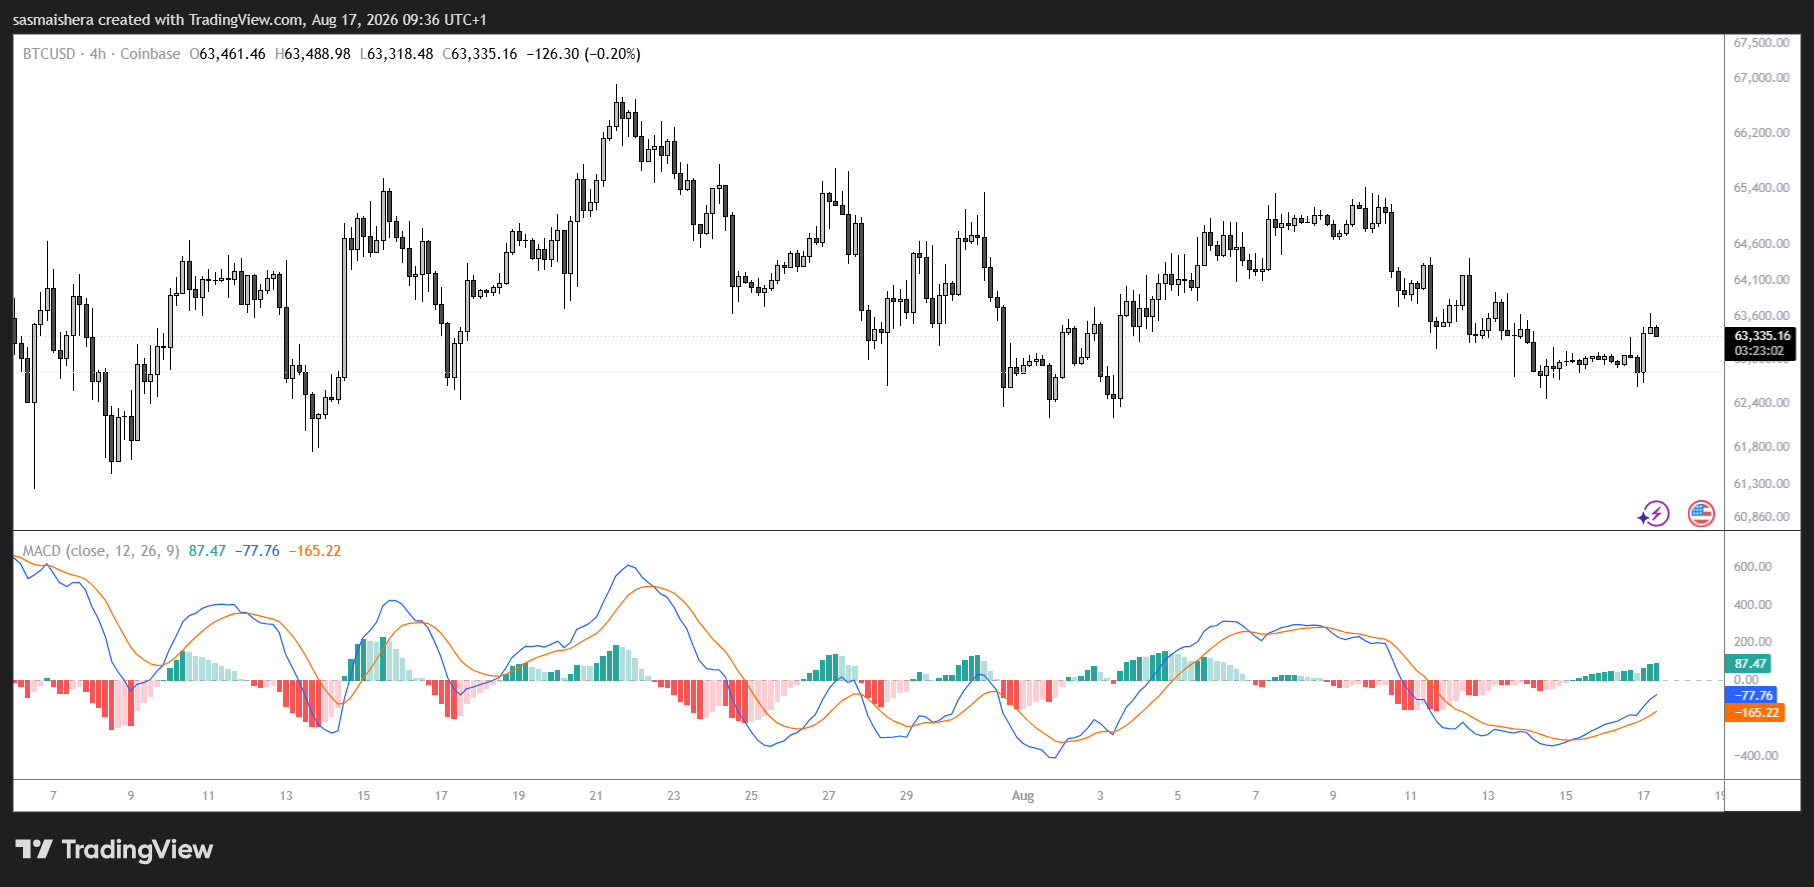
The more important horizontal support sits slightly lower at $62,300. Buyers have so far defended this area, making it a critical level for Bitcoin’s near-term direction.
A daily close below $62,300 would invalidate the recent stabilization and could expose $BTC to a deeper decline toward the lower boundary of its broader trading range.
Until Bitcoin breaks above the resistance cluster near $66,500, any short-term recovery is likely to remain vulnerable to renewed selling pressure.