Key takeaways
- Bitcoin, Ethereum, and $XRP have gained nearly 20%, over 25%, and almost 30%, respectively, this week.
- Expanded U.S. Treasury debt buybacks have improved liquidity expectations and boosted demand for risk assets.
- Bitcoin trades around $76,800 after breaking above its 50-day, 100-day, and 200-day exponential moving averages.
Bitcoin, Ethereum, and $XRP extended their rallies Friday as improving liquidity expectations continued to lift the broader cryptocurrency market.
Bitcoin has gained nearly 20% this week, while Ethereum has risen more than 25% and $XRP has advanced almost 30%.
The rally gained momentum after the U.S. Treasury announced plans to double the size of certain debt buyback operations.
The decision eased liquidity concerns and strengthened demand for risk-sensitive assets.
With the three cryptocurrencies trading firmly higher, investors are now watching whether Bitcoin can reach $80,000, Ethereum can reclaim $2,500, and $XRP can advance toward $1.50.
Treasury buyback expansion strengthens crypto rally
The U.S. Treasury’s decision to expand its debt buyback program has helped improve sentiment across financial markets.
Larger buybacks can support liquidity in the market for longer-dated Treasury securities, easing financial pressures and encouraging investors to increase their exposure to riskier assets.
Cryptocurrencies responded strongly to the announcement, with Bitcoin, Ethereum, and $XRP recording double-digit weekly gains.
Short liquidations also accelerated the rally as bearish traders were forced to close their positions, adding further buying pressure.
Bitcoin was trading around $76,800 on Friday after decisively breaking above its major exponential moving averages.
The 200-day EMA stands at $71,545, while the 100-day and 50-day EMAs are located at $66,727 and $65,286, respectively.
$BTC’s position above all three indicators supports a bullish near-term outlook and suggests the market’s broader technical structure has improved considerably.
The breakout was accompanied by strong trading volume, adding credibility to the latest upward move.
Sustained trading above the 200-day EMA would reinforce the case for further gains and could establish the level as new support.
$BTC bulls target the $80,000 resistance
Bitcoin’s next major resistance lies near the psychological and horizontal barrier at $80,000.
A move from $74,700 to $80,000 would represent an additional gain of approximately 7.1%.
However, the $80,000 level could attract profit-taking and fresh selling pressure following Bitcoin’s rapid weekly advance.
A decisive break and daily close above the barrier would strengthen the bullish outlook and potentially open the way to higher levels.
Failure to clear $80,000 could lead to a period of consolidation as traders digest the recent gains.
Bitcoin’s momentum indicators remain bullish but increasingly stretched. The relative strength index is hovering near 83, placing $BTC firmly in overbought territory. Such an elevated reading does not guarantee an immediate reversal, but it indicates that the rally may be vulnerable to a corrective pause.
The moving average convergence divergence remains strongly positive, showing that upward momentum is still intact.
Together, the indicators suggest bulls remain in control, although the risk of short-term profit-taking has increased.
If Bitcoin retreats, initial support sits at the 200-day EMA near $71,545. Holding above this indicator would preserve the immediate bullish structure and could provide a foundation for another attempt at $80,000.
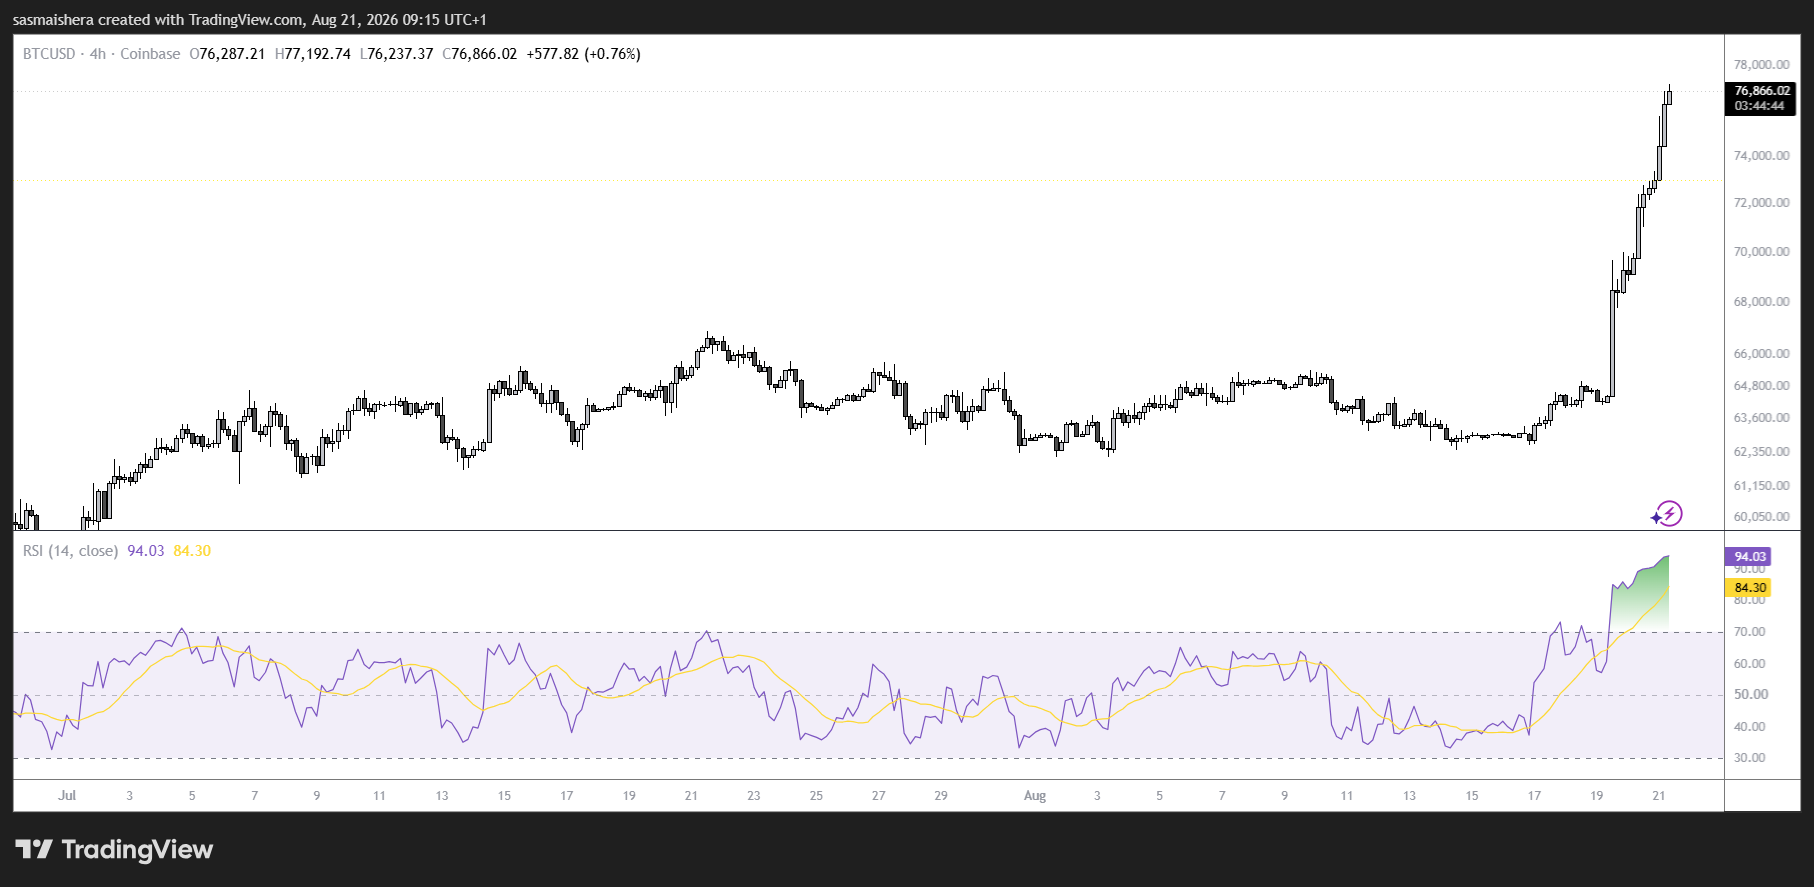
A deeper correction could bring the 100-day EMA at $66,727 and the nearby horizontal level at $66,500 into focus.
Below that region, the 50-day EMA at $65,286 offers another layer of support, followed by the structural floor at $62,300.
A sustained decline below $62,300 would weaken the broader bullish outlook, while continued trading above the 200-day EMA would keep the $80,000 target within reach.